|
| matplotlib Tutorials. |
H.Kamifuji . |
- Tutorials
このページには、Matplotlib を使用するためのより詳細なガイドが含まれています。 初心者、中級、上級のセクションと特定のトピックを扱うセクションに分かれています。
より短い例については、例のページを参照してください。 また、外部リソースとFAQは、ユーザーガイドで見つけることができます。
- Introductory
これらのチュートリアルでは、Matplotlib によるビジュアライゼーションの作成の基本と、パッケージを効果的に使用するためのベストプラクティスについて説明します。
Usage Guide
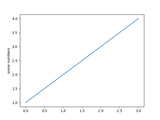
Pyplot tutorial
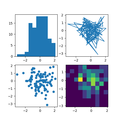
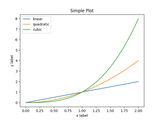
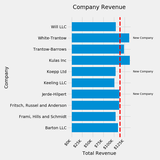
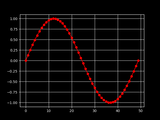
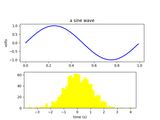
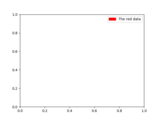
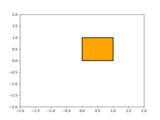
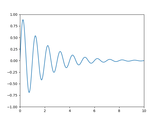
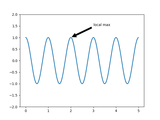
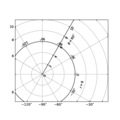
Sample plots in Matplotlib
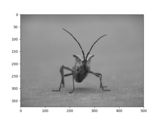
Image tutorial
The Lifecycle of a Plot
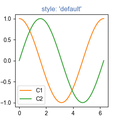
Customizing Matplotlib with style sheets and rcParams
- Intermediate
これらのチュートリアルでは、Matplotlib のより複雑なクラスや関数について説明します。 特定のカスタムおよび複雑な視覚化に役立ちます。
Artist tutorial
Legend guide
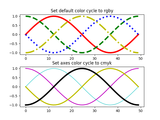
Styling with cycler
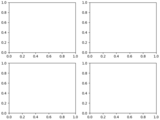
Customizing Figure Layouts Using GridSpec and Other Functions
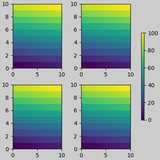
Constrained Layout Guide
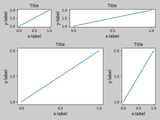
Tight Layout guide
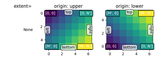
origin and extent in imshow
- Advanced
これらのチュートリアルでは、経験豊富なMatplotlibユーザと開発者のための高度なトピックを扱います。
Path Tutorial

Path effects guide
Transformations Tutorial
- Colors
Matplotlib は、さまざまな色とカラーマップで情報を視覚化する機能をサポートしています。 これらのチュートリアルでは、これらのカラーマップの外観、独自の作成方法、ユースケースのカラーマップのカスタマイズ方法について説明します。
さらに詳しい情報については、例のページを参照してください。
Specifying Colors

Customized Colorbars Tutorial
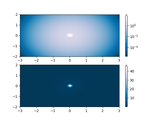
Colormap Normalization
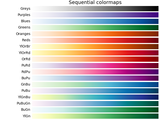
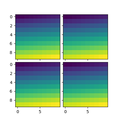
Colormaps in Matplotlib
- Text
matplotlib は、数学的表現のサポート、ラスタとベクトル出力のための truetype サポート、任意の回転を伴う改行文字分離、および Unicode サポートを含む幅広いテキストをサポートしています。 これらのチュートリアルでは、Matplotlib のテキストを扱う際の基本について説明します。
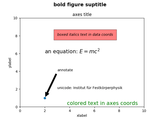
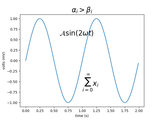
Text in Matplotlib Plots
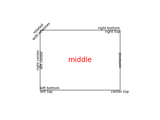
Text properties and layout
Annotations
Annotations

Typesetting With XeLaTeX/LuaLaTeX
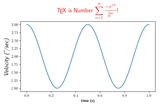
Text rendering With LaTeX
- Toolkits
これらのチュートリアルでは、特定の目標を達成するために Matplotlib の機能を拡張するためのツールキットについて説明します。
Overview of axes_grid1 toolkit
Overview of axisartist toolkit
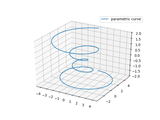
The mplot3d Toolkit
- 参照ページ
Tutorials
- リリースノート
- 2023/03/11 Ver=1.03 Python 3.11.2 で確認
- 2020/10/28 Ver=1.01 Python 3.7.8 で確認
- 2018/11/08 Ver=1.01 初版リリース
- 関連ページ