|
|
matplotlib Colormaps in Matplotlib. |
H.Kamifuji . |
- Colormaps in Matplotlib
特定のカラーマップを選択する方法(そしてその理由)。
- 目 次
- Overview
良いカラーマップを選択する背景にあるアイデアは、データセットの 3D カラースペースを適切に表現することです。 与えられたデータセットに最適なカラーマップは、以下を含む多くのものによって決まります。
- フォームまたはメトリックデータを表示するかどうか([Ware])
- データセットに関するあなたの知識(例えば、他の値が逸脱する重要な値がありますか?)
- プロットしているパラメータに直感的な配色がある場合
- フィールドに標準がある場合、視聴者は期待しているかもしれません
色は 3D 空間でさまざまな方法で表現できます。 色を表現する 1 つの方法は、CIELAB を使用することです。 CIELAB では、色空間は明度 で表されます。 赤、緑
  、 ; 黄色、青色
  。 次に、明度パラメータ を使用して、matplotlib カラーマップが視聴者にどのように認識されるかを知ることができます。
人間がカラーマップを認識するための優れた出発点は、[IBM]からです。
- Classes of colormaps
カラーマップは、その機能に基づいていくつかのカテゴリに分割されることが多い(例えば、[Moreland] 参照):
- 1.シークエンシング:明度の変化、しばしば単一の色相を使用して徐々に色の彩度を変化させる。 順序付けした情報を表現するために使用する必要があります。
- 2.分散:不飽和色で中間で会う2つの異なる色の明度および場合によっては彩度の変化。 トポグラフィやデータがゼロ付近で逸脱した場合など、プロットされる情報がクリティカルな中間値を持つ場合に使用する必要があります。
- 3.サイクリック:不飽和色の中間と始まり/終わりで出会う2つの異なる色の明度の変化。 風の方向や時刻など、端点でラップアラウンドする値に使用する必要があります。
- 4.品質:しばしば雑多な色です。 順序付けや関係のない情報を表すために使用する必要があります。
# sphinx_gallery_thumbnail_number = 2

import numpy as np
import matplotlib as mpl
import matplotlib.pyplot as plt
from matplotlib import cm
from colorspacious import cspace_converter
from collections import OrderedDict

cmaps = OrderedDict()
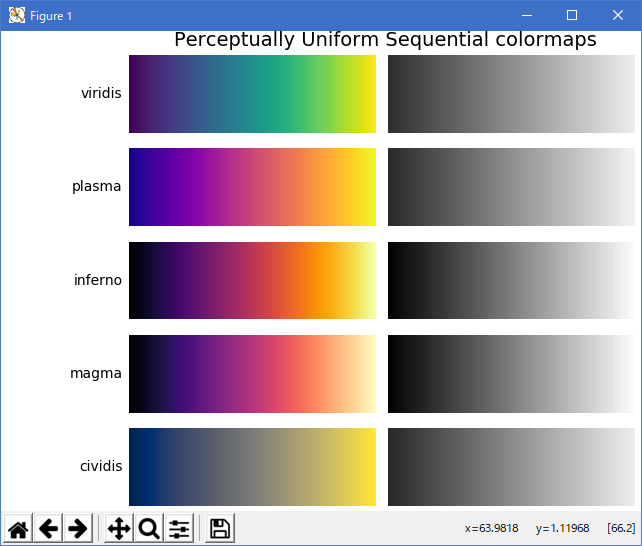
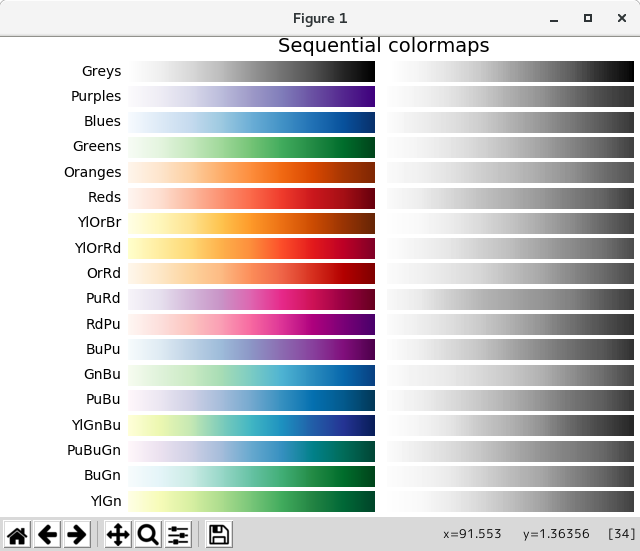
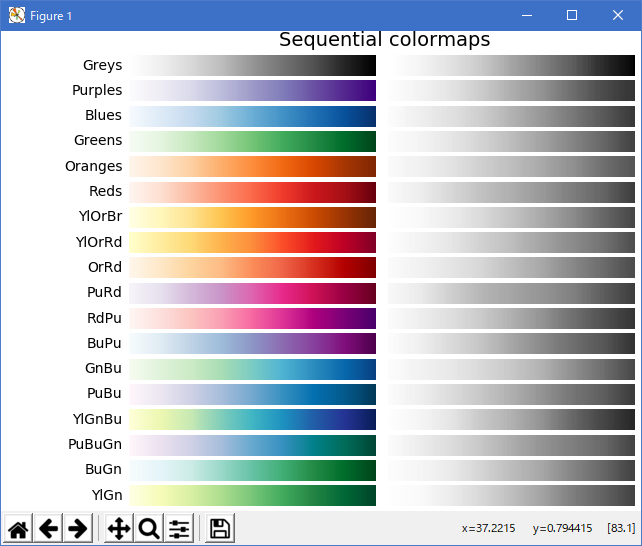
- Sequential
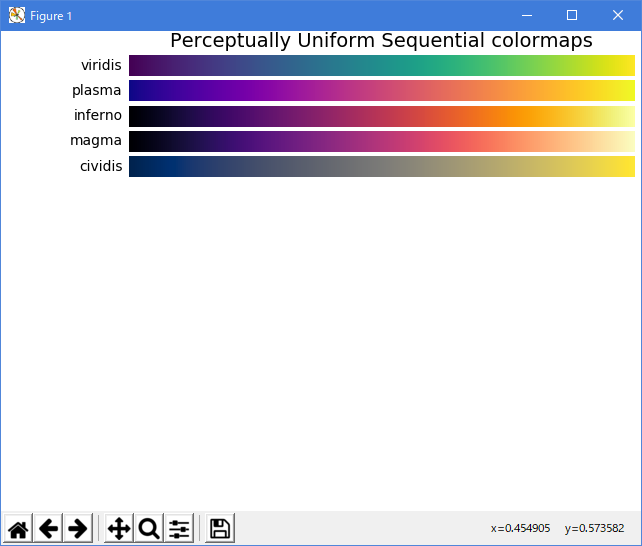
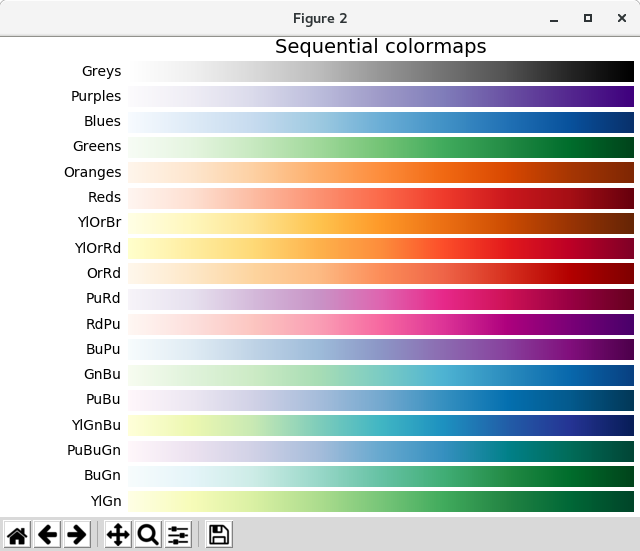
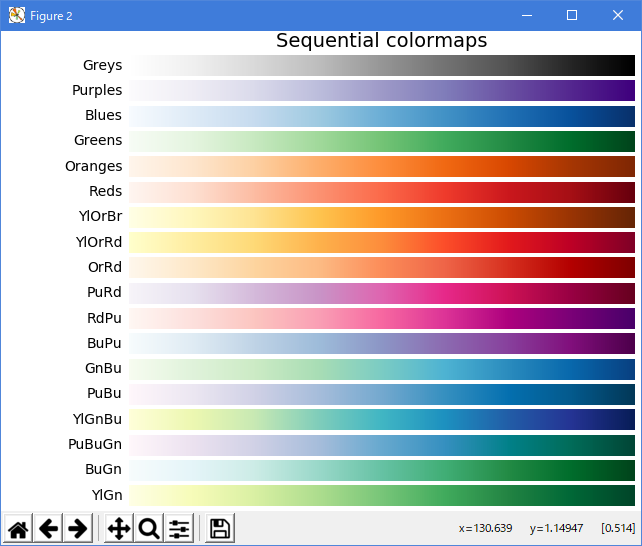
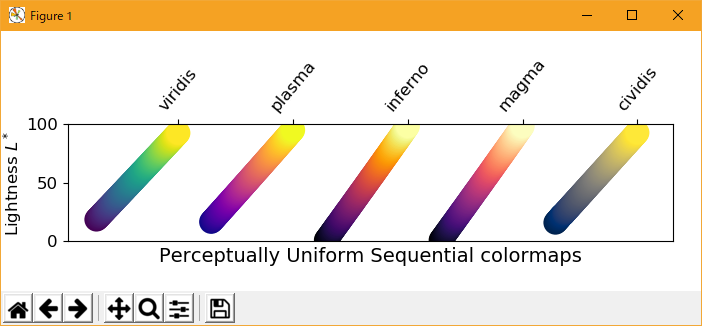
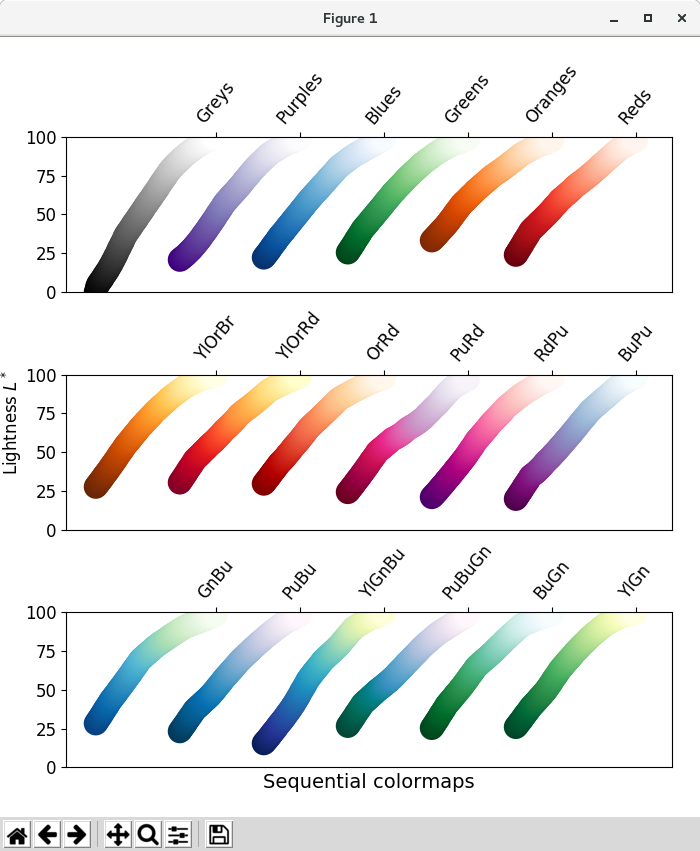
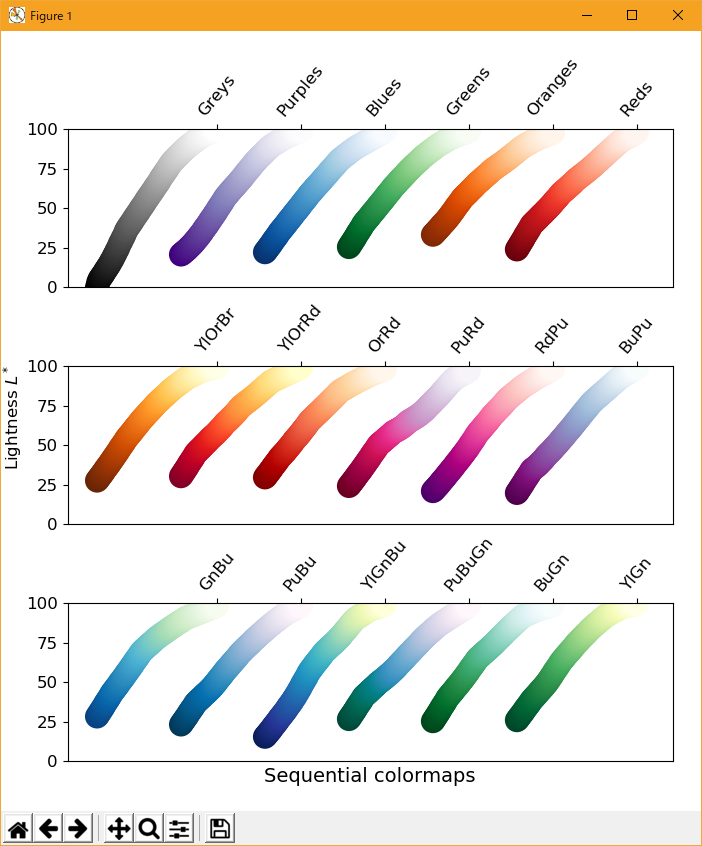
Sequential プロットの場合、明度値はカラーマップを通して単調増加します。 これはいい。 カラーマップの  値の中には、0 to 100(バイナリと他のグレースケール)の値があり、他の値は周囲から始まります。 したがって、より小さい範囲を有するものは、知覚範囲がより小さくなる。 関数はカラーマップ間で変化することにも注意してください。いくつかはほぼ線形であり、他はより曲線です。
cmaps['Perceptually Uniform Sequential'] = [
            'viridis', 'plasma', 'inferno', 'magma', 'cividis']

cmaps['Sequential'] = [
            'Greys', 'Purples', 'Blues', 'Greens', 'Oranges', 'Reds',
            'YlOrBr', 'YlOrRd', 'OrRd', 'PuRd', 'RdPu', 'BuPu',
            'GnBu', 'PuBu', 'YlGnBu', 'PuBuGn', 'BuGn', 'YlGn']
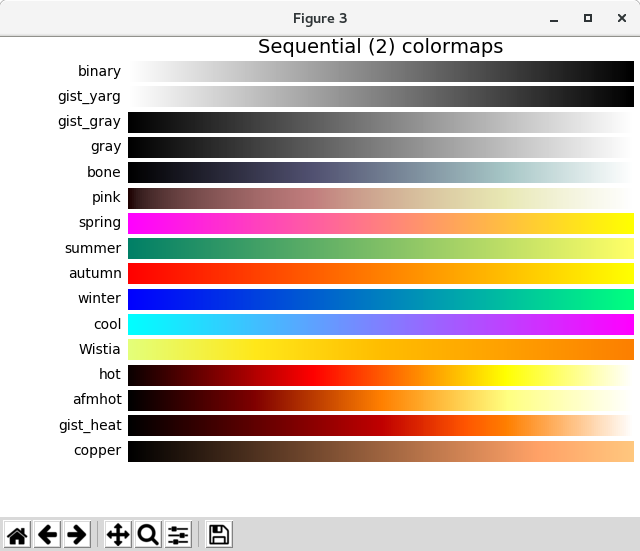
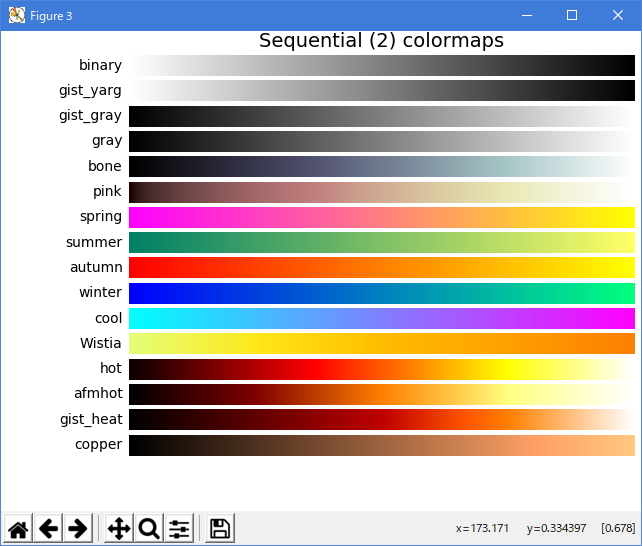
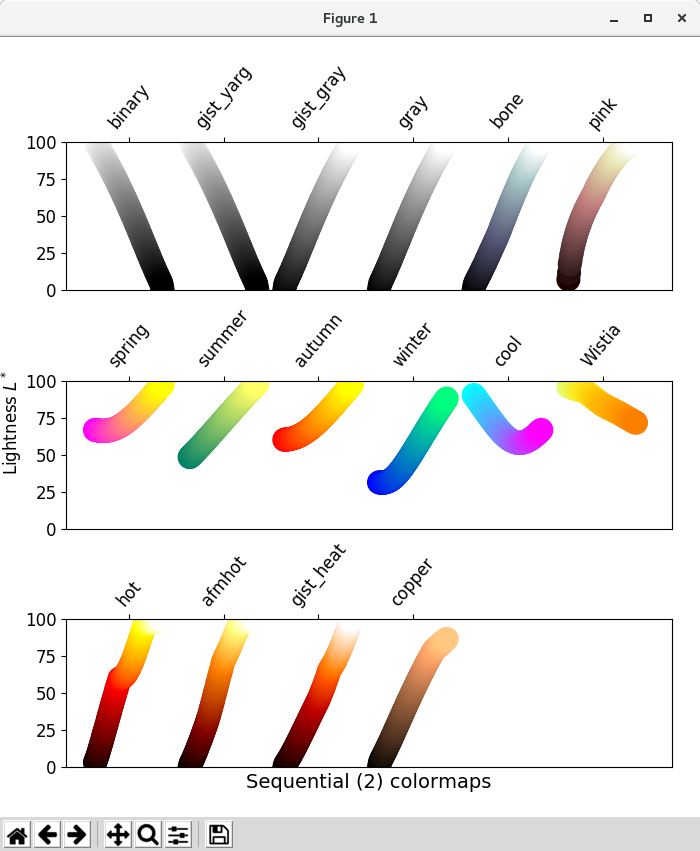
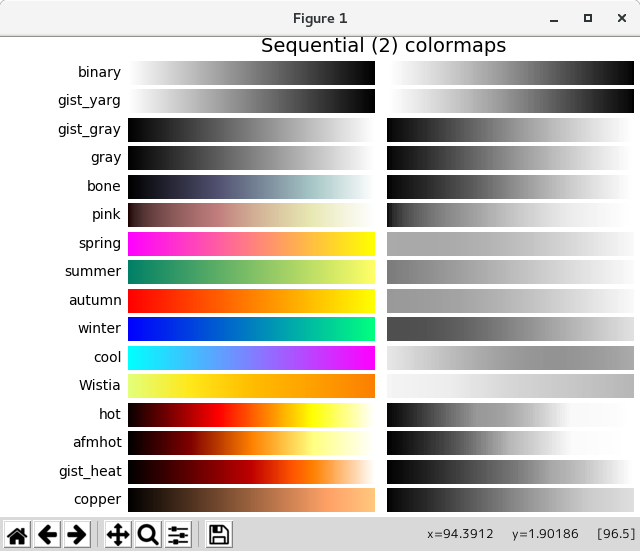
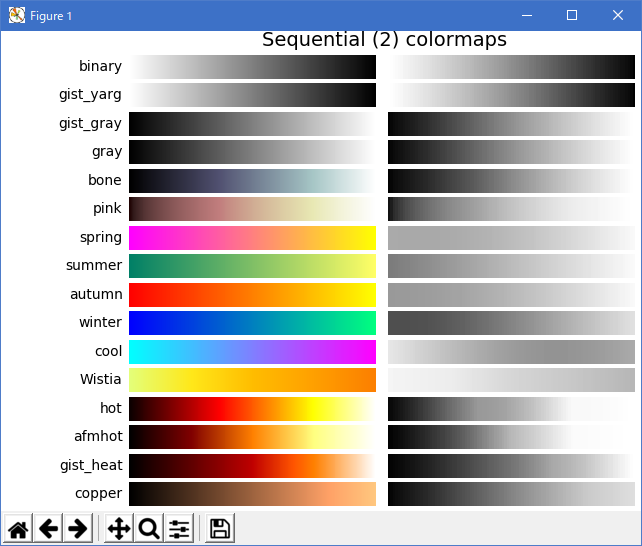
- Sequential2
Sequential2 プロットの 値の多くは、単調に増加していますが、一部(秋、涼、春、冬)の高原、または宇宙で上下に移動します。 その他のもの( afmhot、copper、gist_heat、hot )には、機能の不具合があります。 カラーマップのある場所にあるプラトーやキンクにあるデータは、カラーマップ内の値のバンディングの認識につながります(この優れた例については、[mycarta-banding] を参照してください)。
cmaps['Sequential (2)'] = [
            'binary', 'gist_yarg', 'gist_gray', 'gray', 'bone', 'pink',
            'spring', 'summer', 'autumn', 'winter', 'cool', 'Wistia',
            'hot', 'afmhot', 'gist_heat', 'copper']
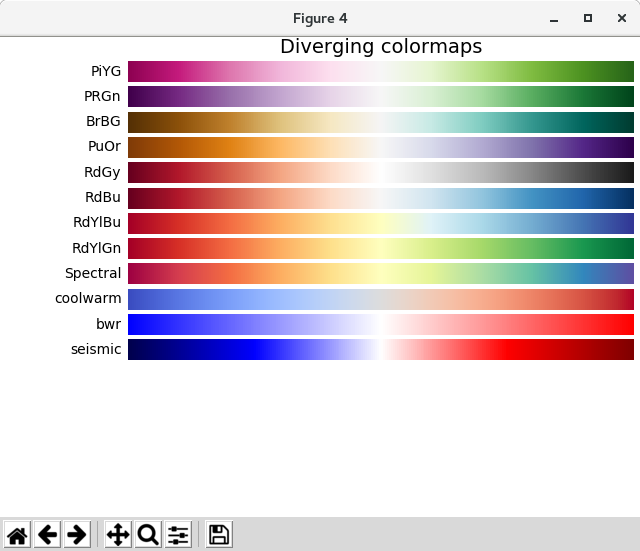
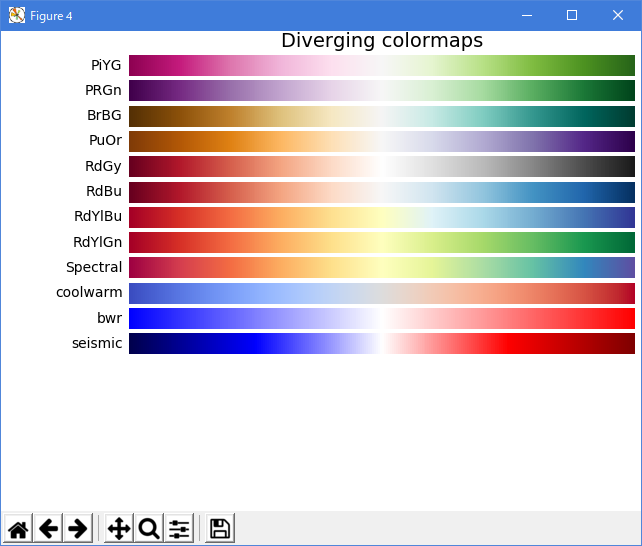
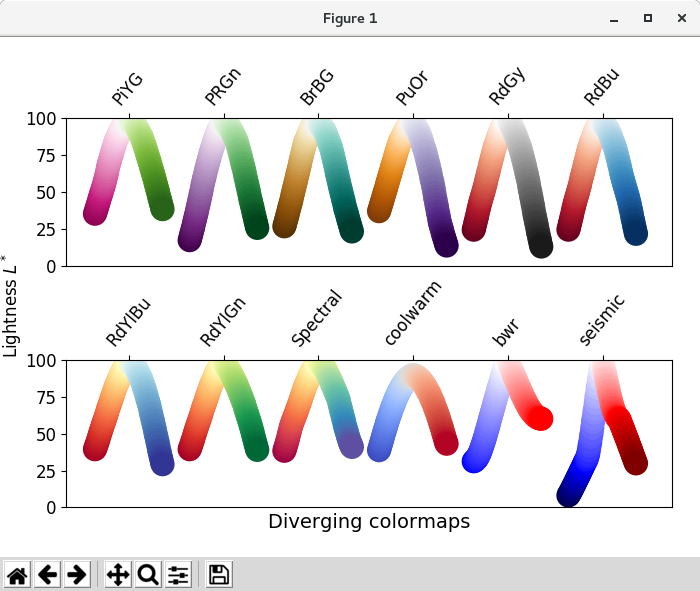
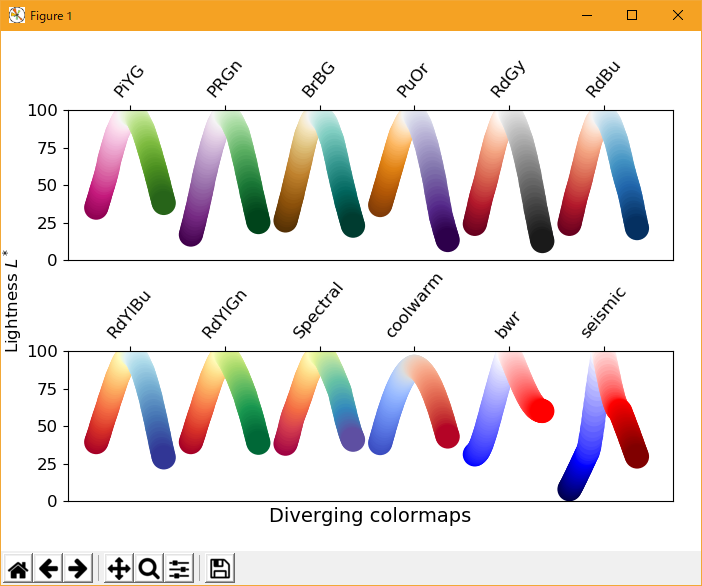
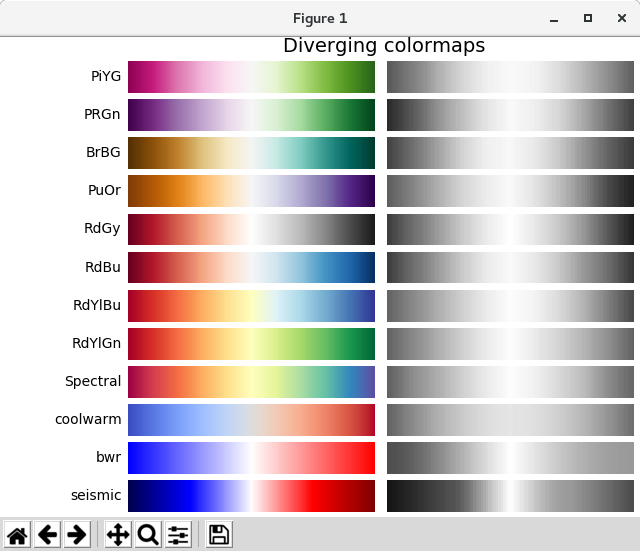
- Diverging
ダイバージングマップでは、単調に増加する 値を最大値まで近づけ、単調に減少する値にする必要があります。 カラーマップの両端でほぼ等しい最小値を探しています。 これらの措置によって、BrBGとRdBu は良い選択肢です。 coolwarm は良い選択肢ですが、幅広い値に対応していません(下記のグレースケールのセクションを参照)。
cmaps['Diverging'] = [
            'PiYG', 'PRGn', 'BrBG', 'PuOr', 'RdGy', 'RdBu',
            'RdYlBu', 'RdYlGn', 'Spectral', 'coolwarm', 'bwr', 'seismic']
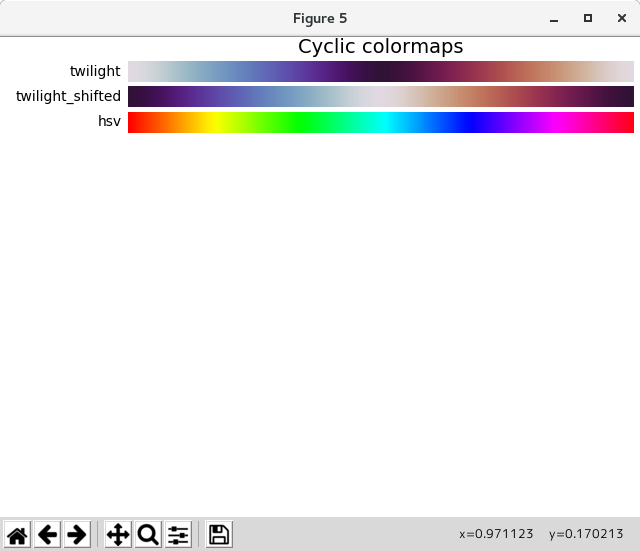
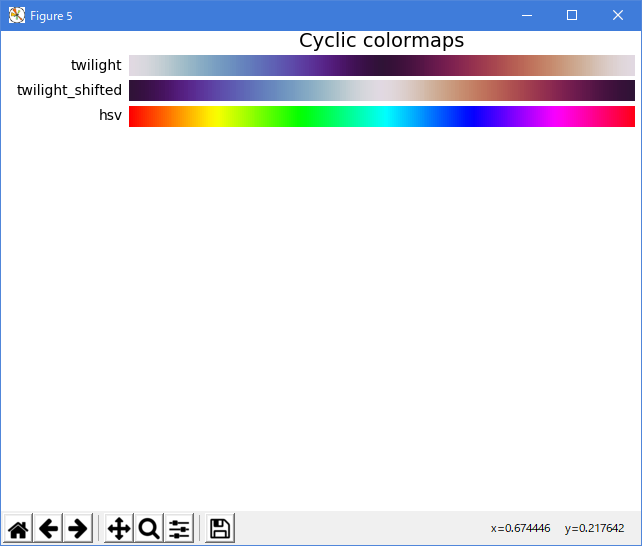
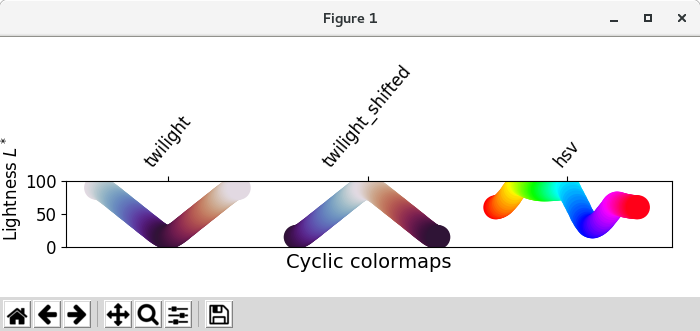
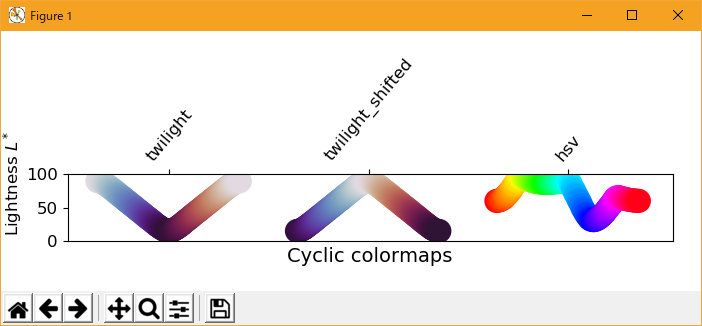
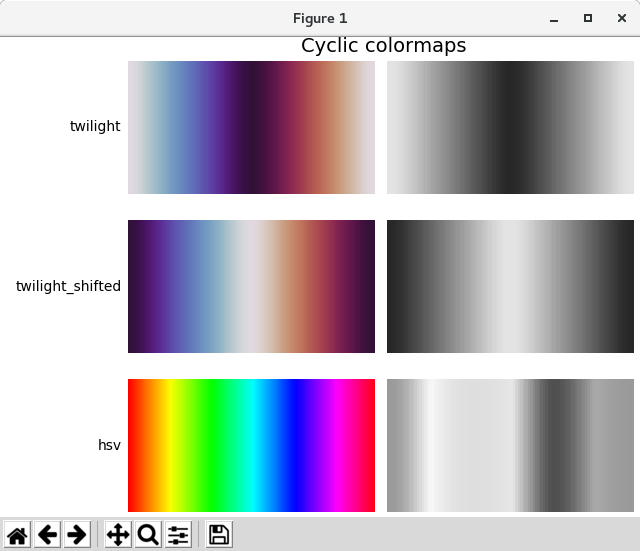
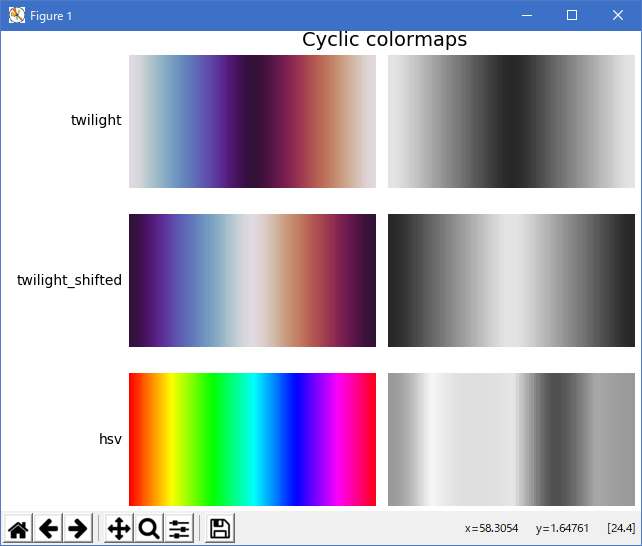
- Cyclic
巡回マップでは、同じ色で開始して終了し、真ん中の対称な 中心点を満たす必要があります。 最初から最後まで単調に変化し、終わりから終わりにかけて単調に変化するはずです。 これは、増加側と減少側で対称で、色相が異なるだけです。 端と中央で方向を逆転させます。方向は空間内で平滑化してアーチファクトを減らします。 周期的なマップの設計の詳細については、[kovesi-colormaps] を参照してください。
頻繁に使用される HSV カラーマップは、カラーマップのセットに含まれますが、中心点と対称ではありません。 さらに、値はカラーマップ全体で大きく異なり、視聴者が知覚的に見るためのデータを表現するには不適切です。 [mycarta-jet] のこのアイデアの拡張部分を参照してください。
cmaps['Cyclic'] = ['twilight', 'twilight_shifted', 'hsv']
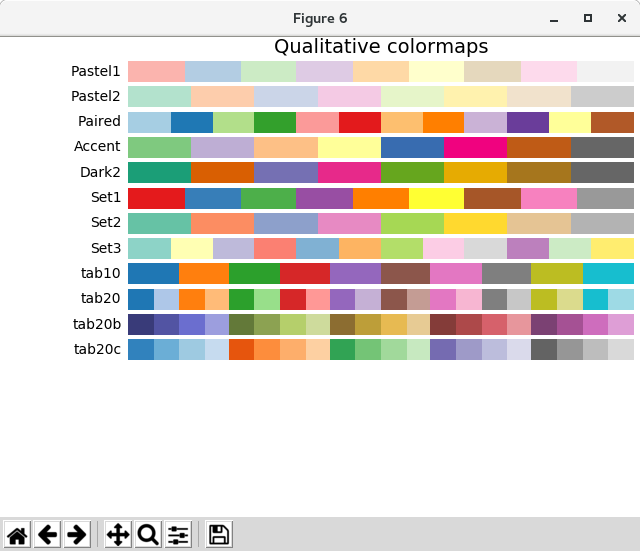
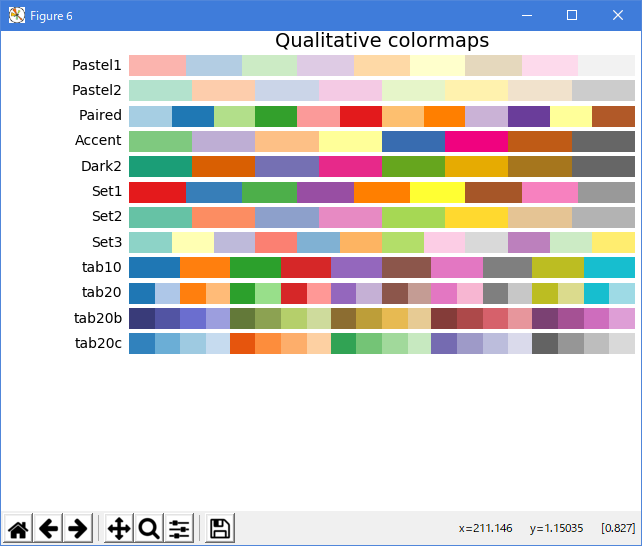
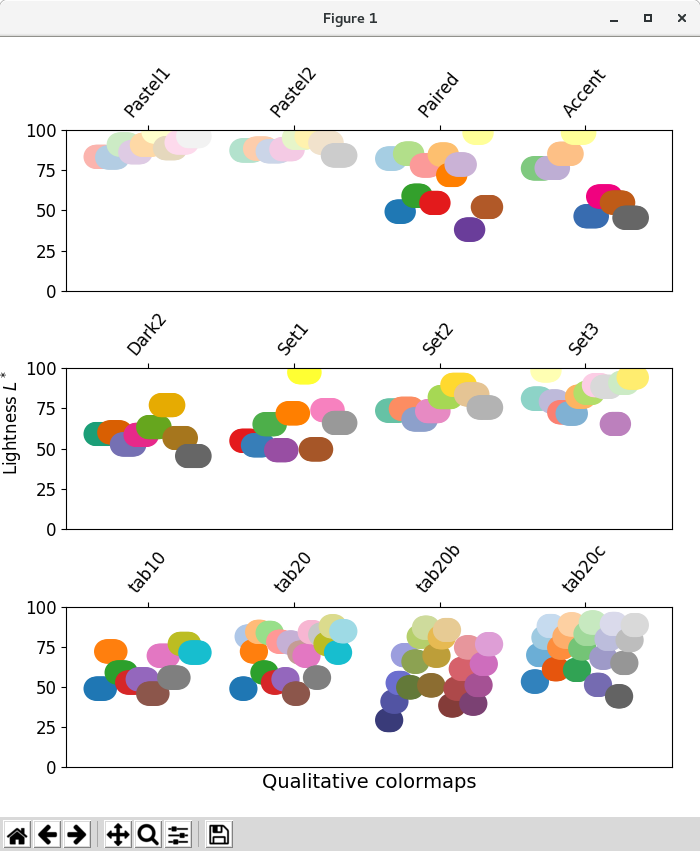
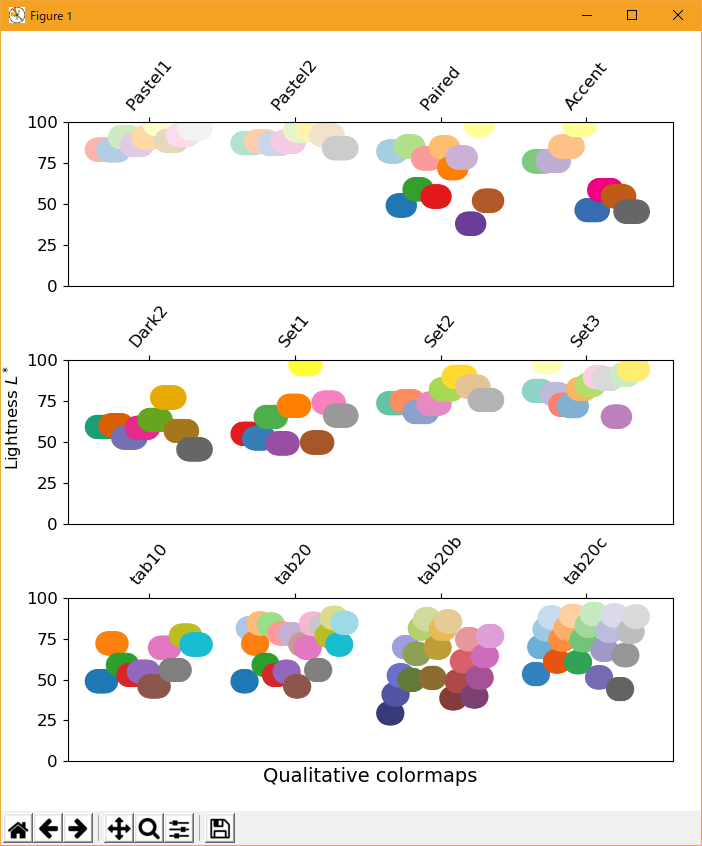
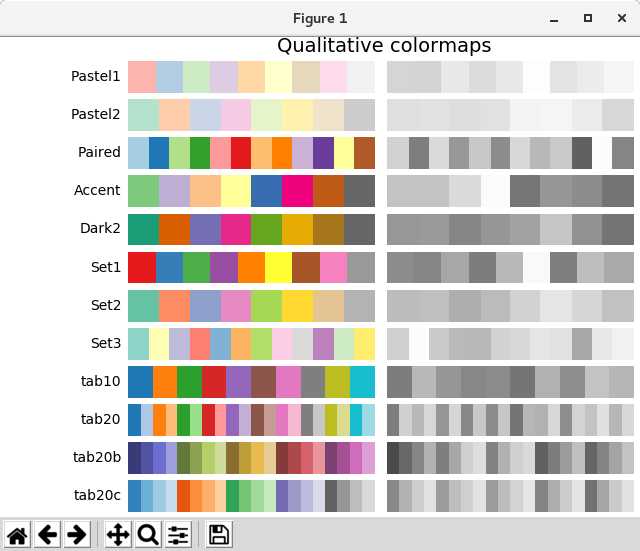
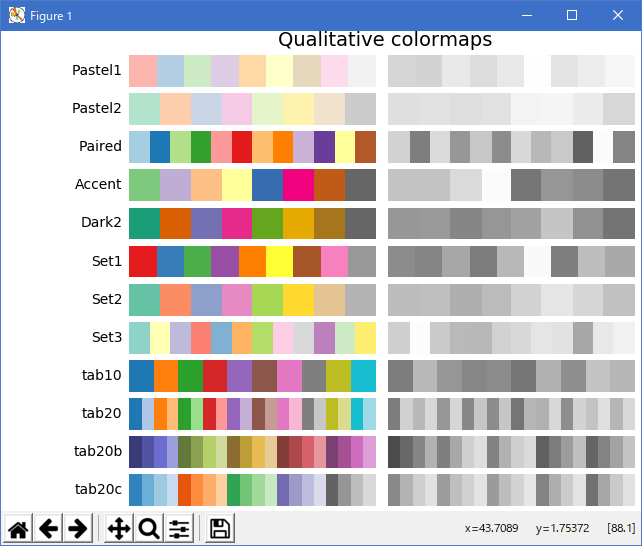
- Qualitative
定性的なカラーマップは、知覚マップを目指すのではなく、明度パラメータを見ることで、それが私たちのために確認できます。 値はカラーマップ全体のどこにでも移動し、単調に増加しません。 これらは、知覚的なカラーマップとしての使用には適していません。
cmaps['Qualitative'] = ['Pastel1', 'Pastel2', 'Paired', 'Accent',
                        'Dark2', 'Set1', 'Set2', 'Set3',
                        'tab10', 'tab20', 'tab20b', 'tab20c']
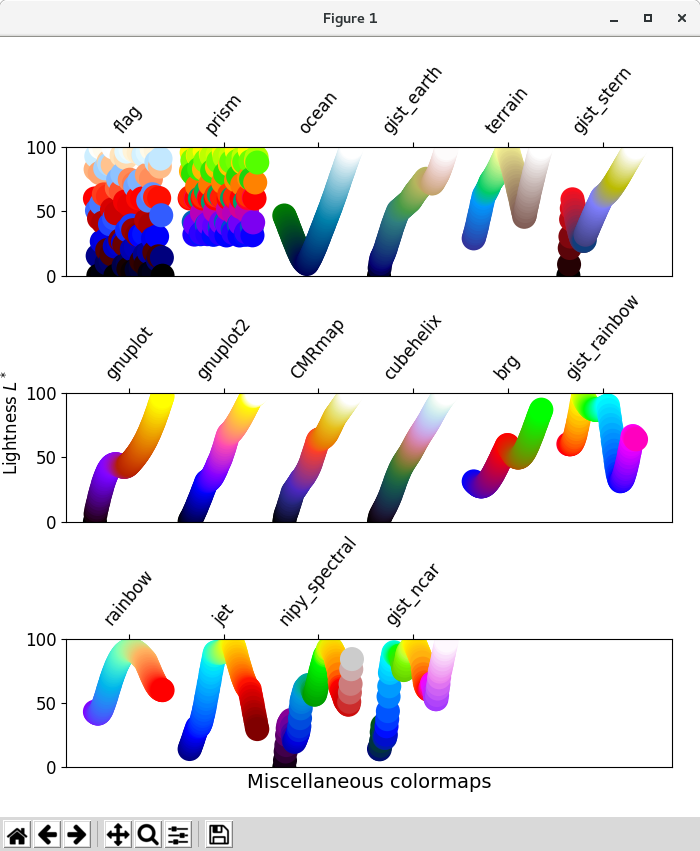
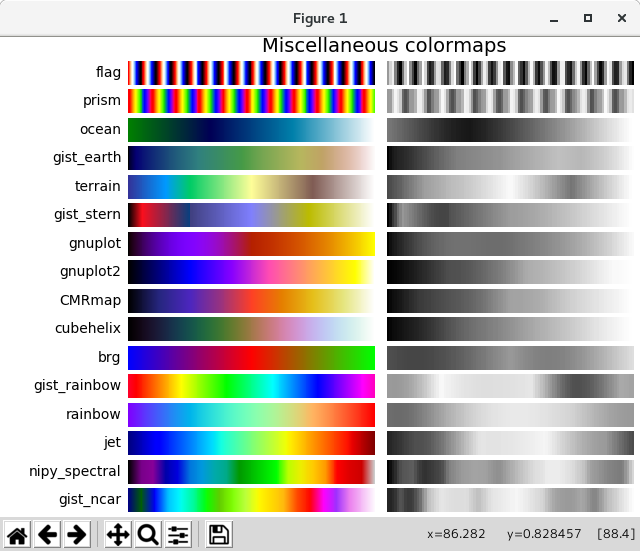
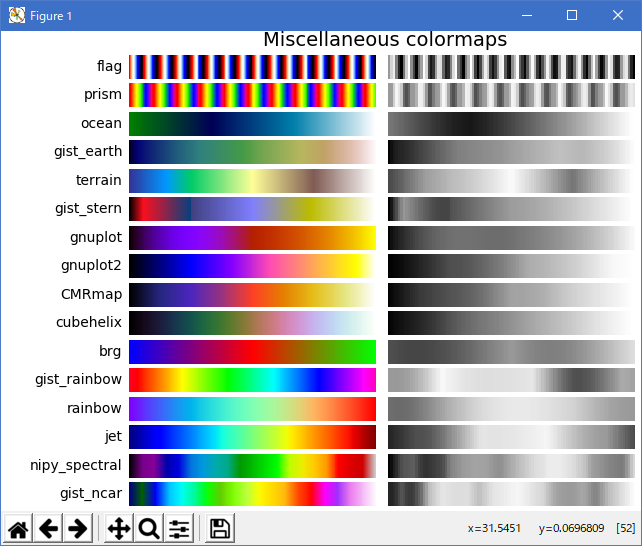
- Miscellaneous
その他のカラーマップの中には、それらが作成された特定の用途があります。 たとえば、gist_earth、ocean、および terrain はすべて、地形(緑色/茶色)と水深(青色)を一緒にプロットするために作成されたようです。 これらのカラーマップでは相違が見られるはずですが、gist_earthやterrain など、複数のねじれが理想的でない場合があります。 CMRmap はグレースケールに変換するために作成されましたが、 に、いくつかの小さな欠点があります。 cubehelix は、明度と色相の両方で滑らかに変化するように作成されましたが、緑の色相領域には小さな塊があるように見えます。
頻繁に使用されるジェットカラーマップは、このカラーマップセットに含まれています。 この値は、カラーマップ全体で大きく異なるため、視聴者が知覚的に見るためのデータを表現するには不適切です。 [mycarta-jet] のこのアイデアの拡張部分を参照してください。
cmaps['Miscellaneous'] = [
            'flag', 'prism', 'ocean', 'gist_earth', 'terrain', 'gist_stern',
            'gnuplot', 'gnuplot2', 'CMRmap', 'cubehelix', 'brg',
            'gist_rainbow', 'rainbow', 'jet', 'nipy_spectral', 'gist_ncar']
まず、各カラーマップの範囲を示します。 いくつかは他のものよりも "quickly" に変化するように見えることに注意してください。
# sphinx_gallery_thumbnail_number = 2

import numpy as np
import matplotlib as mpl
import matplotlib.pyplot as plt
from matplotlib import cm
# from colorspacious import cspace_converter
from collections import OrderedDict

cmaps = OrderedDict()

cmaps['Perceptually Uniform Sequential'] = [
            'viridis', 'plasma', 'inferno', 'magma', 'cividis']

cmaps['Sequential'] = [
            'Greys', 'Purples', 'Blues', 'Greens', 'Oranges', 'Reds',
            'YlOrBr', 'YlOrRd', 'OrRd', 'PuRd', 'RdPu', 'BuPu',
            'GnBu', 'PuBu', 'YlGnBu', 'PuBuGn', 'BuGn', 'YlGn']

cmaps['Sequential (2)'] = [
            'binary', 'gist_yarg', 'gist_gray', 'gray', 'bone', 'pink',
            'spring', 'summer', 'autumn', 'winter', 'cool', 'Wistia',
            'hot', 'afmhot', 'gist_heat', 'copper']

cmaps['Diverging'] = [
            'PiYG', 'PRGn', 'BrBG', 'PuOr', 'RdGy', 'RdBu',
            'RdYlBu', 'RdYlGn', 'Spectral', 'coolwarm', 'bwr', 'seismic']

cmaps['Cyclic'] = ['twilight', 'twilight_shifted', 'hsv']

cmaps['Qualitative'] = ['Pastel1', 'Pastel2', 'Paired', 'Accent',
                        'Dark2', 'Set1', 'Set2', 'Set3',
                        'tab10', 'tab20', 'tab20b', 'tab20c']

nrows = max(len(cmap_list) for cmap_category, cmap_list in cmaps.items())
gradient = np.linspace(0, 1, 256)
gradient = np.vstack((gradient, gradient))


def plot_color_gradients(cmap_category, cmap_list, nrows):
    fig, axes = plt.subplots(nrows=nrows)
    fig.subplots_adjust(top=0.95, bottom=0.01, left=0.2, right=0.99)
    axes[0].set_title(cmap_category + ' colormaps', fontsize=14)

    for ax, name in zip(axes, cmap_list):
        ax.imshow(gradient, aspect='auto', cmap=plt.get_cmap(name))
        pos = list(ax.get_position().bounds)
        x_text = pos[0] - 0.01
        y_text = pos[1] + pos[3]/2.
        fig.text(x_text, y_text, name, va='center', ha='right', fontsize=10)

    # Turn off *all* ticks & spines, not just the ones with colormaps.
    for ax in axes:
        ax.set_axis_off()


for cmap_category, cmap_list in cmaps.items():
    plot_color_gradients(cmap_category, cmap_list, nrows)

plt.show()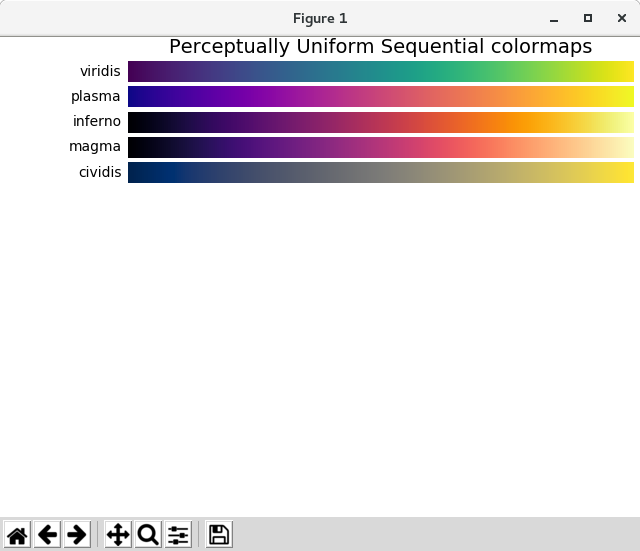
- Lightness of matplotlib colormaps
ここでは、Matplotlib カラーマップの明度値を調べます。 カラーマップに関するいくつかのドキュメントが利用可能であることに注意してください( [list-colormaps] )。
import numpy as np
import matplotlib as mpl
import matplotlib.pyplot as plt
from matplotlib import cm
from colorspacious import cspace_converter
from collections import OrderedDict

cmaps = OrderedDict()

cmaps['Perceptually Uniform Sequential'] = [
            'viridis', 'plasma', 'inferno', 'magma', 'cividis']

cmaps['Sequential'] = [
            'Greys', 'Purples', 'Blues', 'Greens', 'Oranges', 'Reds',
            'YlOrBr', 'YlOrRd', 'OrRd', 'PuRd', 'RdPu', 'BuPu',
            'GnBu', 'PuBu', 'YlGnBu', 'PuBuGn', 'BuGn', 'YlGn']

cmaps['Sequential (2)'] = [
            'binary', 'gist_yarg', 'gist_gray', 'gray', 'bone', 'pink',
            'spring', 'summer', 'autumn', 'winter', 'cool', 'Wistia',
            'hot', 'afmhot', 'gist_heat', 'copper']

cmaps['Diverging'] = [
            'PiYG', 'PRGn', 'BrBG', 'PuOr', 'RdGy', 'RdBu',
            'RdYlBu', 'RdYlGn', 'Spectral', 'coolwarm', 'bwr', 'seismic']

cmaps['Cyclic'] = ['twilight', 'twilight_shifted', 'hsv']

cmaps['Qualitative'] = ['Pastel1', 'Pastel2', 'Paired', 'Accent',
                        'Dark2', 'Set1', 'Set2', 'Set3',
                        'tab10', 'tab20', 'tab20b', 'tab20c']

cmaps['Miscellaneous'] = [
            'flag', 'prism', 'ocean', 'gist_earth', 'terrain', 'gist_stern',
            'gnuplot', 'gnuplot2', 'CMRmap', 'cubehelix', 'brg',
            'gist_rainbow', 'rainbow', 'jet', 'nipy_spectral', 'gist_ncar']

mpl.rcParams.update({'font.size': 12})

# Number of colormap per subplot for particular cmap categories
_DSUBS = {'Perceptually Uniform Sequential': 5, 'Sequential': 6,
          'Sequential (2)': 6, 'Diverging': 6, 'Cyclic': 3,
          'Qualitative': 4, 'Miscellaneous': 6}

# Spacing between the colormaps of a subplot
_DC = {'Perceptually Uniform Sequential': 1.4, 'Sequential': 0.7,
       'Sequential (2)': 1.4, 'Diverging': 1.4, 'Cyclic': 1.4,
       'Qualitative': 1.4, 'Miscellaneous': 1.4}

# Indices to step through colormap
x = np.linspace(0.0, 1.0, 100)

# Do plot
for cmap_category, cmap_list in cmaps.items():

    # Do subplots so that colormaps have enough space.
    # Default is 6 colormaps per subplot.
    dsub = _DSUBS.get(cmap_category, 6)
    nsubplots = int(np.ceil(len(cmap_list) / dsub))

    # squeeze=False to handle similarly the case of a single subplot
    fig, axes = plt.subplots(nrows=nsubplots, squeeze=False,
                             figsize=(7, 2.6*nsubplots))

    for i, ax in enumerate(axes.flat):

        locs = []  # locations for text labels

        for j, cmap in enumerate(cmap_list[i*dsub:(i+1)*dsub]):

            # Get RGB values for colormap and convert the colormap in
            # CAM02-UCS colorspace.  lab[0, :, 0] is the lightness.
            rgb = cm.get_cmap(cmap)(x)[np.newaxis, :, :3]
            lab = cspace_converter("sRGB1", "CAM02-UCS")(rgb)

            # Plot colormap L values.  Do separately for each category
            # so each plot can be pretty.  To make scatter markers change
            # color along plot:
            # http://stackoverflow.com/questions/8202605/matplotlib-scatterplot
	    # -colour-as-a-function-of-a-third-variable

            if cmap_category == 'Sequential':
                # These colormaps all start at high lightness but we want them
                # reversed to look nice in the plot, so reverse the order.
                y_ = lab[0, ::-1, 0]
                c_ = x[::-1]
            else:
                y_ = lab[0, :, 0]
                c_ = x

            dc = _DC.get(cmap_category, 1.4)  # cmaps horizontal spacing
            ax.scatter(x + j*dc, y_, c=c_, cmap=cmap, s=300, linewidths=0.0)

            # Store locations for colormap labels
            if cmap_category in ('Perceptually Uniform Sequential',
                                 'Sequential'):
                locs.append(x[-1] + j*dc)
            elif cmap_category in ('Diverging', 'Qualitative', 'Cyclic',
                                   'Miscellaneous', 'Sequential (2)'):
                locs.append(x[int(x.size/2.)] + j*dc)

        # Set up the axis limits:
        #   * the 1st subplot is used as a reference for the x-axis limits
        #   * lightness values goes from 0 to 100 (y-axis limits)
        ax.set_xlim(axes[0, 0].get_xlim())
        ax.set_ylim(0.0, 100.0)

        # Set up labels for colormaps
        ax.xaxis.set_ticks_position('top')
        ticker = mpl.ticker.FixedLocator(locs)
        ax.xaxis.set_major_locator(ticker)
        formatter = mpl.ticker.FixedFormatter(cmap_list[i*dsub:(i+1)*dsub])
        ax.xaxis.set_major_formatter(formatter)
        ax.xaxis.set_tick_params(rotation=50)

    ax.set_xlabel(cmap_category + ' colormaps', fontsize=14)
    fig.text(0.0, 0.55, 'Lightness $L^*$', fontsize=12,
             transform=fig.transFigure, rotation=90)

    fig.tight_layout(h_pad=0.0, pad=1.5)
    plt.show()

plt.show()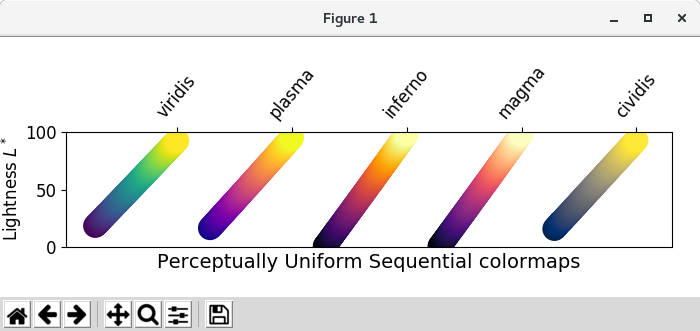


Python 3.11.6 では、下記のような警告があるが、実行できる。
M:\______\Colormaps_Matplotlib_09.py:75: MatplotlibDeprecationWarning:
    The get_cmap function was deprecated in Matplotlib 3.7 and will be removed
    two minor releases later. Use ``matplotlib.colormaps[name]``
    or ``matplotlib.colormaps.get_cmap(obj)`` instead.
  rgb = cm.get_cmap(cmap)(x)[np.newaxis, :, :3]
Python 3.12.0 では、下記のようなエラーがあり、実行できない。
Traceback (most recent call last):
  File "E:\______\Colormaps_Matplotlib_09.py", line 7, in
    from colorspacious import cspace_converter
ModuleNotFoundError: No module named 'colorspacious'
- Grayscale conversion
黒と白のプリンタで印刷できるので、カラープロットのグレースケールへの変換に注意することが重要です。慎重に考慮されないと、読者は判読不能なプロットに終わる可能性があります。なぜなら、グレースケールが予期せずカラーマップを通して変化するからです。
グレースケールへの変換はさまざまな方法で行われます [bw] 。より良いもののいくつかは、ピクセルの rgb 値の線形結合を使用しますが、色の強度をどのように知覚するかに応じて重み付けされます。グレースケールに変換する非線形の方法は、ピクセルの値を使用することです。一般的に、同様の原則が知覚的に自分の情報を提示するのと同じようにこの問題に適用されます。つまり、値が単調に増加するカラーマップが選択された場合、グレースケールに合理的な方法で印刷されます。
これを念頭において、Sequential カラーマップはグレースケールで合理的な表現をしていることがわかります。いくつかの(秋、春、夏、冬>)グレースケールの変化はほとんどありませんが、Sequential2 カラーマップのいくつかは十分なグレースケール表現を持っています。このようなカラーマップがプロットで使用され、プロットがグレースケールに印刷された場合、多くの情報が同じグレー値にマッピングされる可能性があります。 Diverging カラーマップは、ほとんどが外側のエッジの濃いグレーから真ん中の白まで変化します。一部(PuOrと地震)は、片側が他の部分よりも著しく濃い灰色をしているため、あまり対称ではありません。 coolwarmはグレースケールの範囲がほとんどなく、より詳細な情報を失うより均一なプロットに印刷されます。オーバーレイされたラベル付き輪郭は、プロットがグレースケールに印刷された後にカラーを使用することができないため、カラーマップの一方の側と他方の側を区別するのに役立つことに注意してください。 Accent、hsv、jet などの定性的およびその他のカラーマップの多くは、カラーマップ全体で暗い色から明るい色に変化し、暗いグレー色に変化します。これは、一旦それがグレースケールで印刷されると、見る者がプロット内の情報を解釈することを不可能にする。
# sphinx_gallery_thumbnail_number = 2

import numpy as np
import matplotlib as mpl
import matplotlib.pyplot as plt
from matplotlib import cm
from colorspacious import cspace_converter
from collections import OrderedDict

cmaps = OrderedDict()

cmaps['Perceptually Uniform Sequential'] = [
            'viridis', 'plasma', 'inferno', 'magma', 'cividis']

cmaps['Sequential'] = [
            'Greys', 'Purples', 'Blues', 'Greens', 'Oranges', 'Reds',
            'YlOrBr', 'YlOrRd', 'OrRd', 'PuRd', 'RdPu', 'BuPu',
            'GnBu', 'PuBu', 'YlGnBu', 'PuBuGn', 'BuGn', 'YlGn']

cmaps['Sequential (2)'] = [
            'binary', 'gist_yarg', 'gist_gray', 'gray', 'bone', 'pink',
            'spring', 'summer', 'autumn', 'winter', 'cool', 'Wistia',
            'hot', 'afmhot', 'gist_heat', 'copper']

cmaps['Diverging'] = [
            'PiYG', 'PRGn', 'BrBG', 'PuOr', 'RdGy', 'RdBu',
            'RdYlBu', 'RdYlGn', 'Spectral', 'coolwarm', 'bwr', 'seismic']

cmaps['Cyclic'] = ['twilight', 'twilight_shifted', 'hsv']

cmaps['Qualitative'] = ['Pastel1', 'Pastel2', 'Paired', 'Accent',
                        'Dark2', 'Set1', 'Set2', 'Set3',
                        'tab10', 'tab20', 'tab20b', 'tab20c']

cmaps['Miscellaneous'] = [
            'flag', 'prism', 'ocean', 'gist_earth', 'terrain', 'gist_stern',
            'gnuplot', 'gnuplot2', 'CMRmap', 'cubehelix', 'brg',
            'gist_rainbow', 'rainbow', 'jet', 'nipy_spectral', 'gist_ncar']

mpl.rcParams.update({'font.size': 12})

# Number of colormap per subplot for particular cmap categories
_DSUBS = {'Perceptually Uniform Sequential': 5, 'Sequential': 6,
          'Sequential (2)': 6, 'Diverging': 6, 'Cyclic': 3,
          'Qualitative': 4, 'Miscellaneous': 6}

# Spacing between the colormaps of a subplot
_DC = {'Perceptually Uniform Sequential': 1.4, 'Sequential': 0.7,
       'Sequential (2)': 1.4, 'Diverging': 1.4, 'Cyclic': 1.4,
       'Qualitative': 1.4, 'Miscellaneous': 1.4}

# Indices to step through colormap
x = np.linspace(0.0, 1.0, 100)

# Do plot
for cmap_category, cmap_list in cmaps.items():

    # Do subplots so that colormaps have enough space.
    # Default is 6 colormaps per subplot.
    dsub = _DSUBS.get(cmap_category, 6)
    nsubplots = int(np.ceil(len(cmap_list) / dsub))

    # squeeze=False to handle similarly the case of a single subplot
    fig, axes = plt.subplots(nrows=nsubplots, squeeze=False,
                             figsize=(7, 2.6*nsubplots))

    for i, ax in enumerate(axes.flat):

        locs = []  # locations for text labels

        for j, cmap in enumerate(cmap_list[i*dsub:(i+1)*dsub]):

            # Get RGB values for colormap and convert the colormap in
            # CAM02-UCS colorspace.  lab[0, :, 0] is the lightness.
            rgb = cm.get_cmap(cmap)(x)[np.newaxis, :, :3]
            lab = cspace_converter("sRGB1", "CAM02-UCS")(rgb)

            # Plot colormap L values.  Do separately for each category
            # so each plot can be pretty.  To make scatter markers change
            # color along plot:
            # http://stackoverflow.com/questions/8202605/matplotlib-scatterplot-colour-as-a-function-of-a-third-variable

            if cmap_category == 'Sequential':
                # These colormaps all start at high lightness but we want them
                # reversed to look nice in the plot, so reverse the order.
                y_ = lab[0, ::-1, 0]
                c_ = x[::-1]
            else:
                y_ = lab[0, :, 0]
                c_ = x

            dc = _DC.get(cmap_category, 1.4)  # cmaps horizontal spacing
            ax.scatter(x + j*dc, y_, c=c_, cmap=cmap, s=300, linewidths=0.0)

            # Store locations for colormap labels
            if cmap_category in ('Perceptually Uniform Sequential',
                                 'Sequential'):
                locs.append(x[-1] + j*dc)
            elif cmap_category in ('Diverging', 'Qualitative', 'Cyclic',
                                   'Miscellaneous', 'Sequential (2)'):
                locs.append(x[int(x.size/2.)] + j*dc)

        # Set up the axis limits:
        #   * the 1st subplot is used as a reference for the x-axis limits
        #   * lightness values goes from 0 to 100 (y-axis limits)
        ax.set_xlim(axes[0, 0].get_xlim())
        ax.set_ylim(0.0, 100.0)

        # Set up labels for colormaps
        ax.xaxis.set_ticks_position('top')
        ticker = mpl.ticker.FixedLocator(locs)
        ax.xaxis.set_major_locator(ticker)
        formatter = mpl.ticker.FixedFormatter(cmap_list[i*dsub:(i+1)*dsub])
        ax.xaxis.set_major_formatter(formatter)
        ax.xaxis.set_tick_params(rotation=50)

    ax.set_xlabel(cmap_category + ' colormaps', fontsize=14)
    fig.text(0.0, 0.55, 'Lightness $L^*$', fontsize=12,
             transform=fig.transFigure, rotation=90)

    fig.tight_layout(h_pad=0.0, pad=1.5)
    plt.show()

plt.show()

Python 3.11.6 では、下記のような警告があるが、実行できる。
M:\______\Colormaps_Matplotlib_10.py:58: MatplotlibDeprecationWarning:
    The get_cmap function was deprecated in Matplotlib 3.7 and will be removed
    two minor releases later. Use ``matplotlib.colormaps[name]``
    or ``matplotlib.colormaps.get_cmap(obj)`` instead.
  rgb = cm.get_cmap(plt.get_cmap(name))(x)[np.newaxis, :, :3]
Python 3.12.0 では、下記のようなエラーがあり、実行できない。
Traceback (most recent call last):
  File "E:\____\Colormaps_Matplotlib_10.py", line 7, in
    from colorspacious import cspace_converter
ModuleNotFoundError: No module named 'colorspacious'
- 参照ページ
Colormaps in Matplotlib
- リリースノート
- 2023/11/05 Ver=1.04 Python 3.12.0 で確認
- 2023/11/05 Ver=1.04 Python 3.11.6 で確認
- 2023/03/11 Ver=1.03 Python 3.11.2 で確認
- 2020/10/28 Ver=1.01 Python 3.7.8 で確認
- 2018/11/08 Ver=1.01 初版リリース
- 関連ページ