|
|
matplotlib Overview of axisartist toolkit. |
H.Kamifuji . |
- 目 次
- Overview of axisartist toolkit
axisartist ツールキットチュートリアル。
警告
axisartist には、曲線のグリッド(天文学の世界座標系など)をサポートするためのカスタム Axes クラスが含まれています。 axisartist は、Axes.xaxis と Axes.yaxis を使ってダニ、ティックラインなどを描画する mpl の元の Axes クラスとは異なり、湾曲座標系のティックやティックラインなどを処理できる特別なアーティスト( AxisArtist )を使用します。
axisartist はカスタム Axes クラス( mpl の元の Axes クラスから派生)を使用します。 副作用として、いくつかのコマンド(主にティック関連)は動作しません。

Demo Floating Axis
- axisartist
axisartist モジュールは、軸(左、右、上、下)に軸線、ティック、ティッカーラベル、およびラベルを描画する独立した関連アーティストを持つ、カスタムの(そして実験的な) Axes クラスを提供します。 軸座標の固定位置、またはデータ座標の固定位置を通過できる独自の軸を作成することもできます(つまり、視点制限が変更されたときに軸が浮動する)。
Axes クラスは、デフォルトで xaxis と yaxis が不可視で、 "left"、 "right"、 "bottom"、 "top" の 4 軸スパインを描画する 4 人のアーティストが追加されています。 ax.axis["left"] 、ax.axis["right"] などとしてアクセスされます。つまり、ax.axisは アーティストを含む辞書です(ax.axis は依然として呼び出し可能なメソッドであり、 Matplotlib の元の Axes.axis メソッドとして動作します)。
軸を作成するには、
import mpl_toolkits.axisartist as AA
fig = plt.figure(1)
ax = AA.Axes(fig, [0.1, 0.1, 0.8, 0.8])
fig.add_axes(ax)
またはサブプロットを作成する
ax = AA.Subplot(fig, 111)
fig.add_subplot(ax)
たとえば、次のようにして右と上の棘を隠すことができます。
ax.axis["right"].set_visible(False)
ax.axis["top"].set_visible(False)
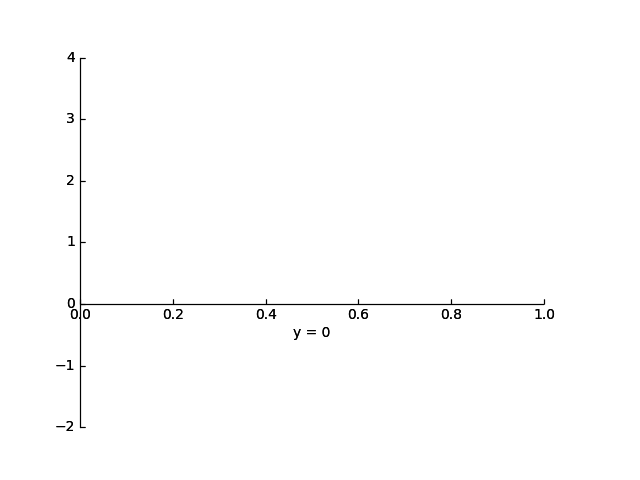
Simple Axisline3
ax.axis["y=0"] = ax.new_floating_axis(nth_coord=0, value=0)
Simple Axisartist1
# make new (right-side) yaxis, but with some offset
ax.axis["right2"] = ax.new_fixed_axis(loc="right",
              offset=(20, 0))
- axisartist with ParasiteAxes
axes_grid1 ツールキットのほとんどのコマンドは、axes_class キーワード引数を取り、コマンドは指定されたクラスの軸を作成します。 たとえば、axisartist.Axes を使用してホストサブプロットを作成するには、
import mpl_toolkits.axisartist as AA
from mpl_toolkits.axes_grid1 import host_subplot

host = host_subplot(111, axes_class=AA.Axes)
ParasiteAxes を使用する例を次に示します。
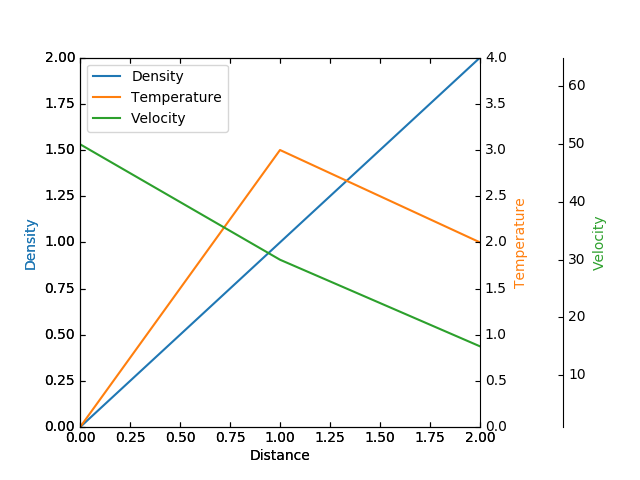
Demo Parasite Axes2
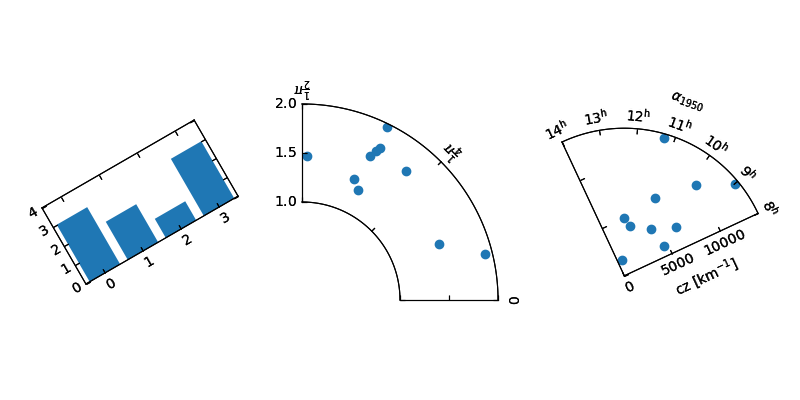
- Curvilinear Grid
AxisArtist モジュールの背後にある動機は、曲線のグリッドとダニをサポートすることです。
Demo Parasite Axes2
- Floating Axes
AxisArtist は、外軸が浮動軸として定義されている浮動軸もサポートしています。
Demo Floating Axes
- axisartist namespace
axisartist 名前空間には派生した Axes 実装が含まれています。 最大の違いは、軸線、ティック、ティックラベル、軸ラベルを描く責任があるアーティストは、元の mpl のアーティストよりもはるかに多い mpl の Axis クラスから切り離されていることです。 この変化は、曲線グリッドをサポートすることに強く意欲的でした。 mpl_tootlkits.axisartist.Axes が mpl の元の Axes と異なる点がいくつかあります。
- 軸要素(軸線(スパイン)、ティック、目盛ラベル、および軸ラベル)は、AxisArtist インスタンスによって描画されます。 Axisとは異なり、左、右、上、下の軸は別々のアーティストによって描画されます。 また、それぞれに異なるティックの位置と異なるティックのラベルが付いている場合があります。
- グリッド線は、Gridlines インスタンスによって描画されます。 その変化は、曲線の座標では、グリッド線が軸線を横切ることができない(すなわち、関連するダニがない)ことを動機付けた。 元のAxesクラスでは、グリッド線はダニに関連付けられています。
- 必要に応じてティックラインを回転させることができます(グリッドラインに沿って)
- 曲線グリッド。
- 浮動軸
Demo Floating Axis
xaxis および yaxis 属性は引き続き使用できますが、表示されないように設定されています。別のアーティストがレンダリング軸として使用されるので、mpl の軸関連のメソッドは何の効果もありません。 AxisArtist インスタンスに加えて、mpl_toolkits.axisartist.Axes には、グリッド線属性を持つグリッド線(グリッド線)が表示されます。
AxisArtistとGridlines の両方で、ティックとグリッド位置の計算は、GridHelper クラスのインスタンスに委譲されます。 mpl_toolkits.axisartist.Axes クラスは GridHelperRectlinear をグリッドヘルパーとして使用します。 GridHelperRectlinear クラスは、mpl の元の Axes の x 軸と y 軸を包むラッパーで、mpl の元の軸がどのように動作するかを操作するためのものです。たとえば、set_ticks メソッドなどを使って目盛りの位置を変更すると、期待どおりに動作するはずです。しかし、頻繁に変化する属性(色など)が尊重されるようにいくつかの努力がなされているが、アーティスト特性(例えば、色)の変化は一般的には機能しない。
- AxisArtist
AxisArtist は、ダニ、ラベルなどを描画する次の属性を持つコンテナアーティストとして考えることができます。
- line
- major_ticks, major_ticklabels
- minor_ticks, minor_ticklabels
- offsetText
- label
- line
- Line2dクラスから派生したものです。 脊髄(?)線を描く責任があります。
- major_ticks, minor_ticks
- Line2d クラスから派生したものです。 ダニはマーカーであることに注意してください。
- major_ticklabels, minor_ticklabels
- テキストから派生。 それはテキストアーティストのリストではなく、単一のアーティスト(コレクションに似ています)であることに注意してください。
- axislabel
- テキストから派生
- Default AxisArtists
既定では、軸のアーティストの次のものが定義されています。
ax.axis["left"], ax.axis["bottom"], ax.axis["right"], ax.axis["top"]
上軸と右軸の目盛りと軸ラベルは表示されないように設定されています。
たとえば、下のx軸のmajor_ticklabelsの色属性を変更する場合は、
ax.axis["bottom"].major_ticklabels.set_color("b")同様に、ティックラベルを見えなくするには
ax.axis["bottom"].major_ticklabels.set_visible(False)
AxisAritst は、ティック、ティッカーラベル、およびラベルの可視性を制御するヘルパーメソッドを提供します。 ティッカーラベルを見えないようにするには、
ax.axis["bottom"].toggle(ticklabels=False)
ティック、ティックラベル、(軸)ラベルをすべて非表示にするには
ax.axis["bottom"].toggle(all=False)
すべてオフにするが、オンにする
ax.axis["bottom"].toggle(all=False, ticks=True)
すべてのオン(軸)ラベルをオフにするには
ax.axis["bottom"].toggle(all=True, label=False))
ax.axis の __getitem__ メソッドは、複数の軸名を取ります。 たとえば、「上」軸と「右」軸のティックラベルをオンにするには、
ax.axis["top","right"].toggle(ticklabels=True))
'ax.axis["top"、 "right"]' は、上記のコードを以下のように変換する単純なプロキシオブジェクトを返します。
for n in ["top","right"]:
  ax.axis[n].toggle(ticklabels=True))
したがって、for ループ内の戻り値はすべて無視されます。 そして、あなたはそれを単純な方法以上に使うべきではありません。
リストのインデックス付けと同様に、「:」はすべてのアイテム、すなわち、
ax.axis[:].major_ticks.set_color("r")すべての軸でティックカラーを変更します。
- HowTo
- 1.ティックの位置とラベルを変更する。
オリジナルのmplの軸と同じです。
x.set_xticks([1,2,3])
- 2.色などの軸プロパティを変更する
適切なアーティストのプロパティを変更します。 たとえば、ティックラベルの色を変更するには:
ax.axis["left"].major_ticklabels.set_color("r") - 3.複数の軸の属性を変更するには:
ax.axis["left","bottom"].major_ticklabels.set_color("r")またはすべての軸の属性を変更する:
ax.axis[:].major_ticklabels.set_color("r") - 4.ティックサイズ(長さ)を変更するには、
axis.major_ticks.set_ticksize メソッド。 ティックの方向を変更するには(ティックはデフォルトでティックラベルの反対方向にあります)、axis.major_ticks.set_tick_out メソッドを使用してください。
パッドをティックとティックラベルの間で変更するには、axis.major_ticklabels.set_pad メソッドを使用します。
パッドをティックラベルと軸ラベルの間で変更するには、axis.label.set_padメソッドを使用します。
- 1.ティックの位置とラベルを変更する。
- Rotation and Alignment of TickLabels
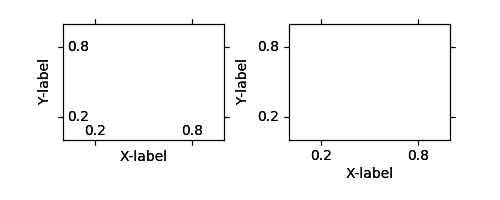
これも元の mpl とはかなり異なり、混乱する可能性があります。 ティック・ラベルを回転させたいときは、まず "set_axis_direction" メソッドの使用を検討してください。
ax1.axis["left"].major_ticklabels.set_axis_direction("top")
ax1.axis["right"].label.set_axis_direction("left")
Simple Axis Direction01
基本的な方向性の概念を理解している必要があります。
- 1. 座標が増加する軸線の方向として定義される基準方向がある。 例えば、左のx軸の基準方向は、下から上への方向である。
Axis Direction Demo - Step 01
- 2. ticklabel_direction は、基準方向の右側(+)または左側( - )のいずれかです。
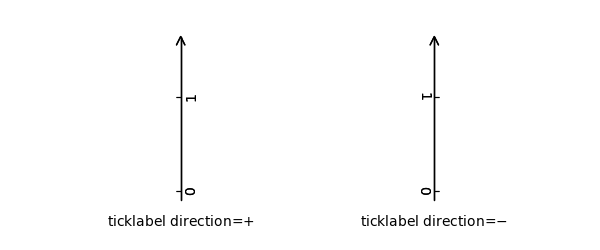
Axis Direction Demo - Step 02 - 3. label_direction の場合と同じ
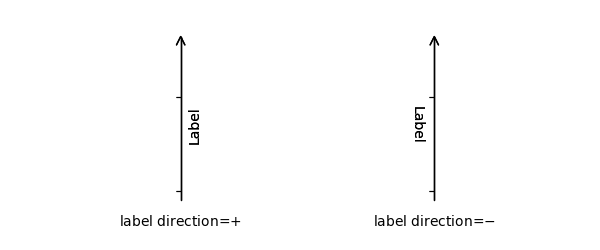
Axis Direction Demo - Step 03 - 4. チックは、デフォルトでティックラベルの反対方向に描かれます。
- 5. ティックラベルとラベルのテキストの回転は、それぞれ ticklabel_direction または label_direction を参照して決定されます。 ティックラベルとラベルの回転は固定されています。
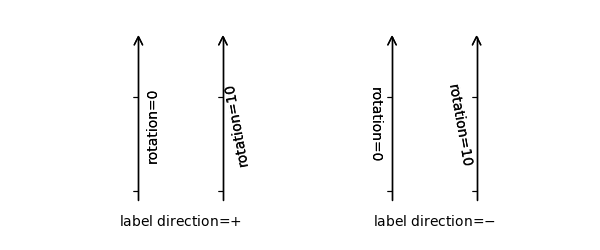
Axis Direction Demo - Step 04
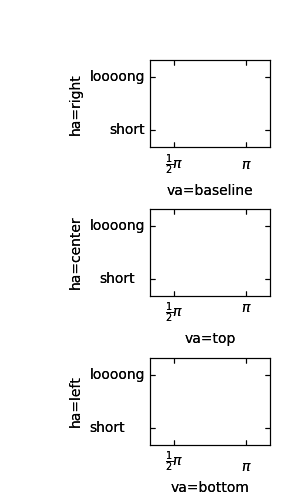
Option Meaning ? ? left bottom right top axislabel direction '-' '+' '+' '-' axislabel rotation 180 0 0 180 axislabel va center top center bottom axislabel ha right center right center ticklabel direction '-' '+' '+' '-' ticklabels rotation 90 0 -90 180 ticklabel ha right center right center ticklabel va center baseline center baseline
また、 'set_axis_direction("top")' は、テキストの回転などを調整して、 "top" 軸に適した設定を行うことを意味します。 軸方向の概念は、曲がった軸でより明確になります。

Demo Axis Direction
ax1.axis["left"].set_axis_direction("top")関連するすべてのアーティストの axis_direction を "left" 軸で変更し、
ax1.axis["left"].major_ticklabels.set_axis_direction("top")major_ticklabels だけの axis_direction を変更します。 AxisArtist レベルの set_axis_directionはticklabel_directionとlabel_direction を変更しますが、tick、ticklabels、axis-labelのaxis_direction を変更しても影響はありません。
軸の内側にティックを外側にしたい場合は、invert_ticklabel_direction メソッドを使用してください。
ax.axis[:].invert_ticklabel_direction()
関連するメソッドは "set_tick_out" です。 それは外側に目盛りをつけます(実際には、デフォルト方向の反対方向に目盛りをつけます)。
ax.axis[:].major_ticks.set_tick_out(True)
Demo Axis Direction03
- AxisArtist's methods
- set_axis_direction : "left", "right", "bottom", or "top"
- set_ticklabel_direction : "+" or "-"
- set_axislabel_direction : "+" or "-"
- invert_ticklabel_direction
- Ticks' methods (major_ticks and minor_ticks)
- set_tick_out : True or False
- set_ticksize : size in points
- TickLabels' methods (major_ticklabels and minor_ticklabels)
- set_axis_direction : "left", "right", "bottom", or "top"
- set_rotation : angle with respect to the reference direction
- set_ha and set_va : see below
- AxisLabels' methods (label)
- set_axis_direction : "left", "right", "bottom", or "top"
- set_rotation : angle with respect to the reference direction
- set_ha and set_va
- 1. 座標が増加する軸線の方向として定義される基準方向がある。 例えば、左のx軸の基準方向は、下から上への方向である。
- Adjusting ticklabels alignment
ティックとティックラベルの間でパッドを変更するには
Demo Ticklabel Alignment
- Adjusting pad
ティックとティックラベルの間でパッドを変更するには
ax.axis["left"].major_ticklabels.set_pad(10)
またはティックラベルと軸ラベル
ax.axis["left"].label.set_pad(10)
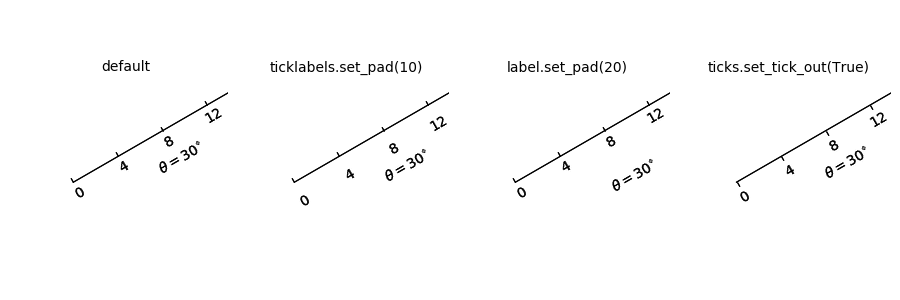
Simple Axis Pad
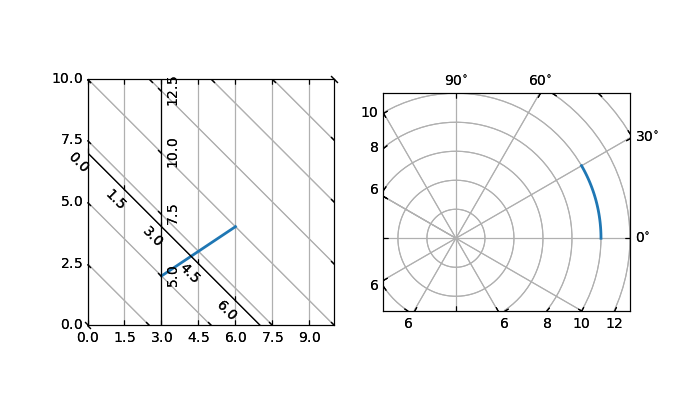
- GridHelper
実際に曲線座標を定義するには、独自のグリッドヘルパーを使用する必要があります。 グリッドヘルパークラスの一般化されたバージョンが提供され、このクラスではほとんどの場合十分です。 ユーザは、曲線座標から(直線)画像座標への変換(およびその逆対)を定義する 2 つの関数を提供することができる。 ティックとグリッドは曲線座標のために描画されますが、軸自体( ax.transData )のデータ変換はまだ直線(画像)座標です。
from mpl_toolkits.axisartist.grid_helper_curvelinear \
     import GridHelperCurveLinear
from mpl_toolkits.axisartist import Subplot

# from curved coordinate to rectlinear coordinate.
def tr(x, y):
    x, y = np.asarray(x), np.asarray(y)
    return x, y-x

# from rectlinear coordinate to curved coordinate.
def inv_tr(x,y):
    x, y = np.asarray(x), np.asarray(y)
    return x, y+x

grid_helper = GridHelperCurveLinear((tr, inv_tr))

ax1 = Subplot(fig, 1, 1, 1, grid_helper=grid_helper)

fig.add_subplot(ax1)
代わりに matplotlibのTransform インスタンスを使用することもできます(逆変換を定義する必要があります)。 しばしば、湾曲した座標系の座標範囲は限られた範囲を有するか、または周期を有することがある。 そのような場合、グリッドヘルパーのよりカスタマイズされたバージョンが必要です。
import mpl_toolkits.axisartist.angle_helper as angle_helper

# PolarAxes.PolarTransform takes radian. However, we want our coordinate
# system in degree
tr = Affine2D().scale(np.pi/180., 1.) + PolarAxes.PolarTransform()

# extreme finder :  find a range of coordinate.
# 20, 20 : number of sampling points along x, y direction
# The first coordinate (longitude, but theta in polar)
#   has a cycle of 360 degree.
# The second coordinate (latitude, but radius in polar)  has a minimum of 0
extreme_finder = angle_helper.ExtremeFinderCycle(20, 20,
                                                 lon_cycle = 360,
                                                 lat_cycle = None,
                                                 lon_minmax = None,
                                                 lat_minmax = (0, np.inf),
                                                 )

# Find a grid values appropriate for the coordinate (degree,
# minute, second). The argument is a approximate number of grids.
grid_locator1 = angle_helper.LocatorDMS(12)

# And also uses an appropriate formatter.  Note that,the
# acceptable Locator and Formatter class is a bit different than
# that of mpl's, and you cannot directly use mpl's Locator and
# Formatter here (but may be possible in the future).
tick_formatter1 = angle_helper.FormatterDMS()

grid_helper = GridHelperCurveLinear(tr,
                                    extreme_finder=extreme_finder,
                                    grid_locator1=grid_locator1,
                                    tick_formatter1=tick_formatter1
                                    )
ここでも、軸の transDataは 依然として直線座標(画像座標)です。 2つの座標の間で手動で変換を行うこともできますし、便宜上 Parasite Axes を使用することもできます。
ax1 = SubplotHost(fig, 1, 2, 2, grid_helper=grid_helper)

# A parasite axes with given transform
ax2 = ParasiteAxesAuxTrans(ax1, tr, "equal")
# note that ax2.transData == tr + ax1.transData
# Anthing you draw in ax2 will match the ticks and grids of ax1.
ax1.parasites.append(ax2)

Demo Curvelinear Grid
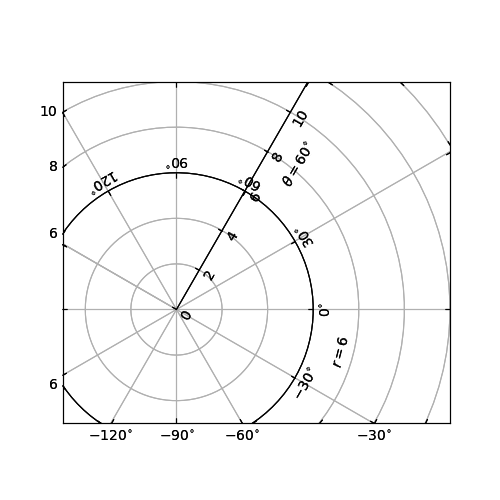
- FloatingAxis
浮動軸は、データ座標が固定されている軸であり、その位置は軸座標で固定されていないが、軸データの変更によって変化する。 浮動軸は、 new_floating_axis メソッドを使用して作成できます。 しかし、AxisArtistがAxes に正しく追加されることは、あなたの責任です。 Axes の軸属性の項目として追加することをお勧めします。
# floating axis whose first (index starts from 0) coordinate
# (theta) is fixed at 60

ax1.axis["lat"] = axis = ax1.new_floating_axis(0, 60)
axis.label.set_text(r"$\theta = 60^{\circ}$")
axis.label.set_visible(True)
このページの最初の例を参照してください。
- Current Limitations and TODO's
コードはより洗練されたものが必要です。 ここには不完全な問題のリストとTODOの
- カスタマイズされたティック位置(曲線グリッドの場合)をサポートする簡単な方法はありません。 新しい Locator クラスを作成する必要があります。
- FloatingAxis は x = 0 の浮動軸などの座標制限を持つことができますが、y は 0 から1までしかありません。
- FloatingAxisのaxislabel の位置は、オプションで座標値として指定する必要があります。 ex、x = 0 の浮動軸、y = 1 のラベル
- 参照ページ
Overview of axisartist toolkit
- リリースノート
- 2023/03/11 Ver=1.03 Python 3.11.2 で確認
- 2020/10/28 Ver=1.01 Python 3.7.8 で確認
- 2018/11/08 Ver=1.01 初版リリース
- 関連ページ