|
|
matplotlib Colormap Normalization. |
H.Kamifuji . |
- 目 次
- Colormap Normalization
デフォルトでカラーマップを使用するオブジェクトは、カラーマップの色をデータ値vminからvmaxに直線的にマッピングします。 例えば:
pcm = ax.pcolormesh(x, y, Z, vmin=-1., vmax=1., cmap='RdBu_r')
Z のデータを-1から+1まで線形にマップするので、Z = 0 はカラーマップ RdBu_r (この場合は白)の中央に色を与えます。
Matplotlib はこのマッピングを2段階で行います。[0,1] からの正規化が最初に行われ、次にカラーマップのインデックスにマッピングされます。 正規化は matplotlib.colors() モジュールで定義されたクラスです。 デフォルトの線形正規化は matplotlib.colors.Normalize() です。
データをカラーにマッピングするアーティストは、引数 vminとvmax を渡して matplotlib.colors.Normalize() インスタンスを作成し、それを呼び出します。
In [1]: import matplotlib as mpl

In [2]: norm = mpl.colors.Normalize(vmin=-1.,vmax=1.)

In [3]: norm(0.)
Out[3]: 0.5
ただし、データを非線形の方法でカラーマップにマップすると便利な場合があります。
- Logarithmic
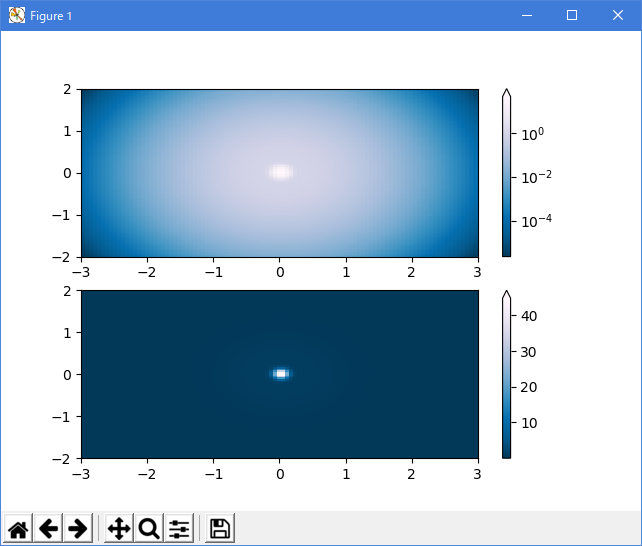
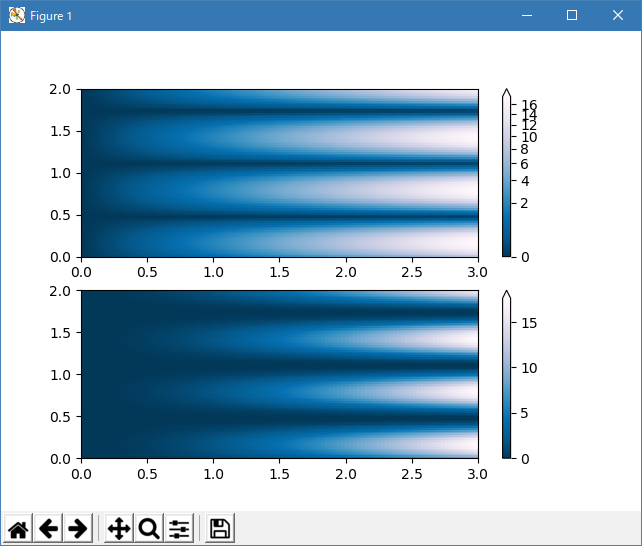
最も一般的な変換の 1 つは、対数をとってデータをプロットすることです( base10 へ)。 この変換は、異なるスケール間で変更を表示するのに便利です。 colors.LogNorm() を使用してデータを正規化します。 下の例では、2 つのバンプがあり、1 つはもう 1 つのバンプよりはるかに小さくなっています。 colors.LogNorm() を使用すると、各バンプの形状と位置がはっきりと分かります。
import numpy as np
import matplotlib.pyplot as plt
import matplotlib.colors as colors

N = 100
X, Y = np.mgrid[-3:3:complex(0, N), -2:2:complex(0, N)]

# A low hump with a spike coming out of the top right.  Needs to have
# z/colour axis on a log scale so we see both hump and spike.  linear
# scale only shows the spike.
Z1 = np.exp(-(X)**2 - (Y)**2)
Z2 = np.exp(-(X * 10)**2 - (Y * 10)**2)
Z = Z1 + 50 * Z2

fig, ax = plt.subplots(2, 1)

pcm = ax[0].pcolor(X, Y, Z,
                   norm=colors.LogNorm(vmin=Z.min(), vmax=Z.max()),
                   cmap='PuBu_r')
fig.colorbar(pcm, ax=ax[0], extend='max')

pcm = ax[1].pcolor(X, Y, Z, cmap='PuBu_r')
fig.colorbar(pcm, ax=ax[1], extend='max')
fig.show()

plt.show()
- Symmetric logarithmic
同様に、正と負のデータが存在することもありますが、両者に対数スケーリングが適用されることがあります。 この場合、負の数も対数的にスケーリングされ、より小さい数にマッピングされます。 例えば vmin = -vmax の場合、負の数は0から 0.5 まで、正は 0.5 から1にマッピングされる。
ゼロに近い値の対数は無限に近づく傾向があるため、ゼロ付近の小さな範囲を線形にマッピングする必要があります。 パラメータ linthresh を使用すると、この範囲のサイズを指定できます( -linthresh、linthresh )。 カラーマップ内のこの範囲のサイズは、linscale によって設>定されます。 linscale == 1.0(デフォルト)の場合、線形範囲の正および負の半分に使用されるスペースは、対数範囲で 1 ディケードになります。
import numpy as np
import matplotlib.pyplot as plt
import matplotlib.colors as colors

N = 100
X, Y = np.mgrid[-3:3:complex(0, N), -2:2:complex(0, N)]
Z1 = np.exp(-X**2 - Y**2)
Z2 = np.exp(-(X - 1)**2 - (Y - 1)**2)
Z = (Z1 - Z2) * 2

fig, ax = plt.subplots(2, 1)

pcm = ax[0].pcolormesh(X, Y, Z,
                       norm=colors.SymLogNorm(linthresh=0.03, linscale=0.03,
                                              vmin=-1.0, vmax=1.0),
                       cmap='RdBu_r')
fig.colorbar(pcm, ax=ax[0], extend='both')

pcm = ax[1].pcolormesh(X, Y, Z, cmap='RdBu_r', vmin=-np.max(Z))
fig.colorbar(pcm, ax=ax[1], extend='both')
fig.show()

plt.show()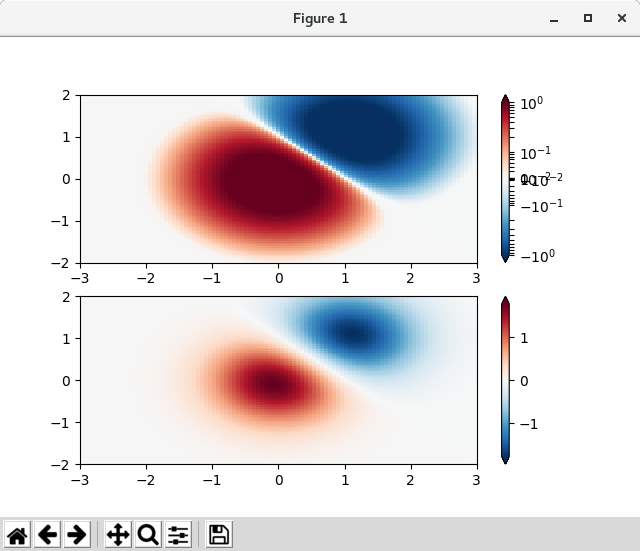
- Power-law
時には、色をべき乗則の関係( i.e. y = xr すなわち、どこの累乗であるか)に再マッピングすることが有用な場合もある。 このために、colors.PowerNorm() を使用します。 それは引数として gamma をとります( gamma == 1.0 はデフォルトの線形正規化になります):
注意
おそらく、このタイプの変換を使用してデータをプロットする正当な理由があるはずです。 技術的視聴者は、線形および対数軸およびデータ変換に使用されます。 法律はあまり一般的ではなく、視聴者はそれらが使用されたことを明示的に知らされるべきです。import numpy as np import matplotlib.pyplot as plt import matplotlib.colors as colors N = 100 X, Y = np.mgrid[0:3:complex(0, N), 0:2:complex(0, N)] Z1 = (1 + np.sin(Y * 10.)) * X**(2.) fig, ax = plt.subplots(2, 1) pcm = ax[0].pcolormesh(X, Y, Z1, norm=colors.PowerNorm(gamma=0.5), cmap='PuBu_r') fig.colorbar(pcm, ax=ax[0], extend='max') pcm = ax[1].pcolormesh(X, Y, Z1, cmap='PuBu_r') fig.colorbar(pcm, ax=ax[1], extend='max') fig.show() plt.show()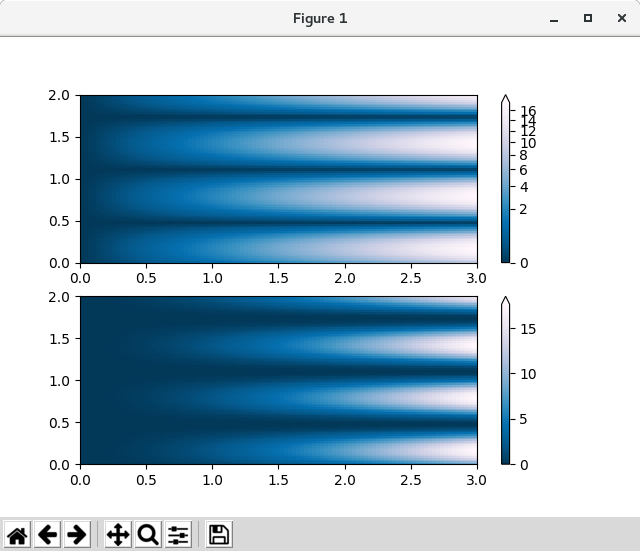
- Discrete bounds
matplolib に付属するもう一つの標準化は colors.BoundaryNorm() です。 vminとvmax に加えて、これは、データがマップされる境界を引数として取ります。 色は、これらの "bounds" の間で線形に分布します。 例えば:
In [4]: import matplotlib.colors as colors

In [5]: bounds = np.array([-0.25, -0.125, 0, 0.5, 1])

In [6]: norm = colors.BoundaryNorm(boundaries=bounds, ncolors=4)

In [7]: print(norm([-0.2,-0.15,-0.02, 0.3, 0.8, 0.99]))
[0 0 1 2 3 3]
他のノルムとは異なり、このノルムは 0 から ncolors-1 までの値を返します。
import numpy as np
import matplotlib.pyplot as plt
import matplotlib.colors as colors

N = 100
X, Y = np.mgrid[-3:3:complex(0, N), -2:2:complex(0, N)]
Z1 = np.exp(-X**2 - Y**2)
Z2 = np.exp(-(X - 1)**2 - (Y - 1)**2)
Z = (Z1 - Z2) * 2

fig, ax = plt.subplots(3, 1, figsize=(8, 8))
ax = ax.flatten()
# even bounds gives a contour-like effect
bounds = np.linspace(-1, 1, 10)
norm = colors.BoundaryNorm(boundaries=bounds, ncolors=256)
pcm = ax[0].pcolormesh(X, Y, Z,
                       norm=norm,
                       cmap='RdBu_r')
fig.colorbar(pcm, ax=ax[0], extend='both', orientation='vertical')

# uneven bounds changes the colormapping:
bounds = np.array([-0.25, -0.125, 0, 0.5, 1])
norm = colors.BoundaryNorm(boundaries=bounds, ncolors=256)
pcm = ax[1].pcolormesh(X, Y, Z, norm=norm, cmap='RdBu_r')
fig.colorbar(pcm, ax=ax[1], extend='both', orientation='vertical')

pcm = ax[2].pcolormesh(X, Y, Z, cmap='RdBu_r', vmin=-np.max(Z))
fig.colorbar(pcm, ax=ax[2], extend='both', orientation='vertical')
fig.show()

plt.show()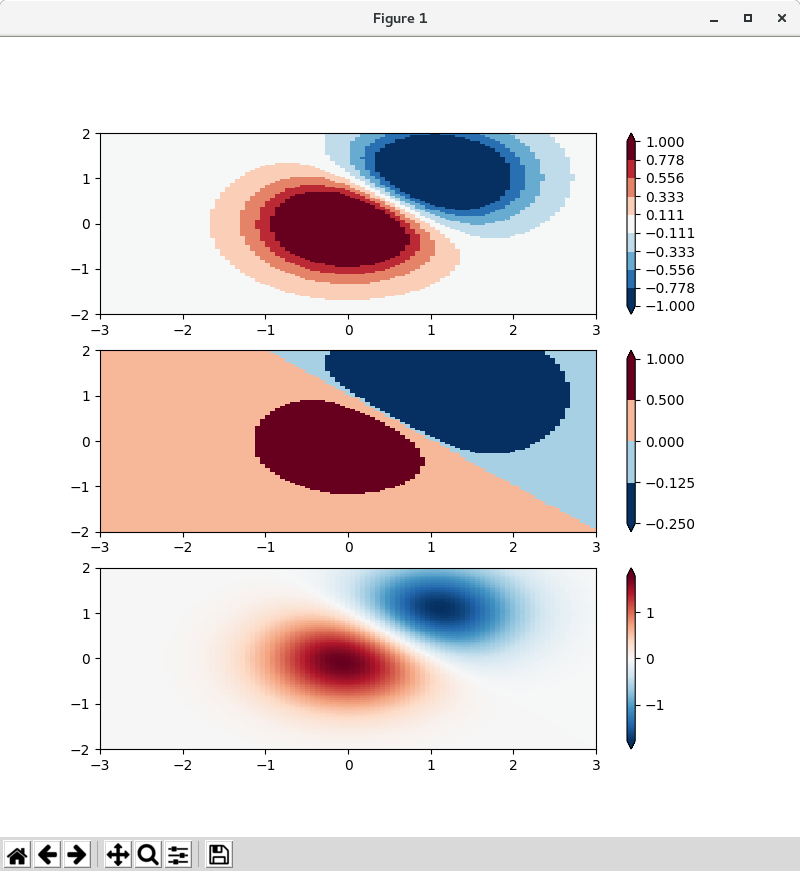

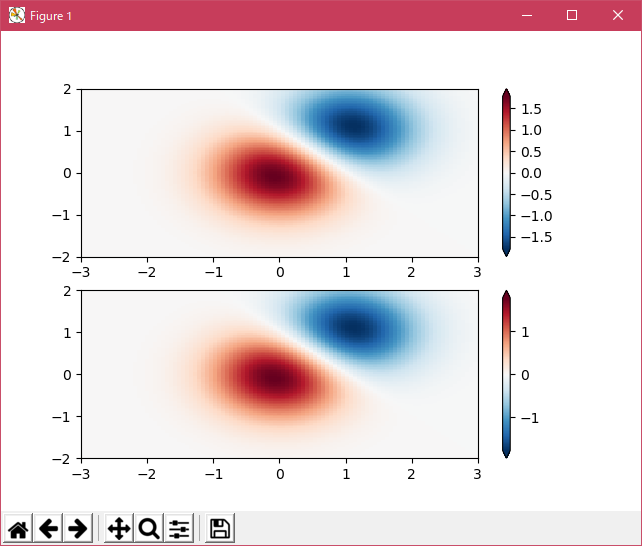
- Custom normalization: Two linear ranges
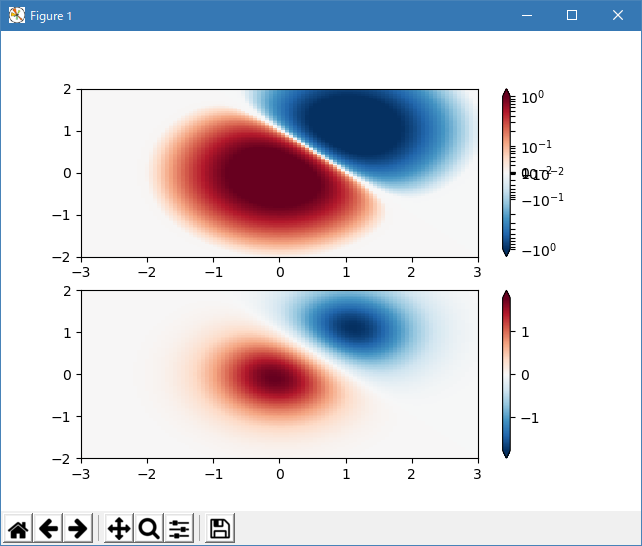
独自の正規化を定義することは可能です。 次の例では、色を変更します:SymLogNorm() は、負のデータ値と正の値に対して異なる線形マップを使用します。 (この例は単純であり、マスクされたデータなどの複雑なケースの入力や説明を検証しないことに注意してください)
注意
これはすぐに colors.OffsetNorm() として表示されることがあります。
上記のように、データの色への非対称マッピングは、定量データの非標準的なプラクティスであり、推奨される場合にのみ使用してください。 実用的な例は、 ocean/land のカラーマップがあり、陸と海のデータが異なる範囲にわたっています。import numpy as np import matplotlib.pyplot as plt import matplotlib.colors as colors N = 100 X, Y = np.mgrid[-3:3:complex(0, N), -2:2:complex(0, N)] Z1 = np.exp(-X**2 - Y**2) Z2 = np.exp(-(X - 1)**2 - (Y - 1)**2) Z = (Z1 - Z2) * 2 class MidpointNormalize(colors.Normalize): def __init__(self, vmin=None, vmax=None, midpoint=None, clip=False): self.midpoint = midpoint colors.Normalize.__init__(self, vmin, vmax, clip) def __call__(self, value, clip=None): # I'm ignoring masked values and all kinds of edge cases to make a # simple example... x, y = [self.vmin, self.midpoint, self.vmax], [0, 0.5, 1] return np.ma.masked_array(np.interp(value, x, y)) fig, ax = plt.subplots(2, 1) pcm = ax[0].pcolormesh(X, Y, Z, norm=MidpointNormalize(midpoint=0.), cmap='RdBu_r') fig.colorbar(pcm, ax=ax[0], extend='both') pcm = ax[1].pcolormesh(X, Y, Z, cmap='RdBu_r', vmin=-np.max(Z)) fig.colorbar(pcm, ax=ax[1], extend='both') fig.show() plt.show()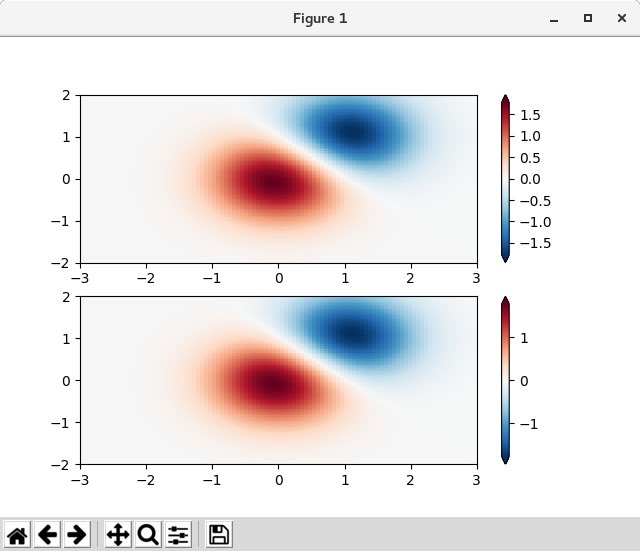
- 参照ページ
Colormap Normalization
- リリースノート
- 2023/03/11 Ver=1.03 Python 3.11.2 で確認
- 2020/10/28 Ver=1.01 Python 3.7.8 で確認
- 2018/11/08 Ver=1.01 初版リリース
- 関連ページ