|
|
matplotlib Constrained Layout Guide. |
H.Kamifuji . |
- 目 次
- Constrained Layout Guide
制約付きレイアウトを使用して図内のプロットをきれいにフィットさせる方法。
constrained_layout は、凡例とカラーバーのようなサブプロットと飾りを自動的に調整し、Figure ウィンドウに収まるようにしながら、ユーザーが要求した論理レイアウトを可能な限り保存します。
constrained_layout は tight_layout と似ていますが、拘束ソルバを使用して、フィットさせる軸のサイズを決定します。
任意の軸が図形に追加される前に、constrained_layout をアクティブにする必要があります。 そうする 2 つの方法があります
- subplots() または figure() へのそれぞれの引数を使用します(例:
plt.subplots( contrained_layout = Truea )
- rcParams を介して起動する:
plt.rcParams ['figure.constrained_layout.use'] = True
それらについては、以下のセクションで詳しく説明します。
警告
Matplotlib 2.2 以降、制約付きレイアウトは実験的です。 ビヘイビアーと API は変更されることがありますが、廃止予定期間なしに機能全体が削除される可能性があります。 あなたのプロットを完全に再現可能にする必要がある場合は、Constrained Layout を実行した後に Axes の位置を取得し、constrained_layout = False のコードで ax.set_position() を使用します。
- Simple Example
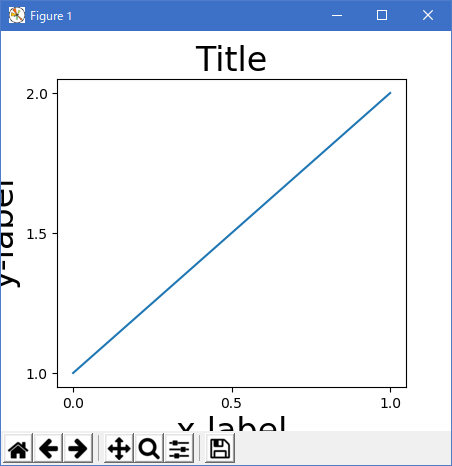
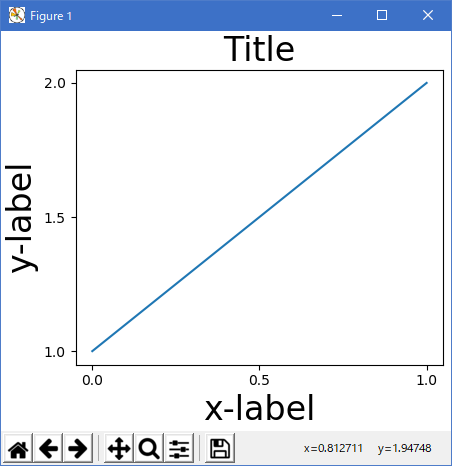
Matplotlib では、軸の位置(サブプロットを含む)は正規化された Figure 座標で指定されます。 あなたの軸のラベルやタイトル(時にはティンカー)は、図の範囲外に出てきて、クリップされることがあります。
# sphinx_gallery_thumbnail_number = 18

#import matplotlib
#matplotlib.use('Qt5Agg')

import warnings

import matplotlib.pyplot as plt
import numpy as np
import matplotlib.colors as mcolors
import matplotlib.gridspec as gridspec

import matplotlib._layoutbox as layoutbox

plt.rcParams['savefig.facecolor'] = "0.8"
plt.rcParams['figure.figsize'] = 4.5, 4.

def example_plot(ax, fontsize=12, nodec=False):
    ax.plot([1, 2])

    ax.locator_params(nbins=3)
    if not nodec:
        ax.set_xlabel('x-label', fontsize=fontsize)
        ax.set_ylabel('y-label', fontsize=fontsize)
        ax.set_title('Title', fontsize=fontsize)
    else:
        ax.set_xticklabels('')
        ax.set_yticklabels('')

fig, ax = plt.subplots(constrained_layout=False)
example_plot(ax, fontsize=24)

plt.show()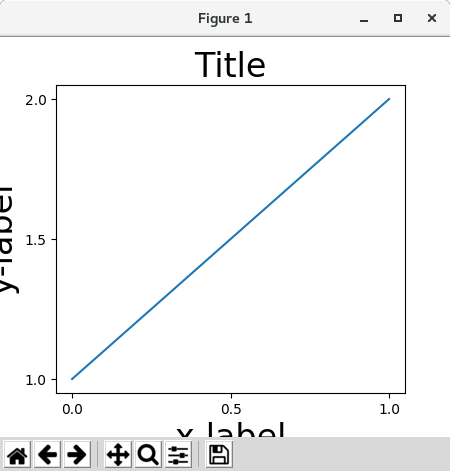
Python 3.11.2 見直しました。上記のコードでは、下記のエラーが発生します。
Traceback (most recent call last):
File "_:\Constrained_Layout_01.py", line 13, in
import matplotlib._layoutbox as layoutbox
ModuleNotFoundError: No module named 'matplotlib._layoutbox'
import matplotlib.pyplot as plt import matplotlib.colors as mcolors import matplotlib.gridspec as gridspec import numpy as np plt.rcParams['savefig.facecolor'] = "0.8" plt.rcParams['figure.figsize'] = 4.5, 4. plt.rcParams['figure.max_open_warning'] = 50 def example_plot(ax, fontsize=12, hide_labels=False): ax.plot([1, 2]) ax.locator_params(nbins=3) if hide_labels: ax.set_xticklabels([]) ax.set_yticklabels([]) else: ax.set_xlabel('x-label', fontsize=fontsize) ax.set_ylabel('y-label', fontsize=fontsize) ax.set_title('Title', fontsize=fontsize) fig, ax = plt.subplots(layout=None) example_plot(ax, fontsize=24) plt.show() 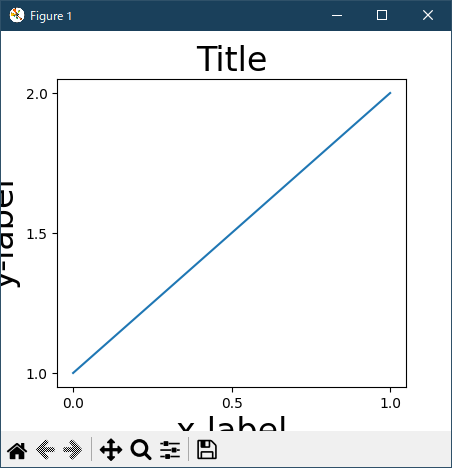
これを防ぐには、軸の位置を調整する必要があります。 サブプロットの場合、これはサブプロットのパラメータを調整することによって行うことができます(軸のエッジを動かして目盛りラベルのためのスペース を確保します)。 ただし、constrained_layout = True kwarg で Figure を指定すると、自動的に調整が行われます。
# sphinx_gallery_thumbnail_number = 18

#import matplotlib
#matplotlib.use('Qt5Agg')

import warnings

import matplotlib.pyplot as plt
import numpy as np
import matplotlib.colors as mcolors
import matplotlib.gridspec as gridspec

import matplotlib._layoutbox as layoutbox

plt.rcParams['savefig.facecolor'] = "0.8"
plt.rcParams['figure.figsize'] = 4.5, 4.


def example_plot(ax, fontsize=12, nodec=False):
    ax.plot([1, 2])

    ax.locator_params(nbins=3)
    if not nodec:
        ax.set_xlabel('x-label', fontsize=fontsize)
        ax.set_ylabel('y-label', fontsize=fontsize)
        ax.set_title('Title', fontsize=fontsize)
    else:
        ax.set_xticklabels('')
        ax.set_yticklabels('')


fig, ax = plt.subplots(constrained_layout=True)
example_plot(ax, fontsize=24)

plt.show()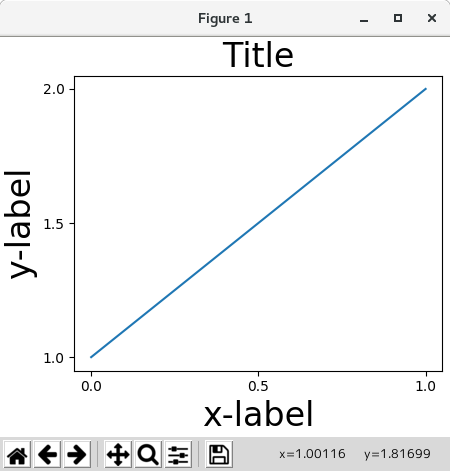
Python 3.11.2 見直しました。上記のコードでは、下記のエラーが発生します。
Traceback (most recent call last):
File "_:\Constrained_Layout_01.py", line 13, in
import matplotlib._layoutbox as layoutbox
ModuleNotFoundError: No module named 'matplotlib._layoutbox'
import matplotlib.pyplot as plt import matplotlib.colors as mcolors import matplotlib.gridspec as gridspec import numpy as np plt.rcParams['savefig.facecolor'] = "0.8" plt.rcParams['figure.figsize'] = 4.5, 4. plt.rcParams['figure.max_open_warning'] = 50 def example_plot(ax, fontsize=12, hide_labels=False): ax.plot([1, 2]) ax.locator_params(nbins=3) if hide_labels: ax.set_xticklabels([]) ax.set_yticklabels([]) else: ax.set_xlabel('x-label', fontsize=fontsize) ax.set_ylabel('y-label', fontsize=fontsize) ax.set_title('Title', fontsize=fontsize) fig, ax = plt.subplots(layout="constrained") example_plot(ax, fontsize=24) plt.show() 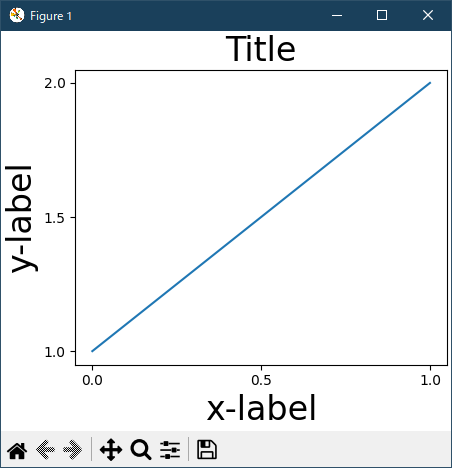
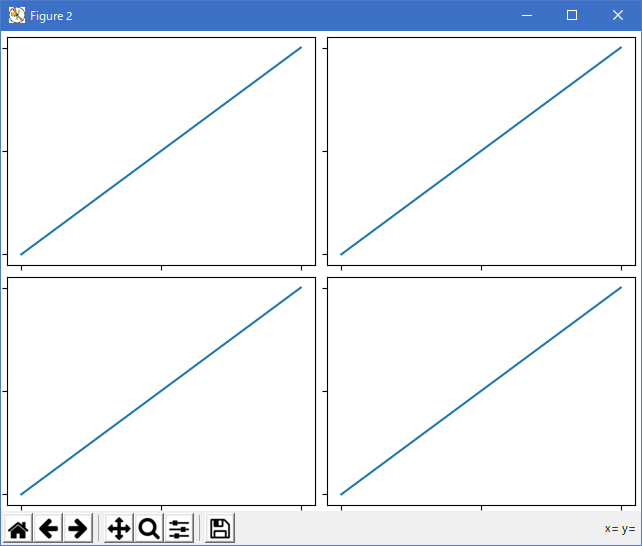
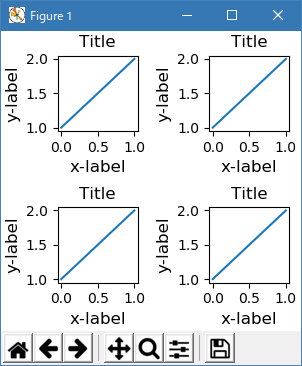
複数のサブプロットがある場合、異なる軸のラベルが重なって表示されることがよくあります。
# sphinx_gallery_thumbnail_number = 18

#import matplotlib
#matplotlib.use('Qt5Agg')

import warnings

import matplotlib.pyplot as plt
import numpy as np
import matplotlib.colors as mcolors
import matplotlib.gridspec as gridspec

import matplotlib._layoutbox as layoutbox

plt.rcParams['savefig.facecolor'] = "0.8"
plt.rcParams['figure.figsize'] = 4.5, 4.

def example_plot(ax, fontsize=12, nodec=False):
    ax.plot([1, 2])

    ax.locator_params(nbins=3)
    if not nodec:
        ax.set_xlabel('x-label', fontsize=fontsize)
        ax.set_ylabel('y-label', fontsize=fontsize)
        ax.set_title('Title', fontsize=fontsize)
    else:
        ax.set_xticklabels('')
        ax.set_yticklabels('')

fig, axs = plt.subplots(2, 2, constrained_layout=False)
for ax in axs.flatten():
    example_plot(ax)

plt.show()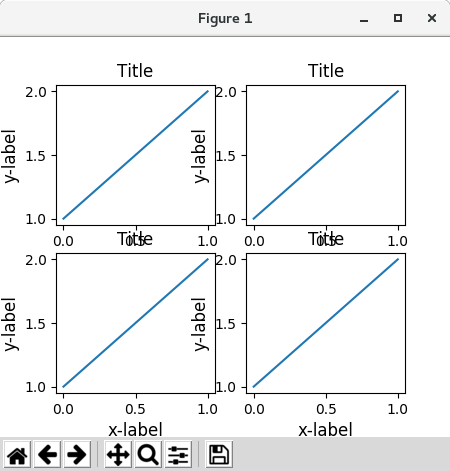
Python 3.11.2 見直しました。上記のコードでは、下記のエラーが発生します。
Traceback (most recent call last):
File "_:\Constrained_Layout_01.py", line 13, in
import matplotlib._layoutbox as layoutbox
ModuleNotFoundError: No module named 'matplotlib._layoutbox'
import matplotlib.pyplot as plt import matplotlib.colors as mcolors import matplotlib.gridspec as gridspec import numpy as np plt.rcParams['savefig.facecolor'] = "0.8" plt.rcParams['figure.figsize'] = 4.5, 4. plt.rcParams['figure.max_open_warning'] = 50 def example_plot(ax, fontsize=12, hide_labels=False): ax.plot([1, 2]) ax.locator_params(nbins=3) if hide_labels: ax.set_xticklabels([]) ax.set_yticklabels([]) else: ax.set_xlabel('x-label', fontsize=fontsize) ax.set_ylabel('y-label', fontsize=fontsize) ax.set_title('Title', fontsize=fontsize) fig, axs = plt.subplots(2, 2, layout=None) for ax in axs.flat: example_plot(ax) plt.show() 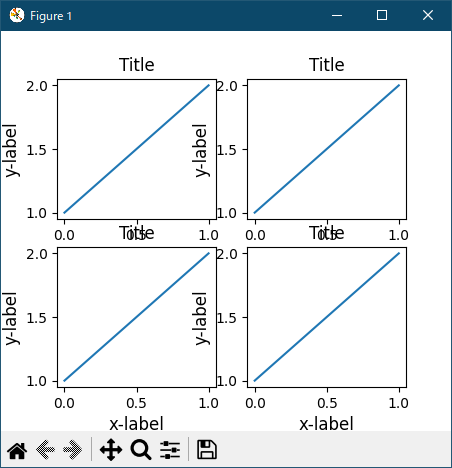
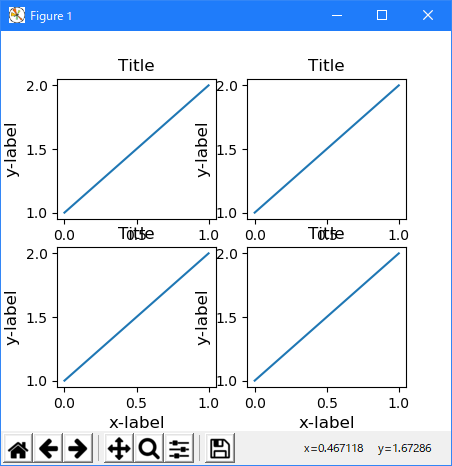
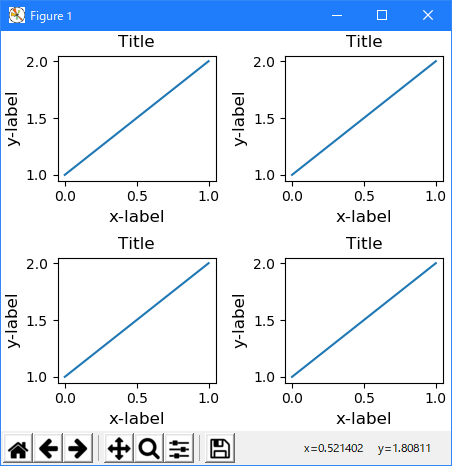
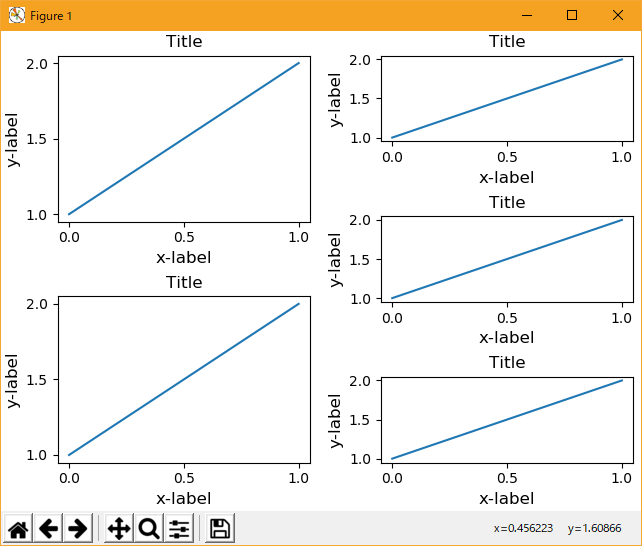
plt.subplot の呼び出しで constrained_layout = True を指定すると、レイアウトが適切に制約されます。
# sphinx_gallery_thumbnail_number = 18

#import matplotlib
#matplotlib.use('Qt5Agg')

import warnings

import matplotlib.pyplot as plt
import numpy as np
import matplotlib.colors as mcolors
import matplotlib.gridspec as gridspec

import matplotlib._layoutbox as layoutbox

plt.rcParams['savefig.facecolor'] = "0.8"
plt.rcParams['figure.figsize'] = 4.5, 4.

def example_plot(ax, fontsize=12, nodec=False):
    ax.plot([1, 2])

    ax.locator_params(nbins=3)
    if not nodec:
        ax.set_xlabel('x-label', fontsize=fontsize)
        ax.set_ylabel('y-label', fontsize=fontsize)
        ax.set_title('Title', fontsize=fontsize)
    else:
        ax.set_xticklabels('')
        ax.set_yticklabels('')

fig, axs = plt.subplots(2, 2, constrained_layout=True)
for ax in axs.flatten():
    example_plot(ax)

plt.show()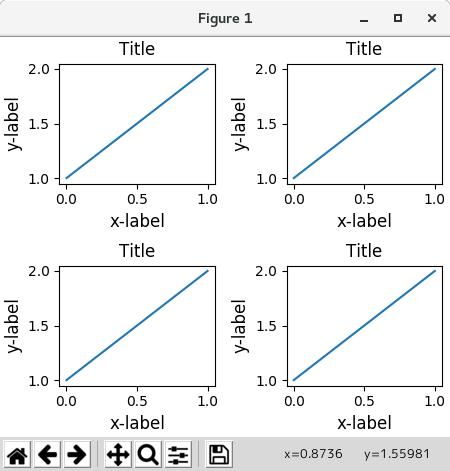
Python 3.11.2 見直しました。上記のコードでは、下記のエラーが発生します。
Traceback (most recent call last):
File "_:\Constrained_Layout_01.py", line 13, in
import matplotlib._layoutbox as layoutbox
ModuleNotFoundError: No module named 'matplotlib._layoutbox'
import matplotlib.pyplot as plt import matplotlib.colors as mcolors import matplotlib.gridspec as gridspec import numpy as np plt.rcParams['savefig.facecolor'] = "0.8" plt.rcParams['figure.figsize'] = 4.5, 4. plt.rcParams['figure.max_open_warning'] = 50 def example_plot(ax, fontsize=12, hide_labels=False): ax.plot([1, 2]) ax.locator_params(nbins=3) if hide_labels: ax.set_xticklabels([]) ax.set_yticklabels([]) else: ax.set_xlabel('x-label', fontsize=fontsize) ax.set_ylabel('y-label', fontsize=fontsize) ax.set_title('Title', fontsize=fontsize) fig, axs = plt.subplots(2, 2, layout="constrained") for ax in axs.flat: example_plot(ax) plt.show() 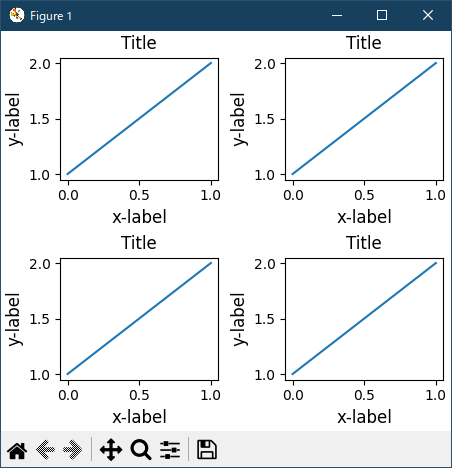
- Colorbars
colorbar() コマンドを使用してカラーバーを作成し、必要なスペースを確保します。 constrained_layout はこれを自動的に行います。 use_gridspec = True を指定すると、このオプションは tight_layout 経由でレイアウトを改善するために無視されることに注意してください。
注意
pcolormesh kwargs(pc_kwargs)については、辞書を使用します。 以下では、それぞれが ScalarMappable を含むいくつかの軸に 1 つのカラーバーを割り当てます。 ノルムとカラーマップを指定すると、カラーバーがすべての軸に対して正確であることが保証されます。
# sphinx_gallery_thumbnail_number = 18

#import matplotlib
#matplotlib.use('Qt5Agg')

import warnings

import matplotlib.pyplot as plt
import numpy as np
import matplotlib.colors as mcolors
import matplotlib.gridspec as gridspec

import matplotlib._layoutbox as layoutbox

arr = np.arange(100).reshape((10, 10))
norm = mcolors.Normalize(vmin=0., vmax=100.)
# see note above: this makes all pcolormesh calls consistent:
pc_kwargs = {'rasterized': True, 'cmap': 'viridis', 'norm': norm}
fig, ax = plt.subplots(figsize=(4, 4), constrained_layout=True)
im = ax.pcolormesh(arr, **pc_kwargs)
fig.colorbar(im, ax=ax, shrink=0.6)

plt.show()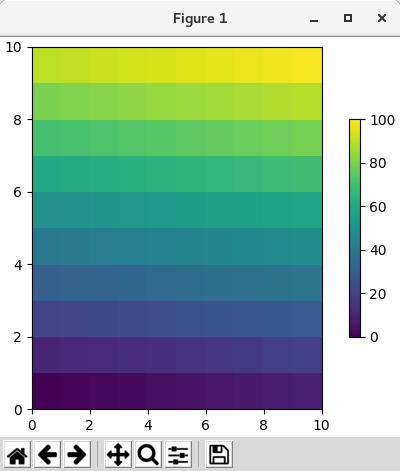
Python 3.11.2 見直しました。上記のコードでは、下記のエラーが発生します。
Traceback (most recent call last):
File "_:\Constrained_Layout_01.py", line 13, in
import matplotlib._layoutbox as layoutbox
ModuleNotFoundError: No module named 'matplotlib._layoutbox'
import matplotlib.pyplot as plt import matplotlib.colors as mcolors import matplotlib.gridspec as gridspec import numpy as np plt.rcParams['savefig.facecolor'] = "0.8" plt.rcParams['figure.figsize'] = 4.5, 4. plt.rcParams['figure.max_open_warning'] = 50 arr = np.arange(100).reshape((10, 10)) norm = mcolors.Normalize(vmin=0., vmax=100.) # see note above: this makes all pcolormesh calls consistent: pc_kwargs = {'rasterized': True, 'cmap': 'viridis', 'norm': norm} fig, ax = plt.subplots(figsize=(4, 4), layout="constrained") im = ax.pcolormesh(arr, **pc_kwargs) fig.colorbar(im, ax=ax, shrink=0.6) plt.show() 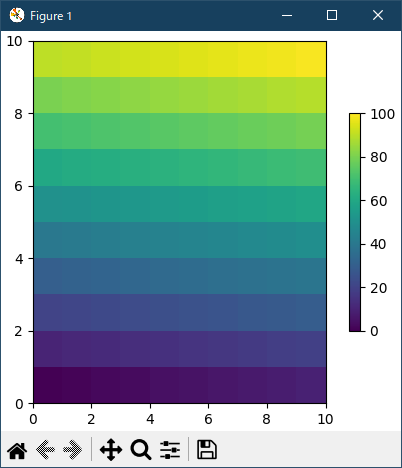
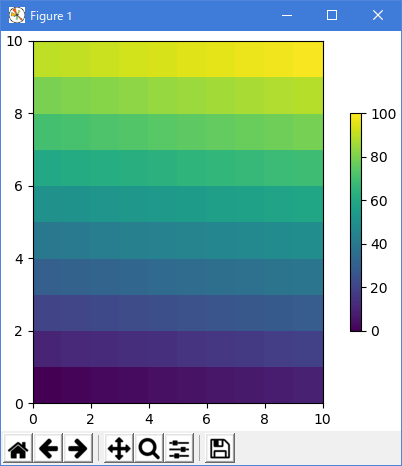
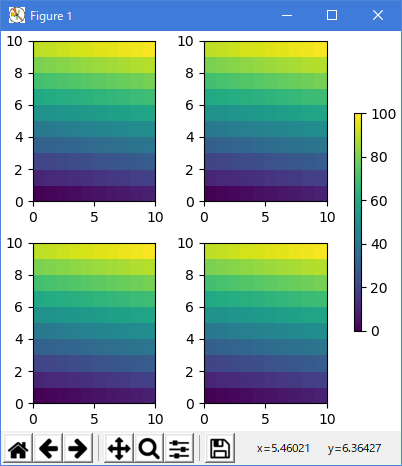
colorbar の ax 引数に軸(またはその他の反復可能なコンテナ)のリストを指定すると、constrained_layout は同じグリッド・スペックを共有するすべての軸からスペースをとります。
# sphinx_gallery_thumbnail_number = 18

#import matplotlib
#matplotlib.use('Qt5Agg')

import warnings

import matplotlib.pyplot as plt
import numpy as np
import matplotlib.colors as mcolors
import matplotlib.gridspec as gridspec

import matplotlib._layoutbox as layoutbox

arr = np.arange(100).reshape((10, 10))
norm = mcolors.Normalize(vmin=0., vmax=100.)
# see note above: this makes all pcolormesh calls consistent:
pc_kwargs = {'rasterized': True, 'cmap': 'viridis', 'norm': norm}

fig, axs = plt.subplots(2, 2, figsize=(4, 4), constrained_layout=True)
for ax in axs.flatten():
    im = ax.pcolormesh(arr, **pc_kwargs)
fig.colorbar(im, ax=axs, shrink=0.6)

plt.show()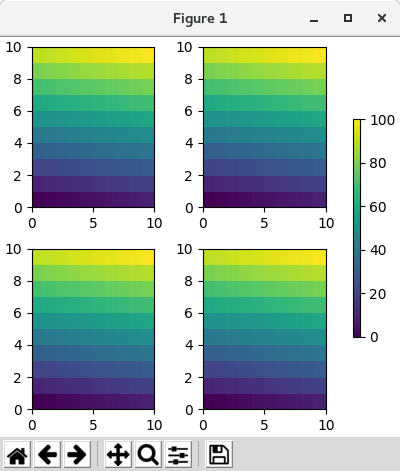
Python 3.11.2 見直しました。上記のコードでは、下記のエラーが発生します。
Traceback (most recent call last):
File "_:\Constrained_Layout_01.py", line 13, in
import matplotlib._layoutbox as layoutbox
ModuleNotFoundError: No module named 'matplotlib._layoutbox'
import matplotlib.pyplot as plt import matplotlib.colors as mcolors import matplotlib.gridspec as gridspec import numpy as np plt.rcParams['savefig.facecolor'] = "0.8" plt.rcParams['figure.figsize'] = 4.5, 4. plt.rcParams['figure.max_open_warning'] = 50 arr = np.arange(100).reshape((10, 10)) norm = mcolors.Normalize(vmin=0., vmax=100.) # see note above: this makes all pcolormesh calls consistent: pc_kwargs = {'rasterized': True, 'cmap': 'viridis', 'norm': norm} fig, axs = plt.subplots(2, 2, figsize=(4, 4), layout="constrained") for ax in axs.flat: im = ax.pcolormesh(arr, **pc_kwargs) fig.colorbar(im, ax=axs, shrink=0.6) plt.show() 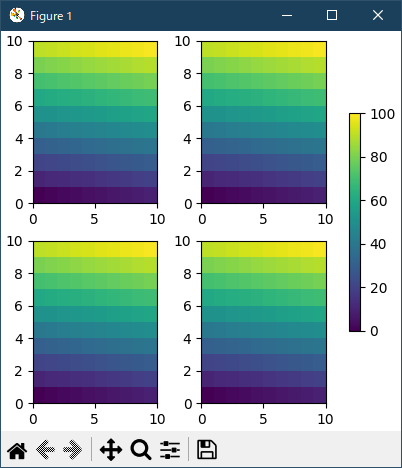
親として 1 つの軸を指定するときは微妙な微妙な違いがあることに注意してください。 以下では、カラーバーが整列することが望ましく、期待されるかもしれませんが、ボトム軸とペアになったカラーバーが軸のサブプロットスペックに結び付けられているため、グリッドスペックカラーバーが追加されると縮小します 。
# sphinx_gallery_thumbnail_number = 18

#import matplotlib
#matplotlib.use('Qt5Agg')

import warnings

import matplotlib.pyplot as plt
import numpy as np
import matplotlib.colors as mcolors
import matplotlib.gridspec as gridspec

import matplotlib._layoutbox as layoutbox

arr = np.arange(100).reshape((10, 10))
norm = mcolors.Normalize(vmin=0., vmax=100.)
# see note above: this makes all pcolormesh calls consistent:
pc_kwargs = {'rasterized': True, 'cmap': 'viridis', 'norm': norm}
fig, axs = plt.subplots(3, 1, figsize=(4, 4), constrained_layout=True)
for ax in axs[:2]:
    im = ax.pcolormesh(arr, **pc_kwargs)
fig.colorbar(im, ax=axs[:2], shrink=0.6)
im = axs[2].pcolormesh(arr, **pc_kwargs)
fig.colorbar(im, ax=axs[2], shrink=0.6)

plt.show()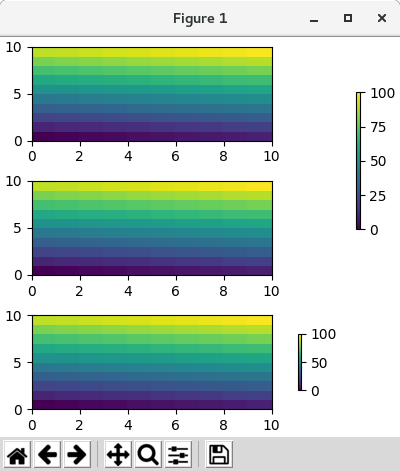
Python 3.11.2 見直しました。上記のコードでは、下記のエラーが発生します。
Traceback (most recent call last):
File "_:\Constrained_Layout_01.py", line 13, in
import matplotlib._layoutbox as layoutbox
ModuleNotFoundError: No module named 'matplotlib._layoutbox'
import matplotlib.pyplot as plt import matplotlib.colors as mcolors import matplotlib.gridspec as gridspec import numpy as np plt.rcParams['savefig.facecolor'] = "0.8" plt.rcParams['figure.figsize'] = 4.5, 4. plt.rcParams['figure.max_open_warning'] = 50 arr = np.arange(100).reshape((10, 10)) norm = mcolors.Normalize(vmin=0., vmax=100.) # see note above: this makes all pcolormesh calls consistent: pc_kwargs = {'rasterized': True, 'cmap': 'viridis', 'norm': norm} fig, axs = plt.subplots(3, 3, figsize=(4, 4), layout="constrained") for ax in axs.flat: im = ax.pcolormesh(arr, **pc_kwargs) fig.colorbar(im, ax=axs[1:, ][:, 1], shrink=0.8) fig.colorbar(im, ax=axs[:, -1], shrink=0.6) plt.show() 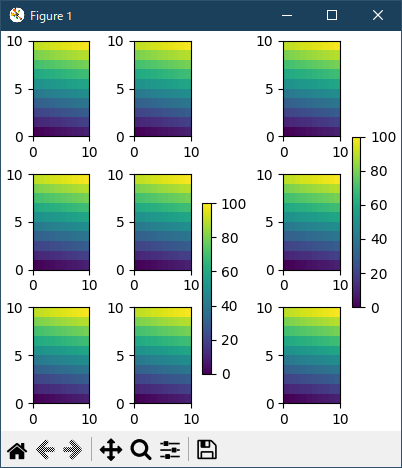
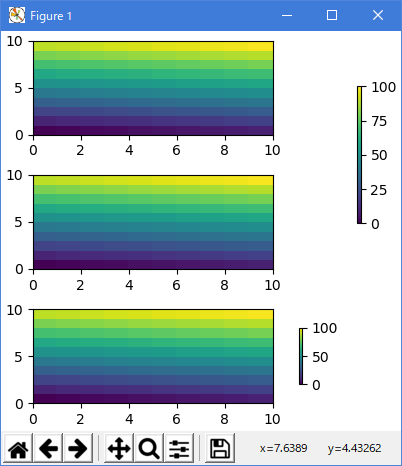
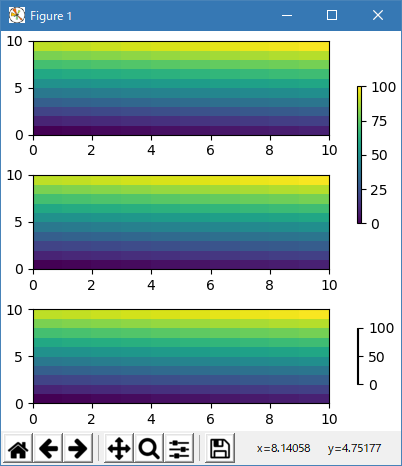
Axes のリストのような単一軸の動作をさせるAPIは、以下のようにリスト(または他の反復可能なコンテナ)として指定することです:
# sphinx_gallery_thumbnail_number = 18

#import matplotlib
#matplotlib.use('Qt5Agg')

import warnings

import matplotlib.pyplot as plt
import numpy as np
import matplotlib.colors as mcolors
import matplotlib.gridspec as gridspec

import matplotlib._layoutbox as layoutbox

arr = np.arange(100).reshape((10, 10))
norm = mcolors.Normalize(vmin=0., vmax=100.)
# see note above: this makes all pcolormesh calls consistent:
pc_kwargs = {'rasterized': True, 'cmap': 'viridis', 'norm': norm}
fig, axs = plt.subplots(3, 1, figsize=(4, 4), constrained_layout=True)
for ax in axs[:2]:
    im = ax.pcolormesh(arr, **pc_kwargs)
fig.colorbar(im, ax=axs[:2], shrink=0.6)
im = axs[2].pcolormesh(arr, **pc_kwargs)
fig.colorbar(im, ax=[axs[2]], shrink=0.6)

plt.show()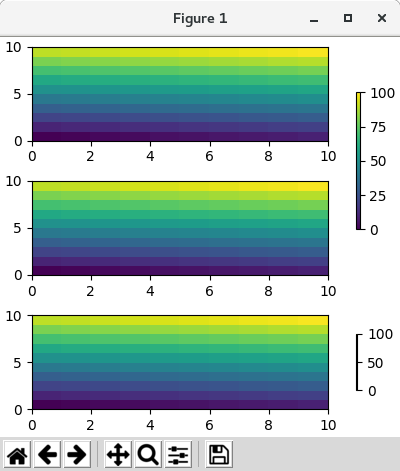
Python 3.11.2 見直しました。上記のコードでは、下記のエラーが発生します。
Traceback (most recent call last):
File "_:\Constrained_Layout_01.py", line 13, in
import matplotlib._layoutbox as layoutbox
ModuleNotFoundError: No module named 'matplotlib._layoutbox'
対応作は、省略します。
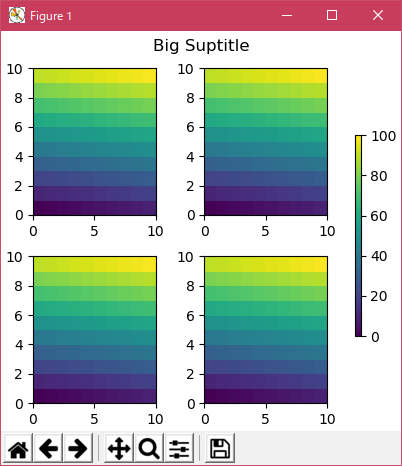
- Suptitle
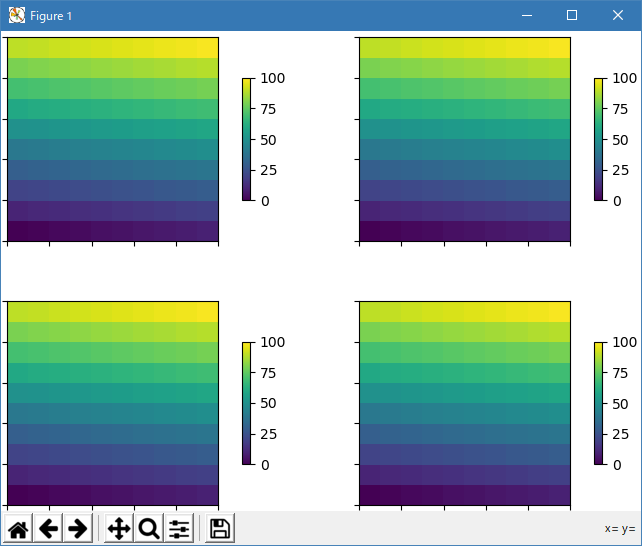
constrained_layout はまた suptitle のための余地を作ることができます。
# sphinx_gallery_thumbnail_number = 18

#import matplotlib
#matplotlib.use('Qt5Agg')

import warnings

import matplotlib.pyplot as plt
import numpy as np
import matplotlib.colors as mcolors
import matplotlib.gridspec as gridspec

import matplotlib._layoutbox as layoutbox

arr = np.arange(100).reshape((10, 10))
norm = mcolors.Normalize(vmin=0., vmax=100.)
# see note above: this makes all pcolormesh calls consistent:
pc_kwargs = {'rasterized': True, 'cmap': 'viridis', 'norm': norm}

fig, axs = plt.subplots(2, 2, figsize=(4, 4), constrained_layout=True)
for ax in axs.flatten():
    im = ax.pcolormesh(arr, **pc_kwargs)
fig.colorbar(im, ax=axs, shrink=0.6)
fig.suptitle('Big Suptitle')

plt.show()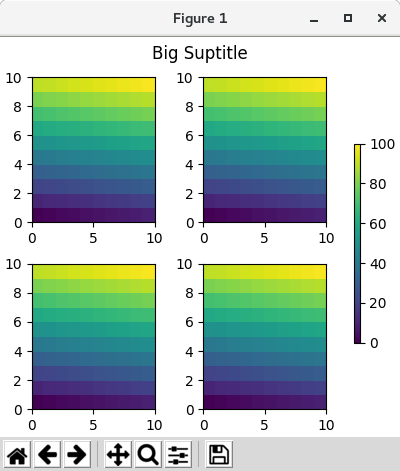
Python 3.11.2 見直しました。上記のコードでは、下記のエラーが発生します。
Traceback (most recent call last):
File "_:\Constrained_Layout_01.py", line 13, in
import matplotlib._layoutbox as layoutbox
ModuleNotFoundError: No module named 'matplotlib._layoutbox'
import matplotlib.pyplot as plt import matplotlib.colors as mcolors import matplotlib.gridspec as gridspec import numpy as np plt.rcParams['savefig.facecolor'] = "0.8" plt.rcParams['figure.figsize'] = 4.5, 4. plt.rcParams['figure.max_open_warning'] = 50 arr = np.arange(100).reshape((10, 10)) norm = mcolors.Normalize(vmin=0., vmax=100.) # see note above: this makes all pcolormesh calls consistent: pc_kwargs = {'rasterized': True, 'cmap': 'viridis', 'norm': norm} fig, axs = plt.subplots(2, 2, figsize=(4, 4), layout="constrained") for ax in axs.flat: im = ax.pcolormesh(arr, **pc_kwargs) fig.colorbar(im, ax=axs, shrink=0.6) fig.suptitle('Big Suptitle') plt.show() 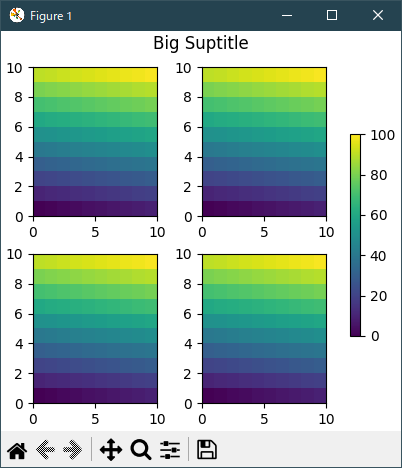
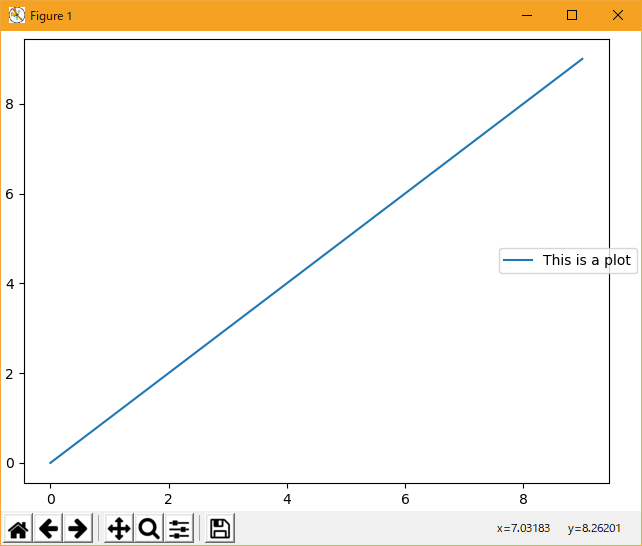
- Legends
凡例は親軸の外側に配置することができます。 Constrained-layout は Axes.legend() に対してこれを処理するように設計されています。 しかし、constrained-layout は Figure.legend() (まだ)を通して作成されている凡例を処理しません。
# sphinx_gallery_thumbnail_number = 18

#import matplotlib
#matplotlib.use('Qt5Agg')

import warnings

import matplotlib.pyplot as plt
import numpy as np
import matplotlib.colors as mcolors
import matplotlib.gridspec as gridspec

import matplotlib._layoutbox as layoutbox

arr = np.arange(100).reshape((10, 10))
norm = mcolors.Normalize(vmin=0., vmax=100.)
# see note above: this makes all pcolormesh calls consistent:
pc_kwargs = {'rasterized': True, 'cmap': 'viridis', 'norm': norm}

fig, ax = plt.subplots(constrained_layout=True)
ax.plot(np.arange(10), label='This is a plot')
ax.legend(loc='center left', bbox_to_anchor=(0.8, 0.5))

plt.show()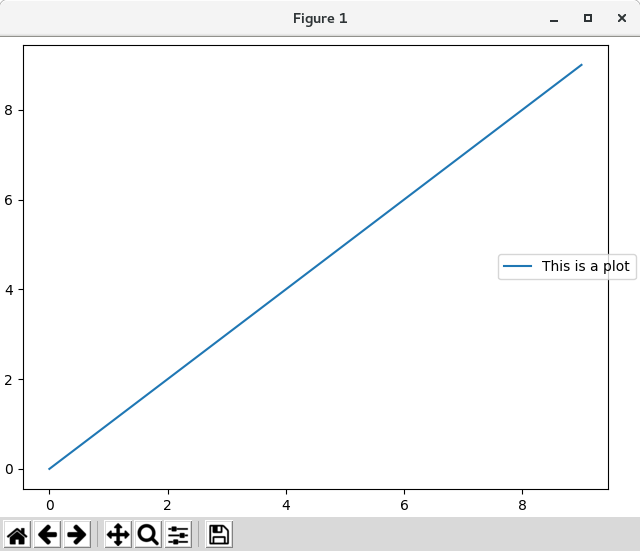
Python 3.11.2 見直しました。上記のコードでは、下記のエラーが発生します。
Traceback (most recent call last):
File "_:\Constrained_Layout_01.py", line 13, in
import matplotlib._layoutbox as layoutbox
ModuleNotFoundError: No module named 'matplotlib._layoutbox'
import matplotlib.pyplot as plt import matplotlib.colors as mcolors import matplotlib.gridspec as gridspec import numpy as np plt.rcParams['savefig.facecolor'] = "0.8" plt.rcParams['figure.figsize'] = 4.5, 4. plt.rcParams['figure.max_open_warning'] = 50 arr = np.arange(100).reshape((10, 10)) norm = mcolors.Normalize(vmin=0., vmax=100.) # see note above: this makes all pcolormesh calls consistent: pc_kwargs = {'rasterized': True, 'cmap': 'viridis', 'norm': norm} fig, ax = plt.subplots(layout="constrained") ax.plot(np.arange(10), label='This is a plot') ax.legend(loc='center left', bbox_to_anchor=(0.8, 0.5)) plt.show() 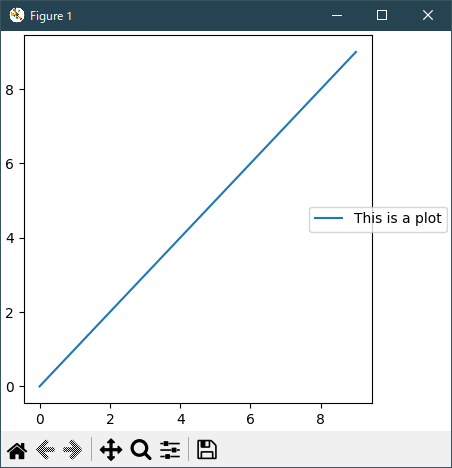
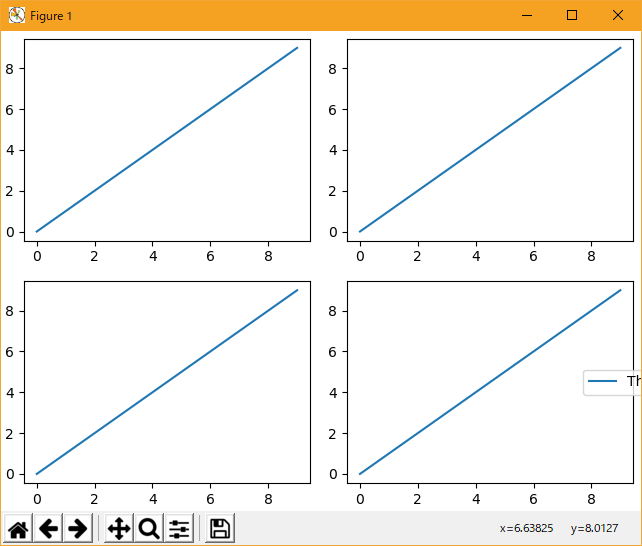
しかし、これは、サブプロットレイアウトからスペースを奪うでしょう:
# sphinx_gallery_thumbnail_number = 18

#import matplotlib
#matplotlib.use('Qt5Agg')

import warnings

import matplotlib.pyplot as plt
import numpy as np
import matplotlib.colors as mcolors
import matplotlib.gridspec as gridspec

import matplotlib._layoutbox as layoutbox

arr = np.arange(100).reshape((10, 10))
norm = mcolors.Normalize(vmin=0., vmax=100.)
# see note above: this makes all pcolormesh calls consistent:
pc_kwargs = {'rasterized': True, 'cmap': 'viridis', 'norm': norm}

fig, axs = plt.subplots(2, 2, constrained_layout=True)
for ax in axs.flatten()[:-1]:
    ax.plot(np.arange(10))
axs[1, 1].plot(np.arange(10), label='This is a plot')
axs[1, 1].legend(loc='center left', bbox_to_anchor=(0.8, 0.5))

plt.show()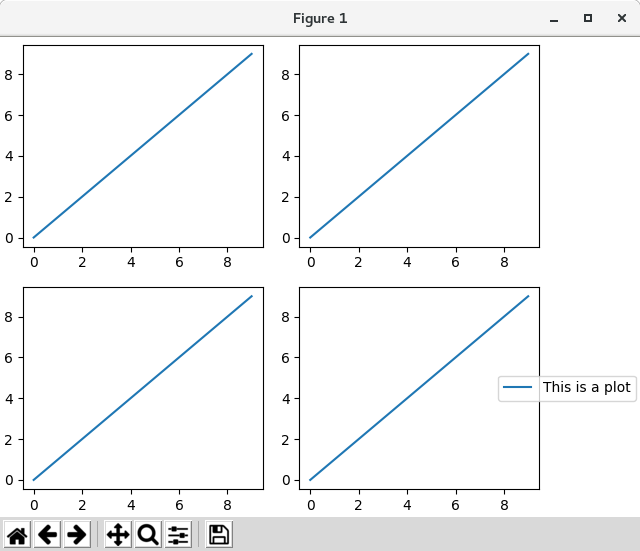
Python 3.11.2 見直しました。上記のコードでは、下記のエラーが発生します。
Traceback (most recent call last):
File "_:\Constrained_Layout_01.py", line 13, in
import matplotlib._layoutbox as layoutbox
ModuleNotFoundError: No module named 'matplotlib._layoutbox'
import matplotlib.pyplot as plt import matplotlib.colors as mcolors import matplotlib.gridspec as gridspec import numpy as np plt.rcParams['savefig.facecolor'] = "0.8" plt.rcParams['figure.figsize'] = 4.5, 4. plt.rcParams['figure.max_open_warning'] = 50 arr = np.arange(100).reshape((10, 10)) norm = mcolors.Normalize(vmin=0., vmax=100.) # see note above: this makes all pcolormesh calls consistent: pc_kwargs = {'rasterized': True, 'cmap': 'viridis', 'norm': norm} fig, axs = plt.subplots(1, 2, figsize=(4, 2), layout="constrained") axs[0].plot(np.arange(10)) axs[1].plot(np.arange(10), label='This is a plot') axs[1].legend(loc='center left', bbox_to_anchor=(0.8, 0.5)) plt.show() 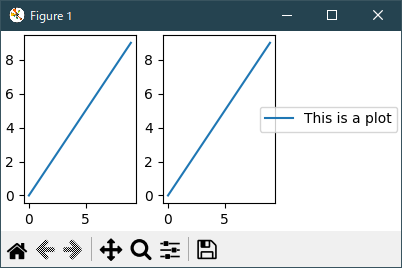
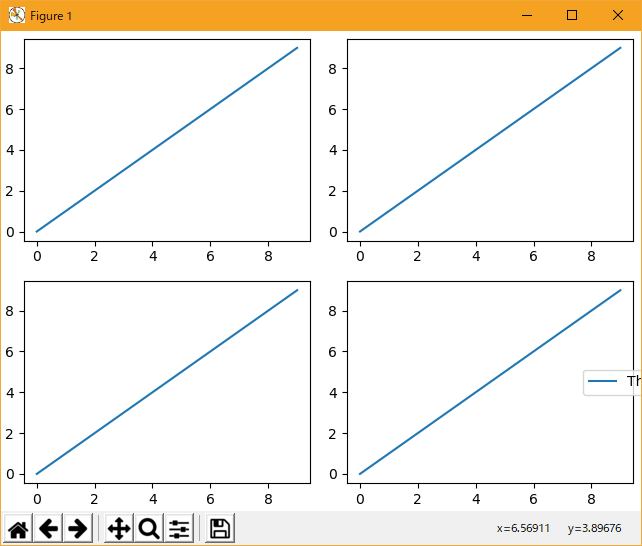
凡例や他のアーティストがサブプロットレイアウトからスペースを奪うことができないようにするには、leg.set_in_layout( False ) を使用できます。 もちろんこれは、凡例が切り取られることを意味しますが、plot が後で fig.savefig( 'outname.png'、bbox_inches = 'tight' ) で呼び出された場合に役立ちます。 ただし、凡例の get_in_layout ステータスは、保存されたファイルを動作させるために再度トグルする必要があります。
# sphinx_gallery_thumbnail_number = 18

#import matplotlib
#matplotlib.use('Qt5Agg')

import warnings

import matplotlib.pyplot as plt
import numpy as np
import matplotlib.colors as mcolors
import matplotlib.gridspec as gridspec

import matplotlib._layoutbox as layoutbox

arr = np.arange(100).reshape((10, 10))
norm = mcolors.Normalize(vmin=0., vmax=100.)
# see note above: this makes all pcolormesh calls consistent:
pc_kwargs = {'rasterized': True, 'cmap': 'viridis', 'norm': norm}

fig, axs = plt.subplots(2, 2, constrained_layout=True)
for ax in axs.flatten()[:-1]:
    ax.plot(np.arange(10))
axs[1, 1].plot(np.arange(10), label='This is a plot')
leg = axs[1, 1].legend(loc='center left', bbox_to_anchor=(0.8, 0.5))
leg.set_in_layout(False)
wanttoprint = False
if wanttoprint:
    leg.set_in_layout(True)
    fig.do_constrained_layout(False)
    fig.savefig('outname.png', bbox_inches='tight')

plt.show()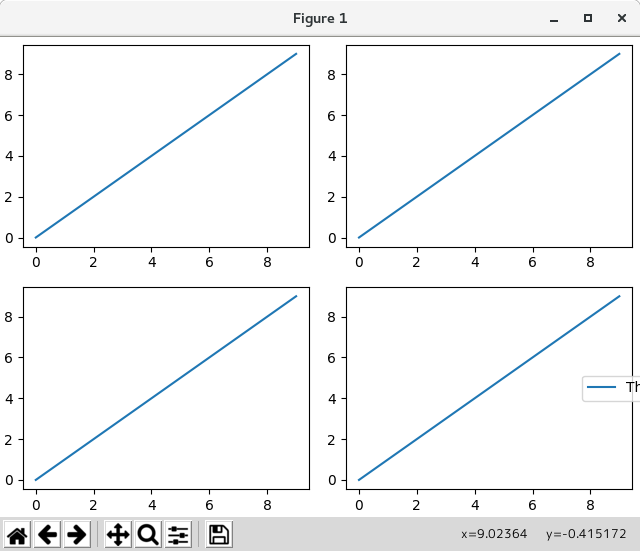
Python 3.11.2 見直しました。上記のコードでは、下記のエラーが発生します。
Traceback (most recent call last):
File "_:\Constrained_Layout_01.py", line 13, in
import matplotlib._layoutbox as layoutbox
ModuleNotFoundError: No module named 'matplotlib._layoutbox'
import matplotlib.pyplot as plt import matplotlib.colors as mcolors import matplotlib.gridspec as gridspec import numpy as np plt.rcParams['savefig.facecolor'] = "0.8" plt.rcParams['figure.figsize'] = 4.5, 4. plt.rcParams['figure.max_open_warning'] = 50 arr = np.arange(100).reshape((10, 10)) norm = mcolors.Normalize(vmin=0., vmax=100.) # see note above: this makes all pcolormesh calls consistent: pc_kwargs = {'rasterized': True, 'cmap': 'viridis', 'norm': norm} fig, axs = plt.subplots(1, 2, figsize=(4, 2), layout="constrained") axs[0].plot(np.arange(10)) axs[1].plot(np.arange(10), label='This is a plot') leg = axs[1].legend(loc='center left', bbox_to_anchor=(0.8, 0.5)) leg.set_in_layout(False) # trigger a draw so that constrained_layout is executed once # before we turn it off when printing.... fig.canvas.draw() # we want the legend included in the bbox_inches='tight' calcs. leg.set_in_layout(True) # we don't want the layout to change at this point. fig.set_layout_engine(None) try: fig.savefig('../../doc/_static/constrained_layout_1b.png', bbox_inches='tight', dpi=100) except FileNotFoundError: # this allows the script to keep going if run interactively and # the directory above doesn't exist pass plt.show() 
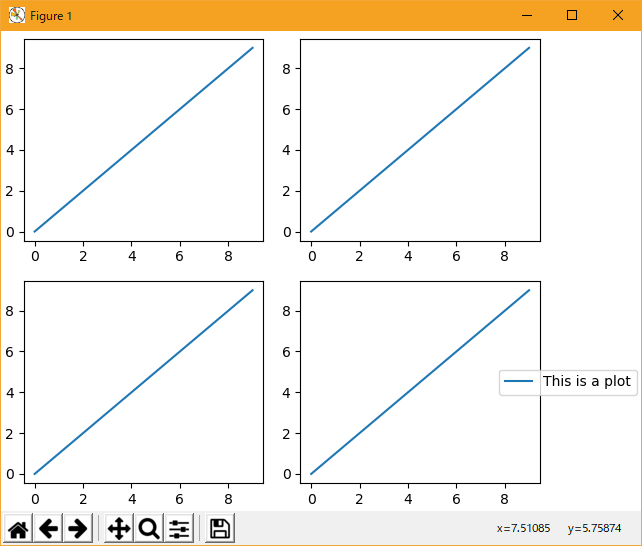
この不自然さを回避するより良い方法は、単に図の凡例を使用することです。
# sphinx_gallery_thumbnail_number = 18

#import matplotlib
#matplotlib.use('Qt5Agg')

import warnings

import matplotlib.pyplot as plt
import numpy as np
import matplotlib.colors as mcolors
import matplotlib.gridspec as gridspec

import matplotlib._layoutbox as layoutbox

arr = np.arange(100).reshape((10, 10))
norm = mcolors.Normalize(vmin=0., vmax=100.)
# see note above: this makes all pcolormesh calls consistent:
pc_kwargs = {'rasterized': True, 'cmap': 'viridis', 'norm': norm}

fig, axs = plt.subplots(2, 2, constrained_layout=True)
for ax in axs.flatten()[:-1]:
    ax.plot(np.arange(10))
lines = axs[1, 1].plot(np.arange(10), label='This is a plot')
labels = [l.get_label() for l in lines]
leg = fig.legend(lines, labels, loc='center left',
                 bbox_to_anchor=(0.8, 0.5), bbox_transform=axs[1, 1].transAxes)

plt.show()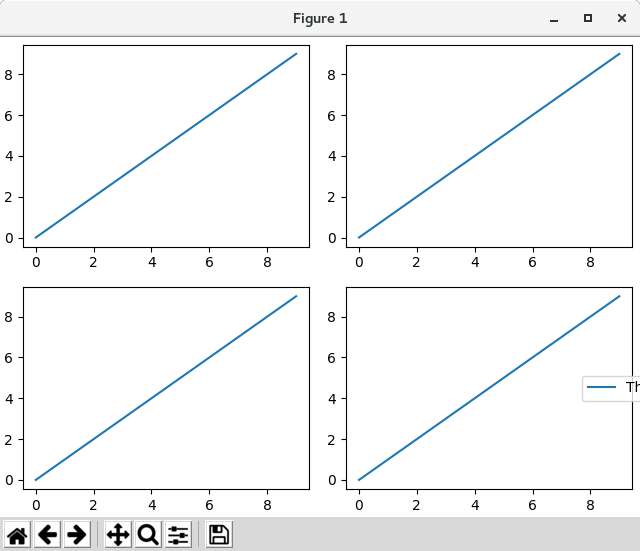
Python 3.11.2 見直しました。上記のコードでは、下記のエラーが発生します。
Traceback (most recent call last):
File "_:\Constrained_Layout_01.py", line 13, in
import matplotlib._layoutbox as layoutbox
ModuleNotFoundError: No module named 'matplotlib._layoutbox'
import matplotlib.pyplot as plt import matplotlib.colors as mcolors import matplotlib.gridspec as gridspec import numpy as np plt.rcParams['savefig.facecolor'] = "0.8" plt.rcParams['figure.figsize'] = 4.5, 4. plt.rcParams['figure.max_open_warning'] = 50 arr = np.arange(100).reshape((10, 10)) norm = mcolors.Normalize(vmin=0., vmax=100.) # see note above: this makes all pcolormesh calls consistent: pc_kwargs = {'rasterized': True, 'cmap': 'viridis', 'norm': norm} fig, axs = plt.subplots(1, 2, figsize=(4, 2), layout="constrained") axs[0].plot(np.arange(10)) lines = axs[1].plot(np.arange(10), label='This is a plot') labels = [l.get_label() for l in lines] leg = fig.legend(lines, labels, loc='center left', bbox_to_anchor=(0.8, 0.5), bbox_transform=axs[1].transAxes) try: fig.savefig('../../doc/_static/constrained_layout_2b.png', bbox_inches='tight', dpi=100) except FileNotFoundError: # this allows the script to keep going if run interactively and # the directory above doesn't exist pass plt.show() 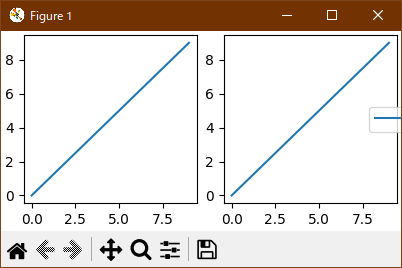
- Padding and Spacing
constrained_layout では、各軸の周りにパディングを実装しています。 このパディングは、プロットの端からの距離、および隣接するプロット間の最小距離を設定します。 関数の set_constrained_layout_pads にキーワード引数 w_pad と h_pad でインチで指定します:
# sphinx_gallery_thumbnail_number = 18

#import matplotlib
#matplotlib.use('Qt5Agg')

import warnings

import matplotlib.pyplot as plt
import numpy as np
import matplotlib.colors as mcolors
import matplotlib.gridspec as gridspec

import matplotlib._layoutbox as layoutbox

def example_plot(ax, fontsize=12, nodec=False):
    ax.plot([1, 2])

    ax.locator_params(nbins=3)
    if not nodec:
        ax.set_xlabel('x-label', fontsize=fontsize)
        ax.set_ylabel('y-label', fontsize=fontsize)
        ax.set_title('Title', fontsize=fontsize)
    else:
        ax.set_xticklabels('')
        ax.set_yticklabels('')

arr = np.arange(100).reshape((10, 10))
norm = mcolors.Normalize(vmin=0., vmax=100.)
# see note above: this makes all pcolormesh calls consistent:
pc_kwargs = {'rasterized': True, 'cmap': 'viridis', 'norm': norm}

fig, axs = plt.subplots(2, 2, constrained_layout=True)
for ax in axs.flatten():
    example_plot(ax, nodec=True)
    ax.set_xticklabels('')
    ax.set_yticklabels('')
fig.set_constrained_layout_pads(w_pad=4./72., h_pad=4./72.,
        hspace=0., wspace=0.)

fig, axs = plt.subplots(2, 2, constrained_layout=True)
for ax in axs.flatten():
    example_plot(ax, nodec=True)
    ax.set_xticklabels('')
    ax.set_yticklabels('')
fig.set_constrained_layout_pads(w_pad=2./72., h_pad=2./72.,
        hspace=0., wspace=0.)

plt.show()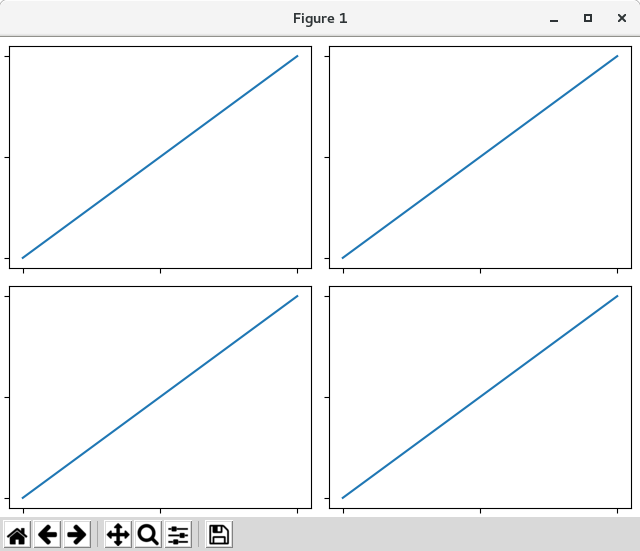
Python 3.11.2 見直しました。上記のコードでは、下記のエラーが発生します。
Traceback (most recent call last):
File "_:\Constrained_Layout_01.py", line 13, in
import matplotlib._layoutbox as layoutbox
ModuleNotFoundError: No module named 'matplotlib._layoutbox'
import matplotlib.pyplot as plt import matplotlib.colors as mcolors import matplotlib.gridspec as gridspec import numpy as np plt.rcParams['savefig.facecolor'] = "0.8" plt.rcParams['figure.figsize'] = 4.5, 4. plt.rcParams['figure.max_open_warning'] = 50 def example_plot(ax, fontsize=12, hide_labels=False): ax.plot([1, 2]) ax.locator_params(nbins=3) if hide_labels: ax.set_xticklabels([]) ax.set_yticklabels([]) else: ax.set_xlabel('x-label', fontsize=fontsize) ax.set_ylabel('y-label', fontsize=fontsize) ax.set_title('Title', fontsize=fontsize) fig, axs = plt.subplots(2, 2, layout="constrained") for ax in axs.flat: example_plot(ax, hide_labels=True) fig.get_layout_engine().set(w_pad=4 / 72, h_pad=4 / 72, hspace=0, wspace=0) fig, axs = plt.subplots(2, 2, layout="constrained") for ax in axs.flat: example_plot(ax, hide_labels=True) fig.get_layout_engine().set(w_pad=2 / 72, h_pad=2 / 72, hspace=0, wspace=0) plt.show() 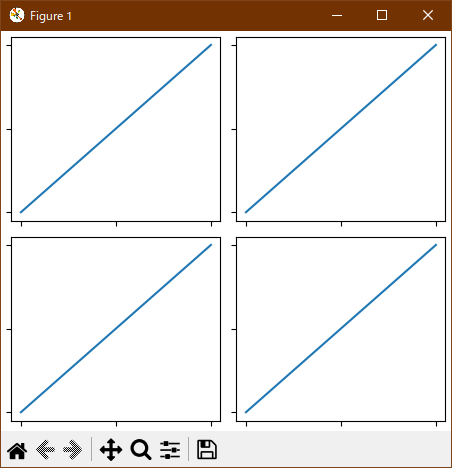

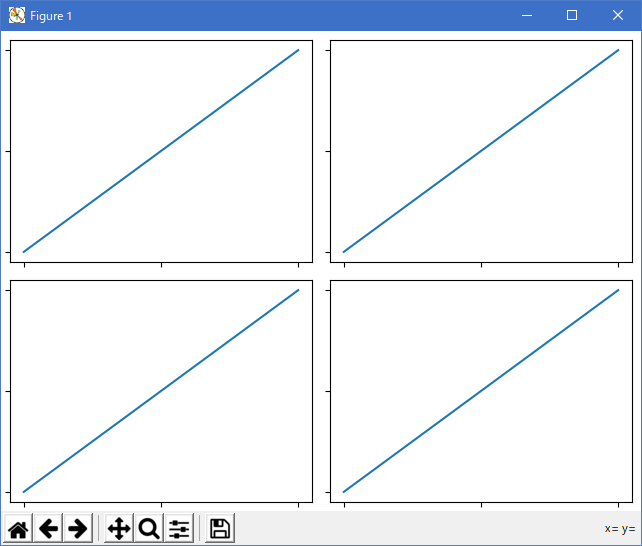
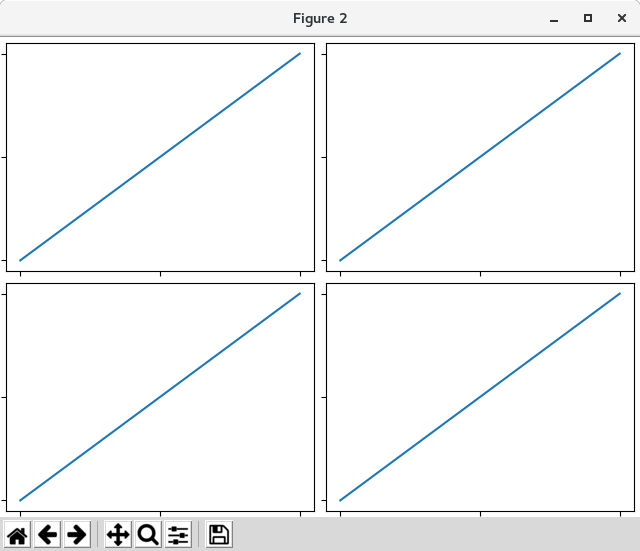
サブプロット間の間隔は、wspaceとhspace によって設定されます。 サブプロットグループ全体のサイズの一部として指定されています。 Figure のサイズが変更された場合、これらのスペースは比例して変化します。 エッジでのスペースが上から変わらないが、サブプロット間のスペースはどのように変化するのかを吹き飛ばすことに注意してください。
# sphinx_gallery_thumbnail_number = 18

#import matplotlib
#matplotlib.use('Qt5Agg')

import warnings

import matplotlib.pyplot as plt
import numpy as np
import matplotlib.colors as mcolors
import matplotlib.gridspec as gridspec

import matplotlib._layoutbox as layoutbox

def example_plot(ax, fontsize=12, nodec=False):
    ax.plot([1, 2])

    ax.locator_params(nbins=3)
    if not nodec:
        ax.set_xlabel('x-label', fontsize=fontsize)
        ax.set_ylabel('y-label', fontsize=fontsize)
        ax.set_title('Title', fontsize=fontsize)
    else:
        ax.set_xticklabels('')
        ax.set_yticklabels('')

arr = np.arange(100).reshape((10, 10))
norm = mcolors.Normalize(vmin=0., vmax=100.)
# see note above: this makes all pcolormesh calls consistent:
pc_kwargs = {'rasterized': True, 'cmap': 'viridis', 'norm': norm}

fig, axs = plt.subplots(2, 2, constrained_layout=True)
for ax in axs.flatten():
    example_plot(ax, nodec=True)
    ax.set_xticklabels('')
    ax.set_yticklabels('')
fig.set_constrained_layout_pads(w_pad=2./72., h_pad=2./72.,
        hspace=0.2, wspace=0.2)

plt.show()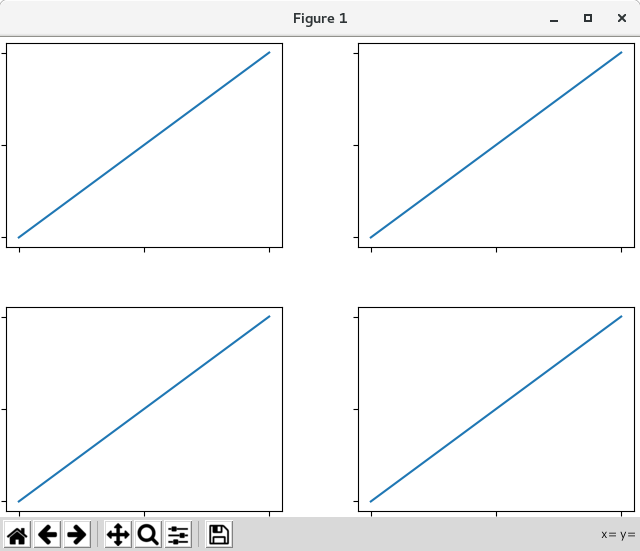

Python 3.11.2 見直しました。上記のコードでは、下記のエラーが発生します。
Traceback (most recent call last):
File "_:\Constrained_Layout_01.py", line 13, in
import matplotlib._layoutbox as layoutbox
ModuleNotFoundError: No module named 'matplotlib._layoutbox'
import matplotlib.pyplot as plt import matplotlib.colors as mcolors import matplotlib.gridspec as gridspec import numpy as np plt.rcParams['savefig.facecolor'] = "0.8" plt.rcParams['figure.figsize'] = 4.5, 4. plt.rcParams['figure.max_open_warning'] = 50 def example_plot(ax, fontsize=12, hide_labels=False): ax.plot([1, 2]) ax.locator_params(nbins=3) if hide_labels: ax.set_xticklabels([]) ax.set_yticklabels([]) else: ax.set_xlabel('x-label', fontsize=fontsize) ax.set_ylabel('y-label', fontsize=fontsize) ax.set_title('Title', fontsize=fontsize) fig, axs = plt.subplots(2, 2, layout="constrained") for ax in axs.flat: example_plot(ax, hide_labels=True) fig.get_layout_engine().set(w_pad=4 / 72, h_pad=4 / 72, hspace=0.2, wspace=0.2) plt.show() 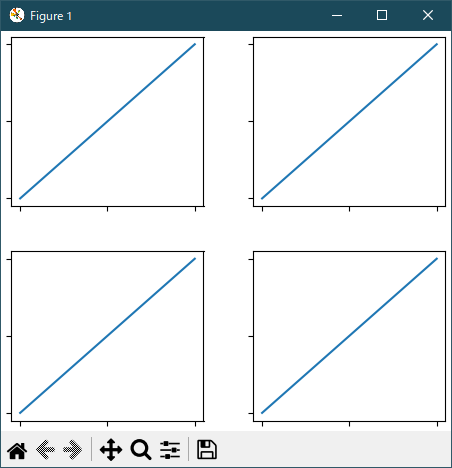
hspace=0.2 および wspace=0.2 に変更します。
import matplotlib.pyplot as plt import matplotlib.colors as mcolors import matplotlib.gridspec as gridspec import numpy as np plt.rcParams['savefig.facecolor'] = "0.8" plt.rcParams['figure.figsize'] = 4.5, 4. plt.rcParams['figure.max_open_warning'] = 50 def example_plot(ax, fontsize=12, hide_labels=False): ax.plot([1, 2]) ax.locator_params(nbins=3) if hide_labels: ax.set_xticklabels([]) ax.set_yticklabels([]) else: ax.set_xlabel('x-label', fontsize=fontsize) ax.set_ylabel('y-label', fontsize=fontsize) ax.set_title('Title', fontsize=fontsize) fig, axs = plt.subplots(2, 3, layout="constrained") for ax in axs.flat: example_plot(ax, hide_labels=True) fig.get_layout_engine().set(w_pad=4 / 72, h_pad=4 / 72, hspace=0.2, wspace=0.2) plt.show() 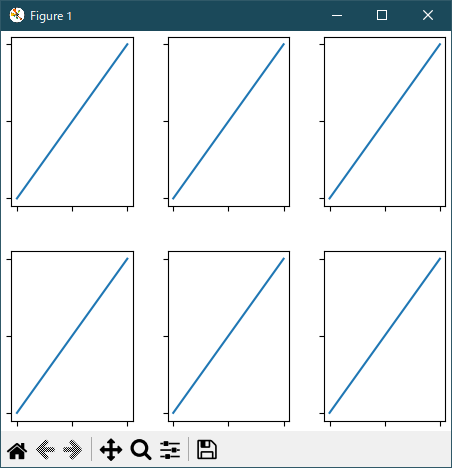
gridspec_kw={'wspace': 0.3, 'hspace': 0.2} を追加します。
import matplotlib.pyplot as plt import matplotlib.colors as mcolors import matplotlib.gridspec as gridspec import numpy as np plt.rcParams['savefig.facecolor'] = "0.8" plt.rcParams['figure.figsize'] = 4.5, 4. plt.rcParams['figure.max_open_warning'] = 50 def example_plot(ax, fontsize=12, hide_labels=False): ax.plot([1, 2]) ax.locator_params(nbins=3) if hide_labels: ax.set_xticklabels([]) ax.set_yticklabels([]) else: ax.set_xlabel('x-label', fontsize=fontsize) ax.set_ylabel('y-label', fontsize=fontsize) ax.set_title('Title', fontsize=fontsize) fig, axs = plt.subplots(2, 2, layout="constrained", gridspec_kw={'wspace': 0.3, 'hspace': 0.2}) for ax in axs.flat: example_plot(ax, hide_labels=True) # this has no effect because the space set in the gridspec trumps the # space set in constrained_layout. fig.get_layout_engine().set(w_pad=4 / 72, h_pad=4 / 72, hspace=0.0, wspace=0.0) plt.show() 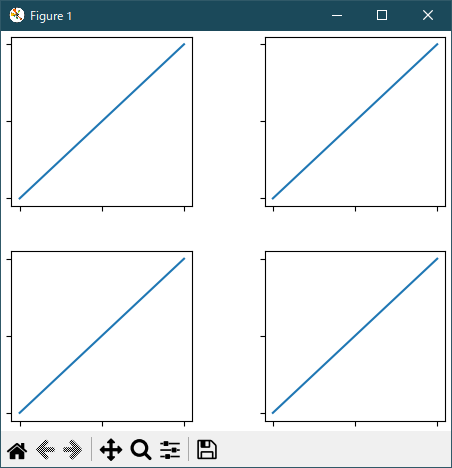
- Spacing with colorbars
カラーバーは w_pad 値と h_pad 値を引き続き使用します。 しかし、それらは他のサブプロットとは別に wspaceとhsapce になります。 カラーバーコールでは、ここでパッド kwarg を使用することに注意してください。 デフォルトでは、それが接続されている軸のサイズの 0.02 になります。
# sphinx_gallery_thumbnail_number = 18

#import matplotlib
#matplotlib.use('Qt5Agg')

import warnings

import matplotlib.pyplot as plt
import numpy as np
import matplotlib.colors as mcolors
import matplotlib.gridspec as gridspec

import matplotlib._layoutbox as layoutbox

def example_plot(ax, fontsize=12, nodec=False):
    ax.plot([1, 2])

    ax.locator_params(nbins=3)
    if not nodec:
        ax.set_xlabel('x-label', fontsize=fontsize)
        ax.set_ylabel('y-label', fontsize=fontsize)
        ax.set_title('Title', fontsize=fontsize)
    else:
        ax.set_xticklabels('')
        ax.set_yticklabels('')

arr = np.arange(100).reshape((10, 10))
norm = mcolors.Normalize(vmin=0., vmax=100.)
# see note above: this makes all pcolormesh calls consistent:
pc_kwargs = {'rasterized': True, 'cmap': 'viridis', 'norm': norm}

fig, axs = plt.subplots(2, 2, constrained_layout=True)
for ax in axs.flatten():
    # for ax in axs.flatten():
    im = ax.pcolormesh(arr, **pc_kwargs)
    pc = ax.pcolormesh(arr, **pc_kwargs)
    fig.colorbar(im, ax=ax, shrink=0.6, pad=0)
    ax.set_xticklabels('')
    ax.set_yticklabels('')

fig.set_constrained_layout_pads(w_pad=2./72., h_pad=2./72.,
        hspace=0.2, wspace=0.2)

plt.show()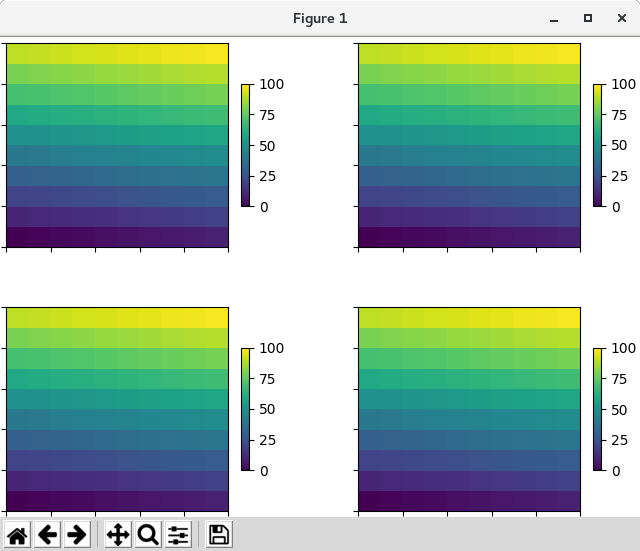
Python 3.11.2 見直しました。上記のコードでは、下記のエラーが発生します。
Traceback (most recent call last):
File "_:\Constrained_Layout_01.py", line 13, in
import matplotlib._layoutbox as layoutbox
ModuleNotFoundError: No module named 'matplotlib._layoutbox'
import matplotlib.pyplot as plt import matplotlib.colors as mcolors import matplotlib.gridspec as gridspec import numpy as np plt.rcParams['savefig.facecolor'] = "0.8" plt.rcParams['figure.figsize'] = 4.5, 4. plt.rcParams['figure.max_open_warning'] = 50 def example_plot(ax, fontsize=12, hide_labels=False): ax.plot([1, 2]) ax.locator_params(nbins=3) if hide_labels: ax.set_xticklabels([]) ax.set_yticklabels([]) else: ax.set_xlabel('x-label', fontsize=fontsize) ax.set_ylabel('y-label', fontsize=fontsize) ax.set_title('Title', fontsize=fontsize) arr = np.arange(100).reshape((10, 10)) norm = mcolors.Normalize(vmin=0., vmax=100.) # see note above: this makes all pcolormesh calls consistent: pc_kwargs = {'rasterized': True, 'cmap': 'viridis', 'norm': norm} fig, axs = plt.subplots(2, 2, layout="constrained") pads = [0, 0.05, 0.1, 0.2] for pad, ax in zip(pads, axs.flat): pc = ax.pcolormesh(arr, **pc_kwargs) fig.colorbar(pc, ax=ax, shrink=0.6, pad=pad) ax.set_xticklabels([]) ax.set_yticklabels([]) ax.set_title(f'pad: {pad}') fig.get_layout_engine().set(w_pad=2 / 72, h_pad=2 / 72, hspace=0.2, wspace=0.2) plt.show() 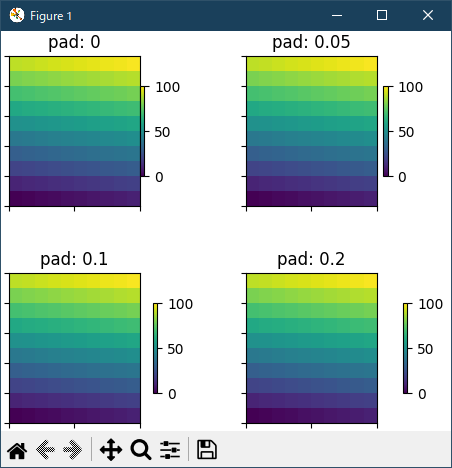
上記の例では、カラーバーはプロットに対して 2 ポイント以上に近づくことはありませんが、少し離れたところに置いておきたい場合は、pad の値をゼロ以外に指定することができます。
# sphinx_gallery_thumbnail_number = 18

#import matplotlib
#matplotlib.use('Qt5Agg')

import warnings

import matplotlib.pyplot as plt
import numpy as np
import matplotlib.colors as mcolors
import matplotlib.gridspec as gridspec

import matplotlib._layoutbox as layoutbox

def example_plot(ax, fontsize=12, nodec=False):
    ax.plot([1, 2])

    ax.locator_params(nbins=3)
    if not nodec:
        ax.set_xlabel('x-label', fontsize=fontsize)
        ax.set_ylabel('y-label', fontsize=fontsize)
        ax.set_title('Title', fontsize=fontsize)
    else:
        ax.set_xticklabels('')
        ax.set_yticklabels('')

arr = np.arange(100).reshape((10, 10))
norm = mcolors.Normalize(vmin=0., vmax=100.)
# see note above: this makes all pcolormesh calls consistent:
pc_kwargs = {'rasterized': True, 'cmap': 'viridis', 'norm': norm}

fig, axs = plt.subplots(2, 2, constrained_layout=True)
for ax in axs.flatten():
    pc = ax.pcolormesh(arr, **pc_kwargs)
    fig.colorbar(pc, ax=ax, shrink=0.6, pad=0.05)
    ax.set_xticklabels('')
    ax.set_yticklabels('')
fig.set_constrained_layout_pads(w_pad=2./72., h_pad=2./72.,
        hspace=0.2, wspace=0.2)

plt.show()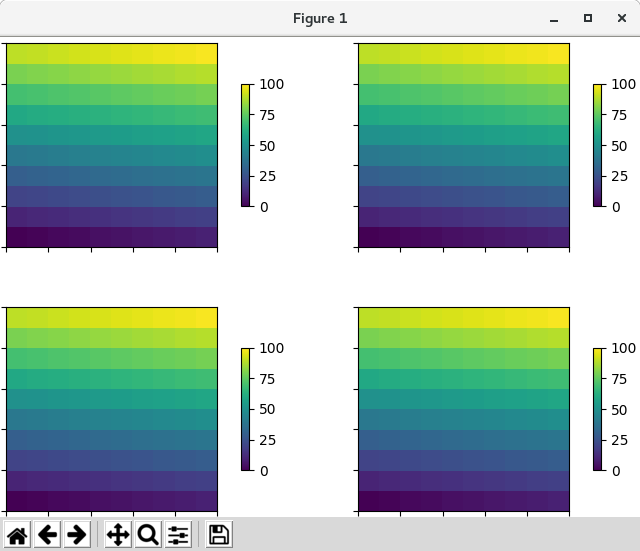
見直し内容は、省略します。
- rcParams
スクリプトまたは matplotlibrc ファイルに設定できる5つの rcParams があります。 それらはすべて接頭辞 figure.constrained_layout を持っています:
- use:constrained_layoutを使用するかどうかを指定します。 デフォルトはFalseです。
- w_pad、h_pad:軸オブジェクトの周りを埋める。
インチを表す浮動小数点。 デフォルトは3./72です。 インチ(3ポンド)
- wspace、hspace:サブプロットグループ間の間隔。
分離されるサブプロットの幅の一部を表すFloat。 デフォルトは 0.02 です。
# sphinx_gallery_thumbnail_number = 18

#import matplotlib
#matplotlib.use('Qt5Agg')

import warnings

import matplotlib.pyplot as plt
import numpy as np
import matplotlib.colors as mcolors
import matplotlib.gridspec as gridspec

import matplotlib._layoutbox as layoutbox

def example_plot(ax, fontsize=12, nodec=False):
    ax.plot([1, 2])

    ax.locator_params(nbins=3)
    if not nodec:
        ax.set_xlabel('x-label', fontsize=fontsize)
        ax.set_ylabel('y-label', fontsize=fontsize)
        ax.set_title('Title', fontsize=fontsize)
    else:
        ax.set_xticklabels('')
        ax.set_yticklabels('')

plt.rcParams['figure.constrained_layout.use'] = True
fig, axs = plt.subplots(2, 2, figsize=(3, 3))
for ax in axs.flatten():
    example_plot(ax)

plt.show()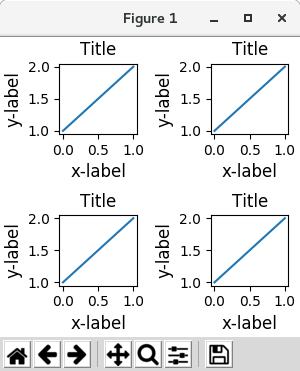
Python 3.11.2 見直しました。上記のコードでは、下記のエラーが発生します。
Traceback (most recent call last):
File "_:\Constrained_Layout_01.py", line 13, in
import matplotlib._layoutbox as layoutbox
ModuleNotFoundError: No module named 'matplotlib._layoutbox'
import matplotlib.pyplot as plt import matplotlib.colors as mcolors import matplotlib.gridspec as gridspec import numpy as np plt.rcParams['savefig.facecolor'] = "0.8" plt.rcParams['figure.figsize'] = 4.5, 4. plt.rcParams['figure.max_open_warning'] = 50 def example_plot(ax, fontsize=12, hide_labels=False): ax.plot([1, 2]) ax.locator_params(nbins=3) if hide_labels: ax.set_xticklabels([]) ax.set_yticklabels([]) else: ax.set_xlabel('x-label', fontsize=fontsize) ax.set_ylabel('y-label', fontsize=fontsize) ax.set_title('Title', fontsize=fontsize) plt.rcParams['figure.constrained_layout.use'] = True fig, axs = plt.subplots(2, 2, figsize=(3, 3)) for ax in axs.flat: example_plot(ax) plt.show() 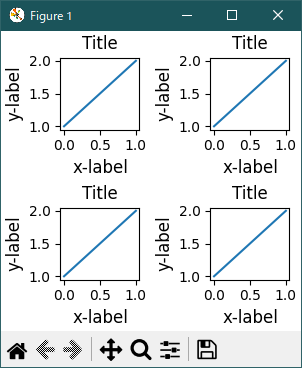
- Use with GridSpec
constrained_layout は、subplots() または GridSpec() および add_subplot() で使用するためのものです。
constrained_layout = Trueになることに注意してください。
# sphinx_gallery_thumbnail_number = 18

#import matplotlib
#matplotlib.use('Qt5Agg')

import warnings

import matplotlib.pyplot as plt
import numpy as np
import matplotlib.colors as mcolors
import matplotlib.gridspec as gridspec

import matplotlib._layoutbox as layoutbox

def example_plot(ax, fontsize=12, nodec=False):
    ax.plot([1, 2])

    ax.locator_params(nbins=3)
    if not nodec:
        ax.set_xlabel('x-label', fontsize=fontsize)
        ax.set_ylabel('y-label', fontsize=fontsize)
        ax.set_title('Title', fontsize=fontsize)
    else:
        ax.set_xticklabels('')
        ax.set_yticklabels('')

fig = plt.figure()

gs1 = gridspec.GridSpec(2, 1, figure=fig)
ax1 = fig.add_subplot(gs1[0])
ax2 = fig.add_subplot(gs1[1])

example_plot(ax1)
example_plot(ax2)

plt.show()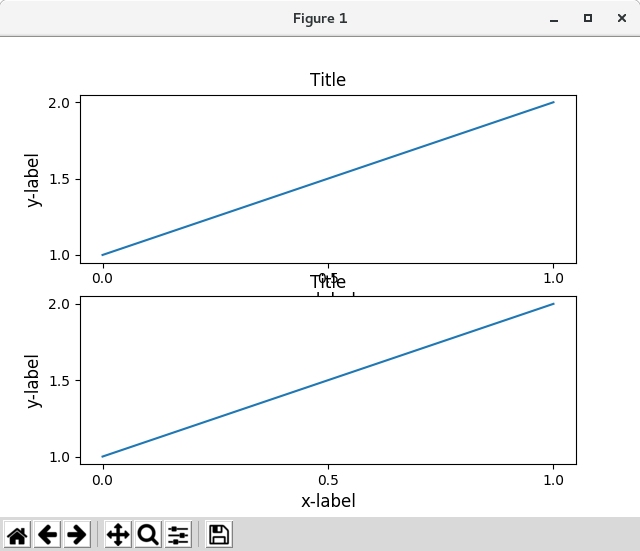
Python 3.11.2 見直しました。上記のコードでは、下記のエラーが発生します。
Traceback (most recent call last):
File "_:\Constrained_Layout_01.py", line 13, in
import matplotlib._layoutbox as layoutbox
ModuleNotFoundError: No module named 'matplotlib._layoutbox'
import matplotlib.pyplot as plt import matplotlib.colors as mcolors import matplotlib.gridspec as gridspec import numpy as np plt.rcParams['savefig.facecolor'] = "0.8" plt.rcParams['figure.figsize'] = 4.5, 4. plt.rcParams['figure.max_open_warning'] = 50 def example_plot(ax, fontsize=12, hide_labels=False): ax.plot([1, 2]) ax.locator_params(nbins=3) if hide_labels: ax.set_xticklabels([]) ax.set_yticklabels([]) else: ax.set_xlabel('x-label', fontsize=fontsize) ax.set_ylabel('y-label', fontsize=fontsize) ax.set_title('Title', fontsize=fontsize) plt.rcParams['figure.constrained_layout.use'] = False fig = plt.figure(layout="constrained") gs1 = gridspec.GridSpec(2, 1, figure=fig) ax1 = fig.add_subplot(gs1[0]) ax2 = fig.add_subplot(gs1[1]) example_plot(ax1) example_plot(ax2) plt.show() 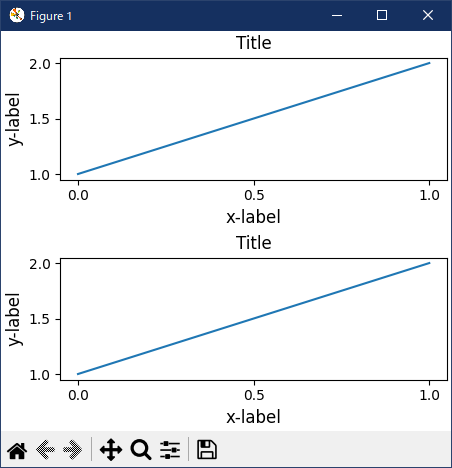
より複雑なグリッドスペックレイアウトが可能です。 ここでは、便利な関数 add_gridspecとsubgridspec
# sphinx_gallery_thumbnail_number = 18

#import matplotlib
#matplotlib.use('Qt5Agg')

import warnings

import matplotlib.pyplot as plt
import numpy as np
import matplotlib.colors as mcolors
import matplotlib.gridspec as gridspec

import matplotlib._layoutbox as layoutbox

def example_plot(ax, fontsize=12, nodec=False):
    ax.plot([1, 2])

    ax.locator_params(nbins=3)
    if not nodec:
        ax.set_xlabel('x-label', fontsize=fontsize)
        ax.set_ylabel('y-label', fontsize=fontsize)
        ax.set_title('Title', fontsize=fontsize)
    else:
        ax.set_xticklabels('')
        ax.set_yticklabels('')

# fig = plt.figure()
fig = plt.figure(constrained_layout=True)

gs0 = fig.add_gridspec(1, 2)

gs1 = gs0[0].subgridspec(2, 1)
ax1 = fig.add_subplot(gs1[0])
ax2 = fig.add_subplot(gs1[1])

example_plot(ax1)
example_plot(ax2)

gs2 = gs0[1].subgridspec(3, 1)

for ss in gs2:
    ax = fig.add_subplot(ss)
    example_plot(ax)
    ax.set_title("")
    ax.set_xlabel("")

ax.set_xlabel("x-label", fontsize=12)

plt.show()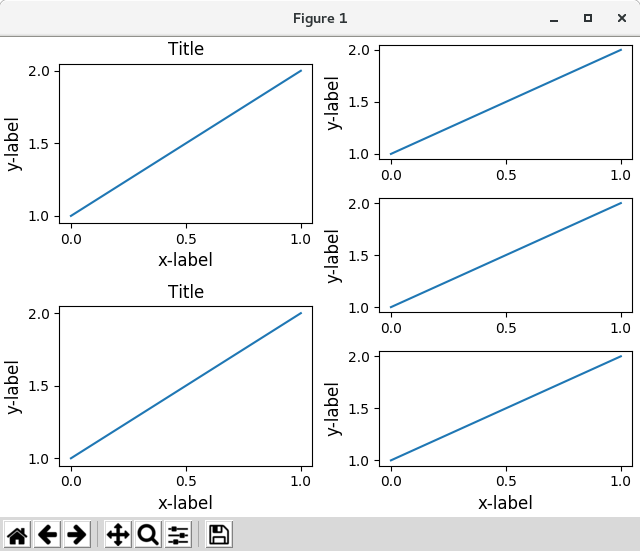
Python 3.11.2 見直しました。上記のコードでは、下記のエラーが発生します。
Traceback (most recent call last):
File "_:\Constrained_Layout_01.py", line 13, in
import matplotlib._layoutbox as layoutbox
ModuleNotFoundError: No module named 'matplotlib._layoutbox'
import matplotlib.pyplot as plt import matplotlib.colors as mcolors import matplotlib.gridspec as gridspec import numpy as np plt.rcParams['savefig.facecolor'] = "0.8" plt.rcParams['figure.figsize'] = 4.5, 4. plt.rcParams['figure.max_open_warning'] = 50 def example_plot(ax, fontsize=12, hide_labels=False): ax.plot([1, 2]) ax.locator_params(nbins=3) if hide_labels: ax.set_xticklabels([]) ax.set_yticklabels([]) else: ax.set_xlabel('x-label', fontsize=fontsize) ax.set_ylabel('y-label', fontsize=fontsize) ax.set_title('Title', fontsize=fontsize) fig = plt.figure(layout="constrained") gs0 = fig.add_gridspec(1, 2) gs1 = gs0[0].subgridspec(2, 1) ax1 = fig.add_subplot(gs1[0]) ax2 = fig.add_subplot(gs1[1]) example_plot(ax1) example_plot(ax2) gs2 = gs0[1].subgridspec(3, 1) for ss in gs2: ax = fig.add_subplot(ss) example_plot(ax) ax.set_title("") ax.set_xlabel("") ax.set_xlabel("x-label", fontsize=12) plt.show() 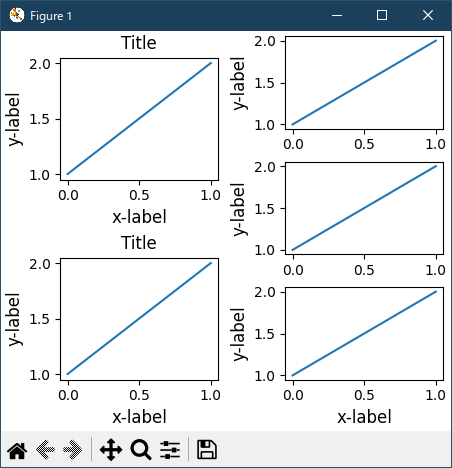
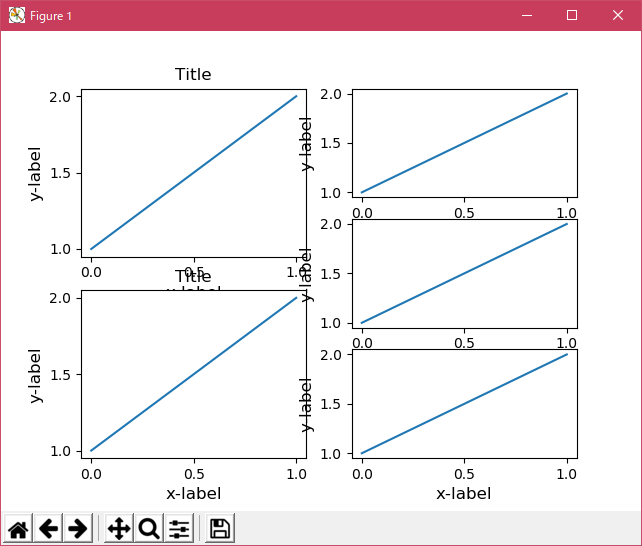
上の例では、左と列は同じ垂直範囲を持たないことに注意してください。 2 つのグリッドの上端と下端を整列させたい場合は、同じグリッド・スペックにする必要があります。
# sphinx_gallery_thumbnail_number = 18

#import matplotlib
#matplotlib.use('Qt5Agg')

import warnings

import matplotlib.pyplot as plt
import numpy as np
import matplotlib.colors as mcolors
import matplotlib.gridspec as gridspec

import matplotlib._layoutbox as layoutbox

def example_plot(ax, fontsize=12, nodec=False):
    ax.plot([1, 2])

    ax.locator_params(nbins=3)
    if not nodec:
        ax.set_xlabel('x-label', fontsize=fontsize)
        ax.set_ylabel('y-label', fontsize=fontsize)
        ax.set_title('Title', fontsize=fontsize)
    else:
        ax.set_xticklabels('')
        ax.set_yticklabels('')

# fig = plt.figure()
fig = plt.figure(constrained_layout=True)

# fig = plt.figure()

gs0 = fig.add_gridspec(6, 2)

ax1 = fig.add_subplot(gs0[:3, 0])
ax2 = fig.add_subplot(gs0[3:, 0])

example_plot(ax1)
example_plot(ax2)

ax = fig.add_subplot(gs0[0:2, 1])
example_plot(ax)
ax = fig.add_subplot(gs0[2:4, 1])
example_plot(ax)
ax = fig.add_subplot(gs0[4:, 1])
example_plot(ax)

plt.show()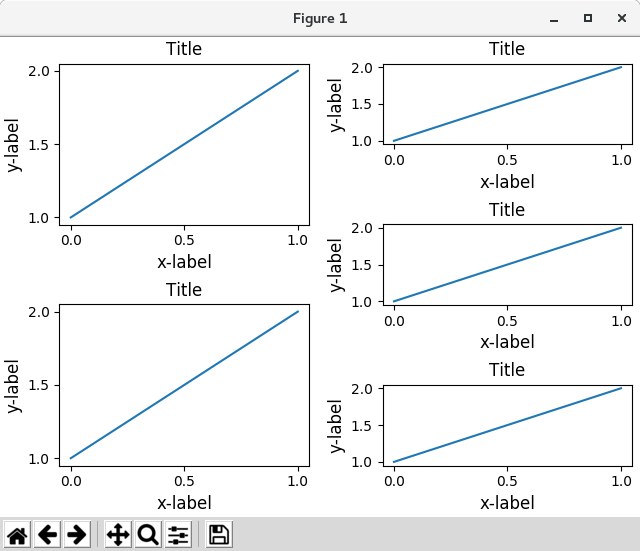
Python 3.11.2 見直しました。上記のコードでは、下記のエラーが発生します。
Traceback (most recent call last):
File "_:\Constrained_Layout_01.py", line 13, in
import matplotlib._layoutbox as layoutbox
ModuleNotFoundError: No module named 'matplotlib._layoutbox'
import matplotlib.pyplot as plt import matplotlib.colors as mcolors import matplotlib.gridspec as gridspec import numpy as np plt.rcParams['savefig.facecolor'] = "0.8" plt.rcParams['figure.figsize'] = 4.5, 4. plt.rcParams['figure.max_open_warning'] = 50 def example_plot(ax, fontsize=12, hide_labels=False): ax.plot([1, 2]) ax.locator_params(nbins=3) if hide_labels: ax.set_xticklabels([]) ax.set_yticklabels([]) else: ax.set_xlabel('x-label', fontsize=fontsize) ax.set_ylabel('y-label', fontsize=fontsize) ax.set_title('Title', fontsize=fontsize) fig = plt.figure(figsize=(4, 6), layout="constrained") gs0 = fig.add_gridspec(6, 2) ax1 = fig.add_subplot(gs0[:3, 0]) ax2 = fig.add_subplot(gs0[3:, 0]) example_plot(ax1) example_plot(ax2) ax = fig.add_subplot(gs0[0:2, 1]) example_plot(ax, hide_labels=True) ax = fig.add_subplot(gs0[2:4, 1]) example_plot(ax, hide_labels=True) ax = fig.add_subplot(gs0[4:, 1]) example_plot(ax, hide_labels=True) fig.suptitle('Overlapping Gridspecs') plt.show() 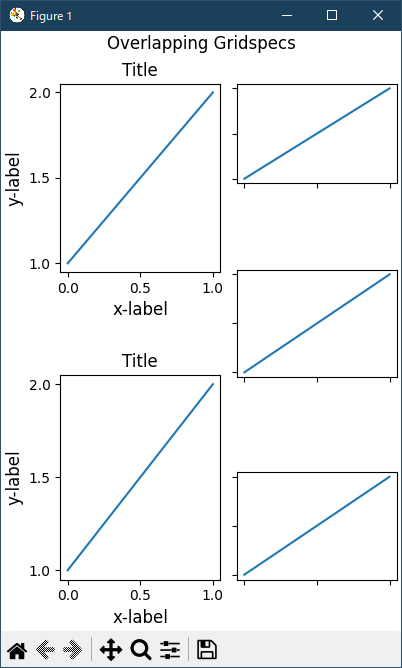
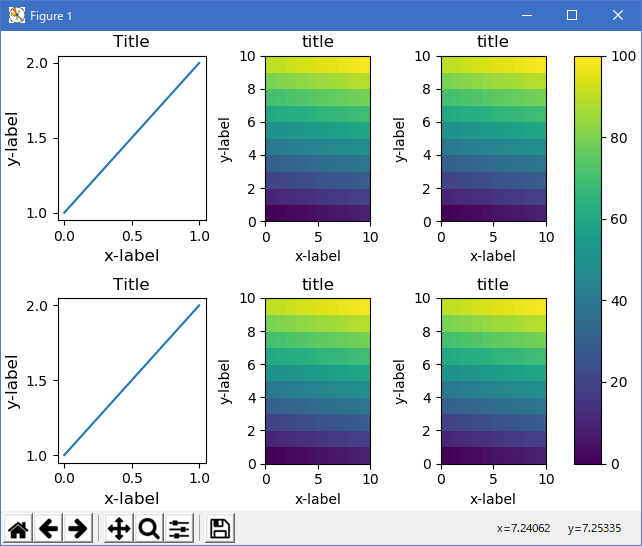
この例では、2 つのグリッドスペックを使用して、カラーバーが pcolors の 1 つのセットにのみ関連するようにしています。 このため、左の列が 2 つの右の列よりも広いことに注意してください。 もちろん、サブプロットを同じサイズにしたい場合は、必要なのは 1 つの gridspec
# sphinx_gallery_thumbnail_number = 18

#import matplotlib
#matplotlib.use('Qt5Agg')

import warnings

import matplotlib.pyplot as plt
import numpy as np
import matplotlib.colors as mcolors
import matplotlib.gridspec as gridspec

import matplotlib._layoutbox as layoutbox

def example_plot(ax, fontsize=12, nodec=False):
    ax.plot([1, 2])

    ax.locator_params(nbins=3)
    if not nodec:
        ax.set_xlabel('x-label', fontsize=fontsize)
        ax.set_ylabel('y-label', fontsize=fontsize)
        ax.set_title('Title', fontsize=fontsize)
    else:
        ax.set_xticklabels('')
        ax.set_yticklabels('')

def docomplicated(suptitle=None):
    arr = np.arange(100).reshape((10, 10))
    norm = mcolors.Normalize(vmin=0., vmax=100.)
    # see note above: this makes all pcolormesh calls consistent:
    pc_kwargs = {'rasterized': True, 'cmap': 'viridis', 'norm': norm}

    # fig = plt.figure()
    fig = plt.figure(constrained_layout=True)
    gs0 = fig.add_gridspec(1, 2, figure=fig, width_ratios=[1., 2.])
    gsl = gs0[0].subgridspec(2, 1)
    gsr = gs0[1].subgridspec(2, 2)

    for gs in gsl:
        ax = fig.add_subplot(gs)
        example_plot(ax)
    axs = []
    for gs in gsr:
        ax = fig.add_subplot(gs)
        pcm = ax.pcolormesh(arr, **pc_kwargs)
        ax.set_xlabel('x-label')
        ax.set_ylabel('y-label')
        ax.set_title('title')

        axs += [ax]
    fig.colorbar(pcm, ax=axs)
    if suptitle is not None:
        fig.suptitle(suptitle)

docomplicated()

plt.show()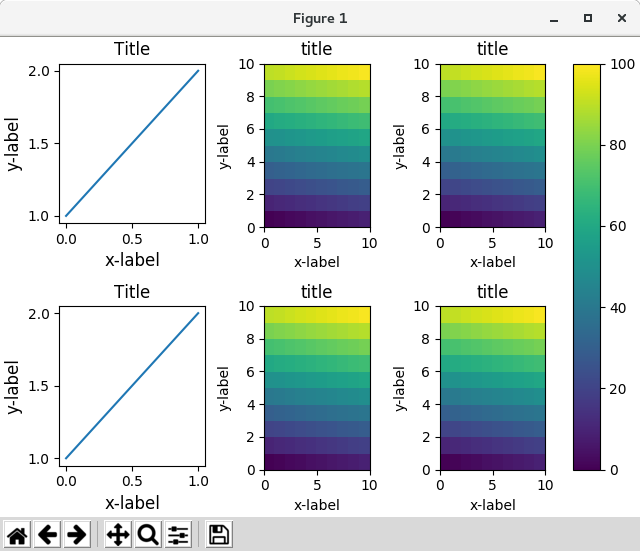
Python 3.11.2 見直しました。上記のコードでは、下記のエラーが発生します。
Traceback (most recent call last):
File "_:\Constrained_Layout_01.py", line 13, in
import matplotlib._layoutbox as layoutbox
ModuleNotFoundError: No module named 'matplotlib._layoutbox'
import matplotlib.pyplot as plt import matplotlib.colors as mcolors import matplotlib.gridspec as gridspec import numpy as np plt.rcParams['savefig.facecolor'] = "0.8" plt.rcParams['figure.figsize'] = 4.5, 4. plt.rcParams['figure.max_open_warning'] = 50 def example_plot(ax, fontsize=12, hide_labels=False): ax.plot([1, 2]) ax.locator_params(nbins=3) if hide_labels: ax.set_xticklabels([]) ax.set_yticklabels([]) else: ax.set_xlabel('x-label', fontsize=fontsize) ax.set_ylabel('y-label', fontsize=fontsize) ax.set_title('Title', fontsize=fontsize) arr = np.arange(100).reshape((10, 10)) norm = mcolors.Normalize(vmin=0., vmax=100.) # see note above: this makes all pcolormesh calls consistent: pc_kwargs = {'rasterized': True, 'cmap': 'viridis', 'norm': norm} fig = plt.figure(layout="constrained") gs0 = fig.add_gridspec(1, 2, figure=fig, width_ratios=[1, 2]) gs_left = gs0[0].subgridspec(2, 1) gs_right = gs0[1].subgridspec(2, 2) for gs in gs_left: ax = fig.add_subplot(gs) example_plot(ax) axs = [] for gs in gs_right: ax = fig.add_subplot(gs) pcm = ax.pcolormesh(arr, **pc_kwargs) ax.set_xlabel('x-label') ax.set_ylabel('y-label') ax.set_title('title') axs += [ax] fig.suptitle('Nested plots using subgridspec') fig.colorbar(pcm, ax=axs) plt.show() 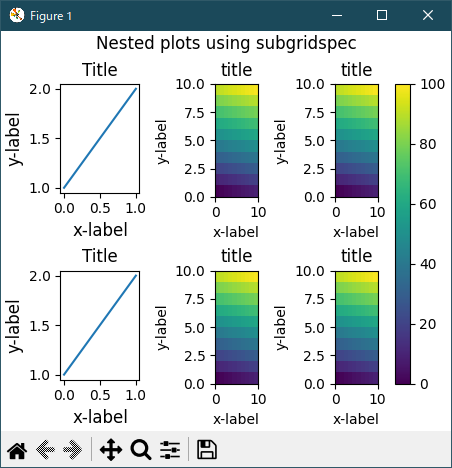
更に、追加のサンプルです。
import matplotlib.pyplot as plt import matplotlib.colors as mcolors import matplotlib.gridspec as gridspec import numpy as np plt.rcParams['savefig.facecolor'] = "0.8" plt.rcParams['figure.figsize'] = 4.5, 4. plt.rcParams['figure.max_open_warning'] = 50 def example_plot(ax, fontsize=12, hide_labels=False): ax.plot([1, 2]) ax.locator_params(nbins=3) if hide_labels: ax.set_xticklabels([]) ax.set_yticklabels([]) else: ax.set_xlabel('x-label', fontsize=fontsize) ax.set_ylabel('y-label', fontsize=fontsize) ax.set_title('Title', fontsize=fontsize) arr = np.arange(100).reshape((10, 10)) norm = mcolors.Normalize(vmin=0., vmax=100.) # see note above: this makes all pcolormesh calls consistent: pc_kwargs = {'rasterized': True, 'cmap': 'viridis', 'norm': norm} fig = plt.figure(layout="constrained") gs0 = fig.add_gridspec(1, 2, figure=fig, width_ratios=[1, 2]) gs_left = gs0[0].subgridspec(2, 1) gs_right = gs0[1].subgridspec(2, 2) for gs in gs_left: ax = fig.add_subplot(gs) example_plot(ax) axs = [] for gs in gs_right: ax = fig.add_subplot(gs) pcm = ax.pcolormesh(arr, **pc_kwargs) ax.set_xlabel('x-label') ax.set_ylabel('y-label') ax.set_title('title') axs += [ax] fig.suptitle('Nested plots using subgridspec') fig.colorbar(pcm, ax=axs) plt.show() 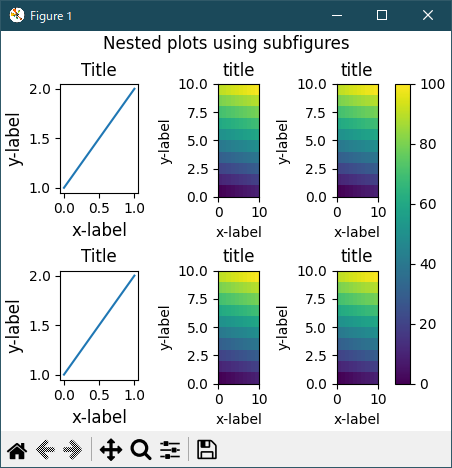
- Manually setting axes positions
手動で軸の位置を設定するのは良い理由があります。 set_position を手動で呼び出すと軸が設定され、constrained_layout はそれ以上影響を与えません。 ( constrained_layout は移動された軸のスペースをまだ残していることに注意してください)。
# sphinx_gallery_thumbnail_number = 18

#import matplotlib
#matplotlib.use('Qt5Agg')

import warnings

import matplotlib.pyplot as plt
import numpy as np
import matplotlib.colors as mcolors
import matplotlib.gridspec as gridspec

import matplotlib._layoutbox as layoutbox

def example_plot(ax, fontsize=12, nodec=False):
    ax.plot([1, 2])

    ax.locator_params(nbins=3)
    if not nodec:
        ax.set_xlabel('x-label', fontsize=fontsize)
        ax.set_ylabel('y-label', fontsize=fontsize)
        ax.set_title('Title', fontsize=fontsize)
    else:
        ax.set_xticklabels('')
        ax.set_yticklabels('')

# fig = plt.figure()
# fig = plt.figure(constrained_layout=True)
# fig, axs = plt.subplots(1, 2)
fig, axs = plt.subplots(1, 2, constrained_layout=True)
example_plot(axs[0], fontsize=12)
axs[1].set_position([0.2, 0.2, 0.4, 0.4])

plt.show()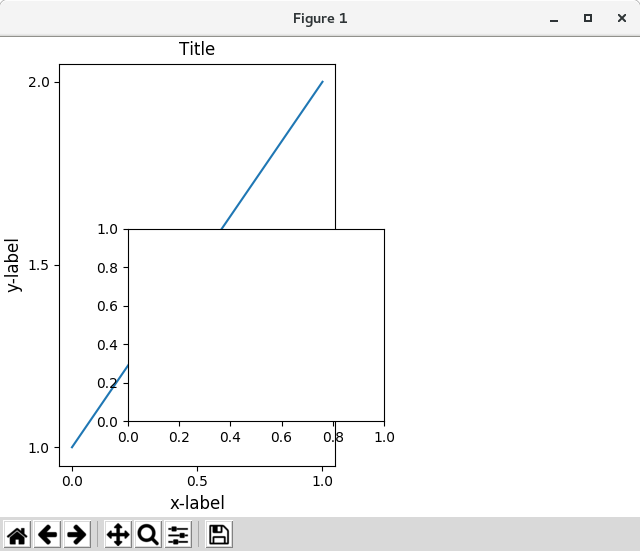
Python 3.11.2 見直しました。上記のコードでは、下記のエラーが発生します。
Traceback (most recent call last):
File "_:\Constrained_Layout_01.py", line 13, in
import matplotlib._layoutbox as layoutbox
ModuleNotFoundError: No module named 'matplotlib._layoutbox'
import matplotlib.pyplot as plt import matplotlib.colors as mcolors import matplotlib.gridspec as gridspec import numpy as np plt.rcParams['savefig.facecolor'] = "0.8" plt.rcParams['figure.figsize'] = 4.5, 4. plt.rcParams['figure.max_open_warning'] = 50 def example_plot(ax, fontsize=12, hide_labels=False): ax.plot([1, 2]) ax.locator_params(nbins=3) if hide_labels: ax.set_xticklabels([]) ax.set_yticklabels([]) else: ax.set_xlabel('x-label', fontsize=fontsize) ax.set_ylabel('y-label', fontsize=fontsize) ax.set_title('Title', fontsize=fontsize) arr = np.arange(100).reshape((10, 10)) norm = mcolors.Normalize(vmin=0., vmax=100.) # see note above: this makes all pcolormesh calls consistent: pc_kwargs = {'rasterized': True, 'cmap': 'viridis', 'norm': norm} fig, axs = plt.subplots(1, 2, layout="constrained") example_plot(axs[0], fontsize=12) axs[1].set_position([0.2, 0.2, 0.4, 0.4]) plt.show() 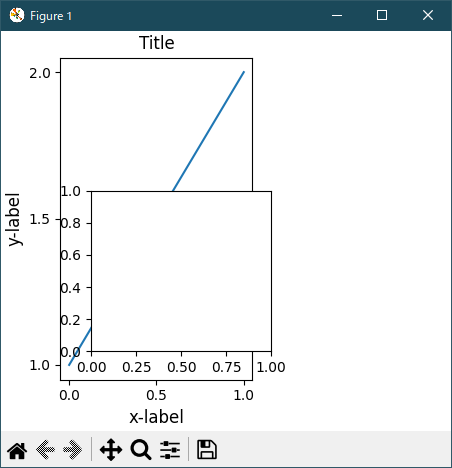
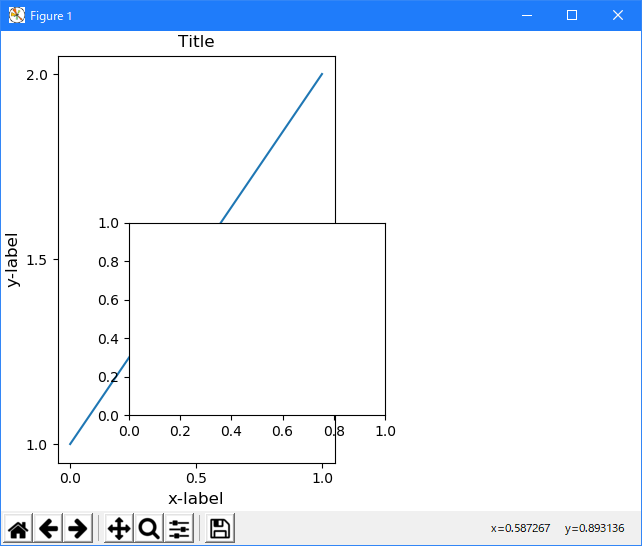
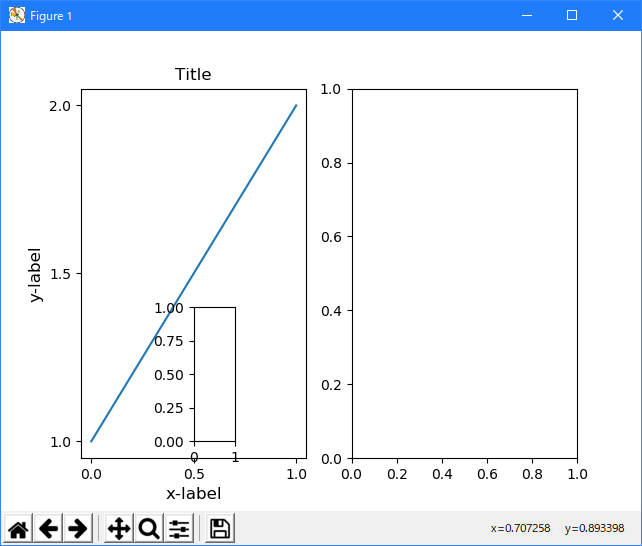
データ空間にインセット軸が必要な場合は、fig.execute_constrained_layout() コールを使用して手動でレイアウトを実行する必要があります。 挿入図が適切に配置されます。 しかし、Figure のサイズがその後変更されると、適切な位置に配置されません。 同様に、図が別のバックエンドに印刷される場合、バックエンドのフォントの表示方法の違いが小さいため、位置のわずかな変更がある可能性があります。
# sphinx_gallery_thumbnail_number = 18

#import matplotlib
#matplotlib.use('Qt5Agg')

import warnings

import matplotlib.pyplot as plt
import numpy as np
import matplotlib.colors as mcolors
import matplotlib.gridspec as gridspec

import matplotlib._layoutbox as layoutbox
from matplotlib.transforms import Bbox

def example_plot(ax, fontsize=12, nodec=False):
    ax.plot([1, 2])

    ax.locator_params(nbins=3)
    if not nodec:
        ax.set_xlabel('x-label', fontsize=fontsize)
        ax.set_ylabel('y-label', fontsize=fontsize)
        ax.set_title('Title', fontsize=fontsize)
    else:
        ax.set_xticklabels('')
        ax.set_yticklabels('')

# fig = plt.figure()
# fig = plt.figure(constrained_layout=True)


fig, axs = plt.subplots(1, 2)
example_plot(axs[0], fontsize=12)
fig.execute_constrained_layout()
# put into data-space:
bb_data_ax2 = Bbox.from_bounds(0.5, 1., 0.2, 0.4)
disp_coords = axs[0].transData.transform(bb_data_ax2)
fig_coords_ax2 = fig.transFigure.inverted().transform(disp_coords)
bb_ax2 = Bbox(fig_coords_ax2)
ax2 = fig.add_axes(bb_ax2)

plt.show()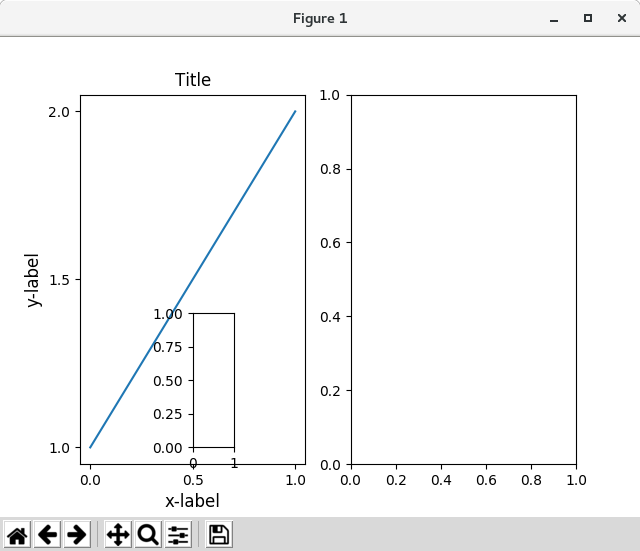
Python 3.11.2 見直しました。上記のコードでは、下記のエラーが発生します。
Traceback (most recent call last):
File "_:\Constrained_Layout_01.py", line 13, in
import matplotlib._layoutbox as layoutbox
ModuleNotFoundError: No module named 'matplotlib._layoutbox'
対応事例は、ありません。
- Limitations
- Incompatible functions
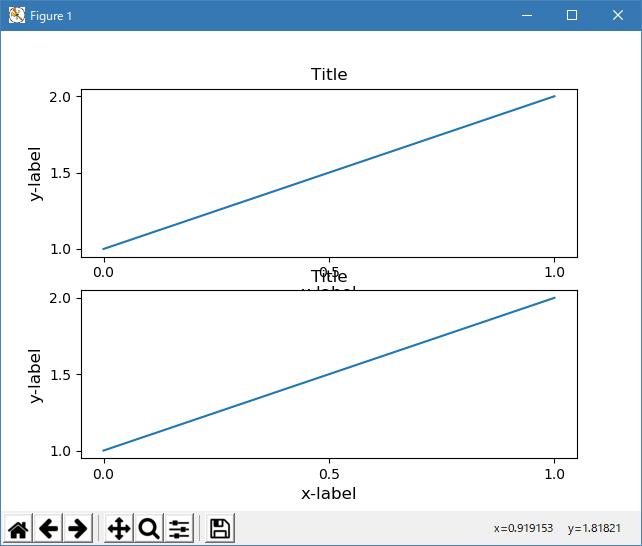
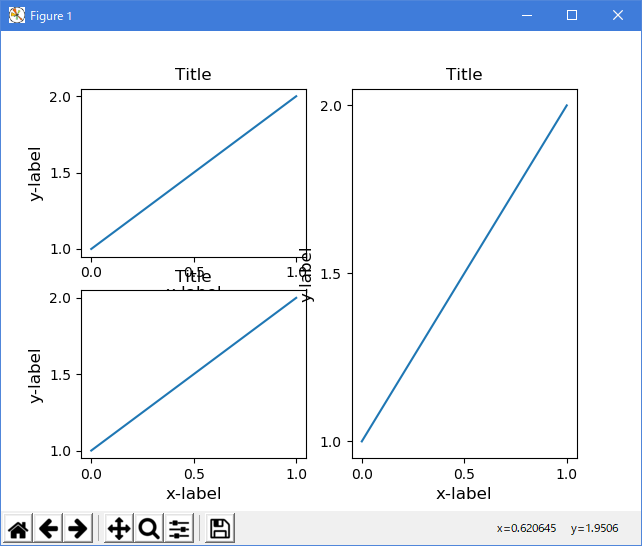
constrained_layout は、subplot コマンドで作成されたサブプロットでは機能しません。 その理由は、これらのコマンドのそれぞれが個別の GridSpec インスタンスを作成し、constrained_layout がレイアウトを実行するためにネストされたグリッドスペックを使用するためです。 だから、以下は素晴らしいレイアウトを生成することができません:
# sphinx_gallery_thumbnail_number = 18

#import matplotlib
#matplotlib.use('Qt5Agg')

import warnings

import matplotlib.pyplot as plt
import numpy as np
import matplotlib.colors as mcolors
import matplotlib.gridspec as gridspec

import matplotlib._layoutbox as layoutbox

def example_plot(ax, fontsize=12, nodec=False):
    ax.plot([1, 2])

    ax.locator_params(nbins=3)
    if not nodec:
        ax.set_xlabel('x-label', fontsize=fontsize)
        ax.set_ylabel('y-label', fontsize=fontsize)
        ax.set_title('Title', fontsize=fontsize)
    else:
        ax.set_xticklabels('')
        ax.set_yticklabels('')

# fig = plt.figure()
# fig = plt.figure(constrained_layout=True)

fig = plt.figure()

ax1 = plt.subplot(221)
ax2 = plt.subplot(223)
ax3 = plt.subplot(122)

example_plot(ax1)
example_plot(ax2)
example_plot(ax3)

plt.show()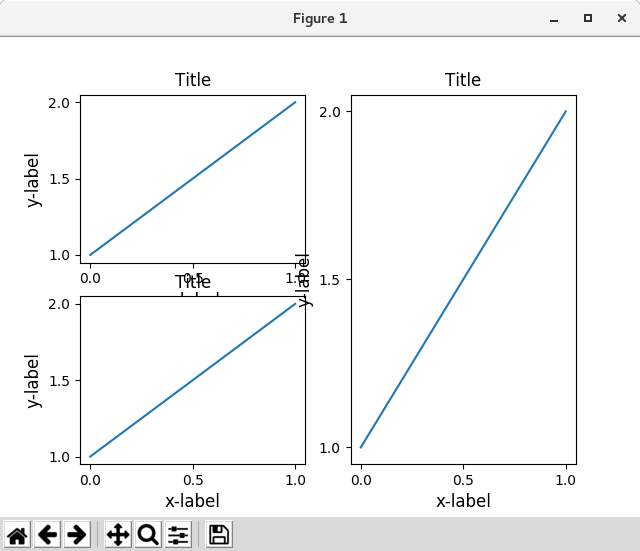
Python 3.11.2 見直しました。上記のコードでは、下記のエラーが発生します。
Traceback (most recent call last):
File "_:\Constrained_Layout_01.py", line 13, in
import matplotlib._layoutbox as layoutbox
ModuleNotFoundError: No module named 'matplotlib._layoutbox'
import matplotlib.pyplot as plt import matplotlib.colors as mcolors import matplotlib.gridspec as gridspec import numpy as np plt.rcParams['savefig.facecolor'] = "0.8" plt.rcParams['figure.figsize'] = 4.5, 4. plt.rcParams['figure.max_open_warning'] = 50 def example_plot(ax, fontsize=12, hide_labels=False): ax.plot([1, 2]) ax.locator_params(nbins=3) if hide_labels: ax.set_xticklabels([]) ax.set_yticklabels([]) else: ax.set_xlabel('x-label', fontsize=fontsize) ax.set_ylabel('y-label', fontsize=fontsize) ax.set_title('Title', fontsize=fontsize) fig = plt.figure(layout="constrained") ax1 = plt.subplot(2, 2, 1) ax2 = plt.subplot(2, 2, 3) # third axes that spans both rows in second column: ax3 = plt.subplot(2, 2, (2, 4)) example_plot(ax1) example_plot(ax2) example_plot(ax3) plt.suptitle('Homogenous nrows, ncols') plt.show() 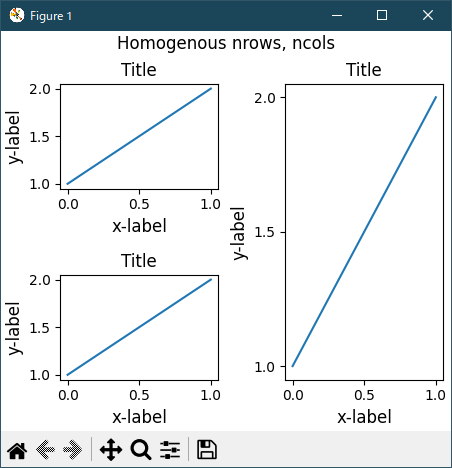
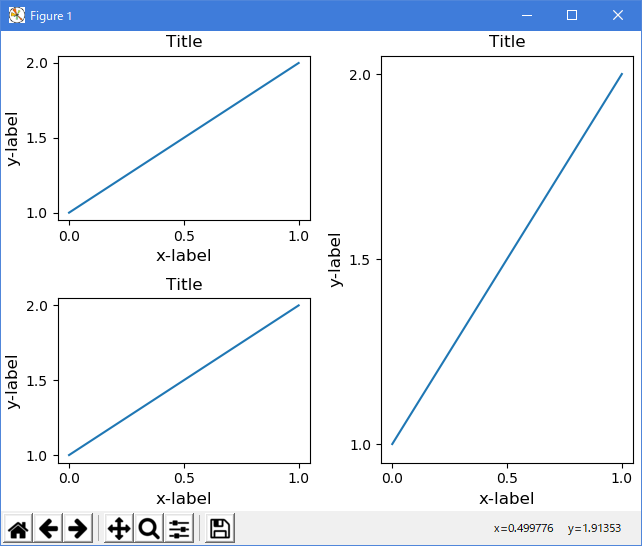
もちろん、レイアウトはgridspecを使って可能です:
# sphinx_gallery_thumbnail_number = 18

#import matplotlib
#matplotlib.use('Qt5Agg')

import warnings

import matplotlib.pyplot as plt
import numpy as np
import matplotlib.colors as mcolors
import matplotlib.gridspec as gridspec

import matplotlib._layoutbox as layoutbox

def example_plot(ax, fontsize=12, nodec=False):
    ax.plot([1, 2])

    ax.locator_params(nbins=3)
    if not nodec:
        ax.set_xlabel('x-label', fontsize=fontsize)
        ax.set_ylabel('y-label', fontsize=fontsize)
        ax.set_title('Title', fontsize=fontsize)
    else:
        ax.set_xticklabels('')
        ax.set_yticklabels('')

# fig = plt.figure()
fig = plt.figure(constrained_layout=True)

gs = fig.add_gridspec(2, 2)

ax1 = fig.add_subplot(gs[0, 0])
ax2 = fig.add_subplot(gs[1, 0])
ax3 = fig.add_subplot(gs[:, 1])

example_plot(ax1)
example_plot(ax2)
example_plot(ax3)

plt.show()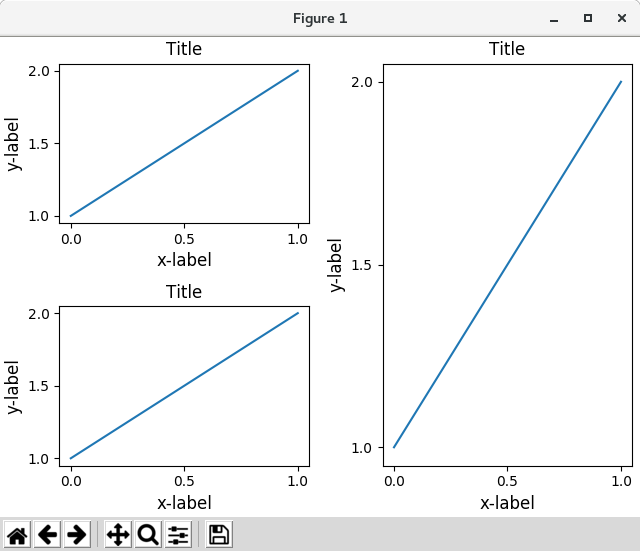
Python 3.11.2 見直しました。上記のコードでは、下記のエラーが発生します。
Traceback (most recent call last):
File "_:\Constrained_Layout_01.py", line 13, in
import matplotlib._layoutbox as layoutbox
ModuleNotFoundError: No module named 'matplotlib._layoutbox'
import matplotlib.pyplot as plt import matplotlib.colors as mcolors import matplotlib.gridspec as gridspec import numpy as np plt.rcParams['savefig.facecolor'] = "0.8" plt.rcParams['figure.figsize'] = 4.5, 4. plt.rcParams['figure.max_open_warning'] = 50 def example_plot(ax, fontsize=12, hide_labels=False): ax.plot([1, 2]) ax.locator_params(nbins=3) if hide_labels: ax.set_xticklabels([]) ax.set_yticklabels([]) else: ax.set_xlabel('x-label', fontsize=fontsize) ax.set_ylabel('y-label', fontsize=fontsize) ax.set_title('Title', fontsize=fontsize) fig = plt.figure(layout="constrained") ax1 = plt.subplot(2, 2, 1) ax2 = plt.subplot(2, 2, 3) ax3 = plt.subplot(1, 2, 2) example_plot(ax1) example_plot(ax2) example_plot(ax3) plt.suptitle('Mixed nrows, ncols') plt.show() 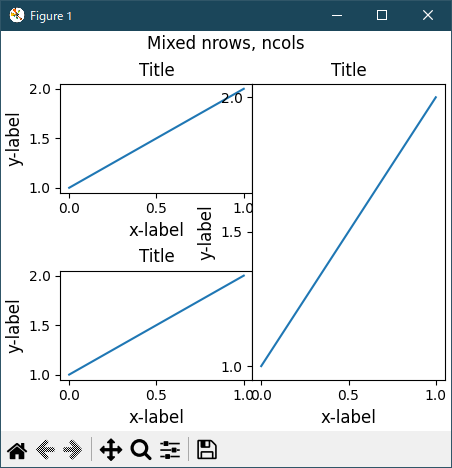
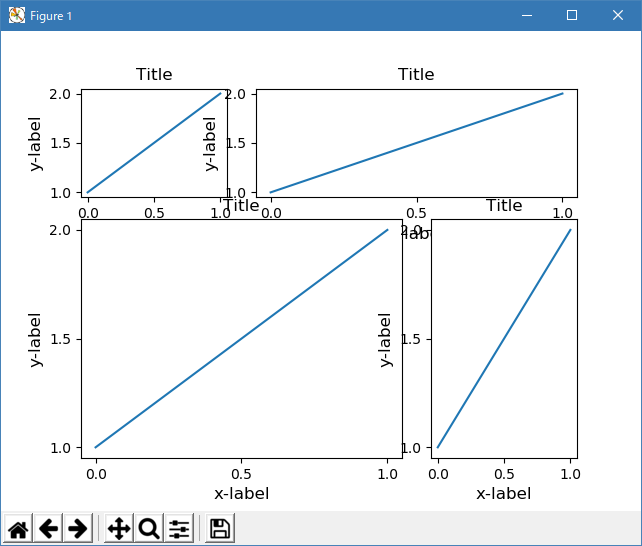
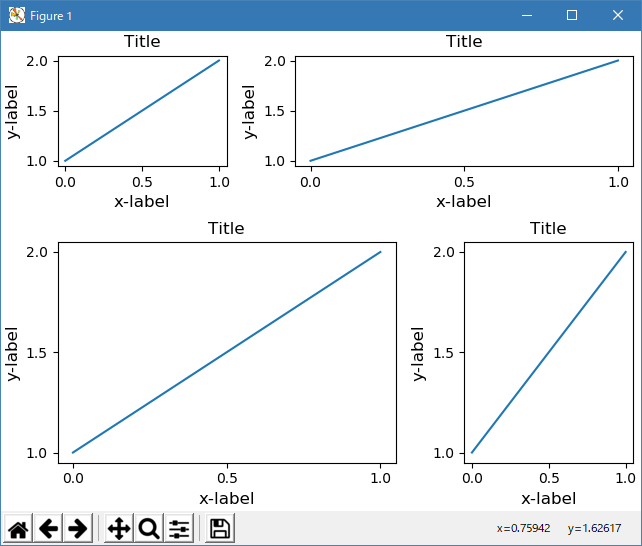
同様に、subplot2grid() は同じ理由で機能しません。呼び出しごとに異なる親の gridspec が作成されます。
# sphinx_gallery_thumbnail_number = 18

#import matplotlib
#matplotlib.use('Qt5Agg')

import warnings

import matplotlib.pyplot as plt
import numpy as np
import matplotlib.colors as mcolors
import matplotlib.gridspec as gridspec

import matplotlib._layoutbox as layoutbox

def example_plot(ax, fontsize=12, nodec=False):
    ax.plot([1, 2])

    ax.locator_params(nbins=3)
    if not nodec:
        ax.set_xlabel('x-label', fontsize=fontsize)
        ax.set_ylabel('y-label', fontsize=fontsize)
        ax.set_title('Title', fontsize=fontsize)
    else:
        ax.set_xticklabels('')
        ax.set_yticklabels('')

# fig = plt.figure()
# fig = plt.figure(constrained_layout=True)

fig = plt.figure()

ax1 = plt.subplot2grid((3, 3), (0, 0))
ax2 = plt.subplot2grid((3, 3), (0, 1), colspan=2)
ax3 = plt.subplot2grid((3, 3), (1, 0), colspan=2, rowspan=2)
ax4 = plt.subplot2grid((3, 3), (1, 2), rowspan=2)

example_plot(ax1)
example_plot(ax2)
example_plot(ax3)
example_plot(ax4)

plt.show()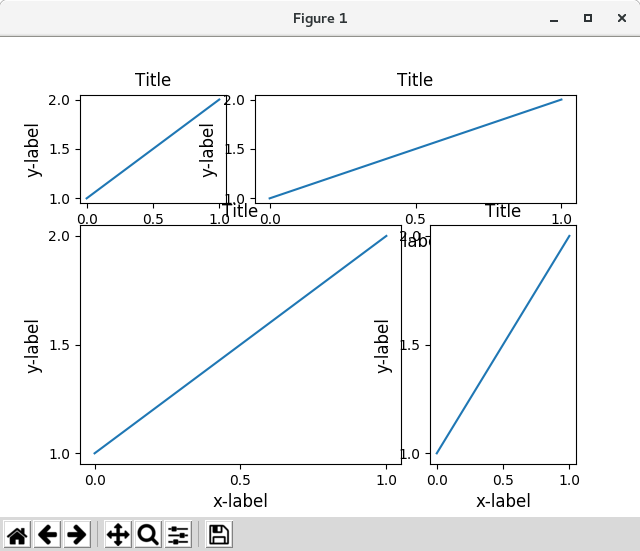
Python 3.11.2 見直しました。上記のコードでは、下記のエラーが発生します。
Traceback (most recent call last):
File "_:\Constrained_Layout_01.py", line 13, in
import matplotlib._layoutbox as layoutbox
ModuleNotFoundError: No module named 'matplotlib._layoutbox'
import matplotlib.pyplot as plt import matplotlib.colors as mcolors import matplotlib.gridspec as gridspec import numpy as np plt.rcParams['savefig.facecolor'] = "0.8" plt.rcParams['figure.figsize'] = 4.5, 4. plt.rcParams['figure.max_open_warning'] = 50 def example_plot(ax, fontsize=12, hide_labels=False): ax.plot([1, 2]) ax.locator_params(nbins=3) if hide_labels: ax.set_xticklabels([]) ax.set_yticklabels([]) else: ax.set_xlabel('x-label', fontsize=fontsize) ax.set_ylabel('y-label', fontsize=fontsize) ax.set_title('Title', fontsize=fontsize) fig = plt.figure(layout="constrained") ax1 = plt.subplot2grid((3, 3), (0, 0)) ax2 = plt.subplot2grid((3, 3), (0, 1), colspan=2) ax3 = plt.subplot2grid((3, 3), (1, 0), colspan=2, rowspan=2) ax4 = plt.subplot2grid((3, 3), (1, 2), rowspan=2) example_plot(ax1) example_plot(ax2) example_plot(ax3) example_plot(ax4) fig.suptitle('subplot2grid') plt.show() 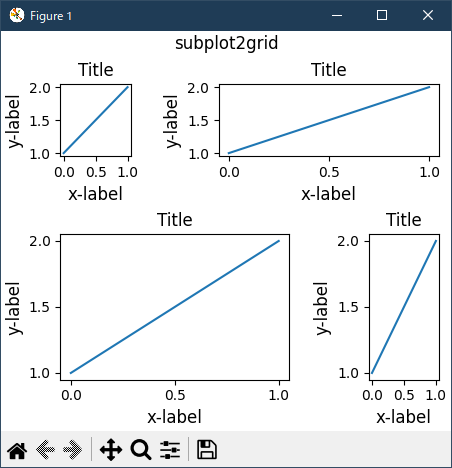
このプロットをconstrained_layout と互換性を持たせる方法は、再び gridspec を直接使用することです
# sphinx_gallery_thumbnail_number = 18

#import matplotlib
#matplotlib.use('Qt5Agg')

import warnings

import matplotlib.pyplot as plt
import numpy as np
import matplotlib.colors as mcolors
import matplotlib.gridspec as gridspec

import matplotlib._layoutbox as layoutbox

def example_plot(ax, fontsize=12, nodec=False):
    ax.plot([1, 2])

    ax.locator_params(nbins=3)
    if not nodec:
        ax.set_xlabel('x-label', fontsize=fontsize)
        ax.set_ylabel('y-label', fontsize=fontsize)
        ax.set_title('Title', fontsize=fontsize)
    else:
        ax.set_xticklabels('')
        ax.set_yticklabels('')

# fig = plt.figure()
fig = plt.figure(constrained_layout=True)

# fig = plt.figure()
gs = fig.add_gridspec(3, 3)

ax1 = fig.add_subplot(gs[0, 0])
ax2 = fig.add_subplot(gs[0, 1:])
ax3 = fig.add_subplot(gs[1:, 0:2])
ax4 = fig.add_subplot(gs[1:, -1])

example_plot(ax1)
example_plot(ax2)
example_plot(ax3)
example_plot(ax4)

plt.show()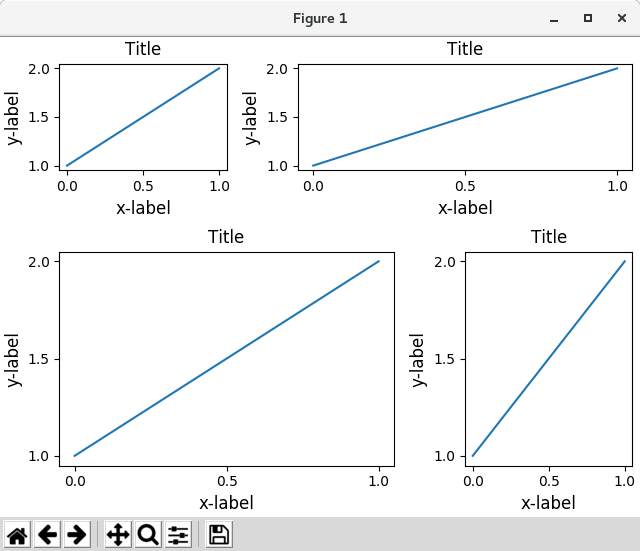
Python 3.11.2 見直しました。上記のコードでは、下記のエラーが発生します。
Traceback (most recent call last):
File "_:\Constrained_Layout_01.py", line 13, in
import matplotlib._layoutbox as layoutbox
ModuleNotFoundError: No module named 'matplotlib._layoutbox'
import matplotlib.pyplot as plt import matplotlib.colors as mcolors import matplotlib.gridspec as gridspec import numpy as np plt.rcParams['savefig.facecolor'] = "0.8" plt.rcParams['figure.figsize'] = 4.5, 4. plt.rcParams['figure.max_open_warning'] = 50 def example_plot(ax, fontsize=12, hide_labels=False): ax.plot([1, 2]) ax.locator_params(nbins=3) if hide_labels: ax.set_xticklabels([]) ax.set_yticklabels([]) else: ax.set_xlabel('x-label', fontsize=fontsize) ax.set_ylabel('y-label', fontsize=fontsize) ax.set_title('Title', fontsize=fontsize) fig = plt.figure(constrained_layout=True) gs = fig.add_gridspec(3, 3) ax1 = fig.add_subplot(gs[0, 0]) ax2 = fig.add_subplot(gs[0, 1:]) ax3 = fig.add_subplot(gs[1:, 0:2]) ax4 = fig.add_subplot(gs[1:, -1]) example_plot(ax1) example_plot(ax2) example_plot(ax3) example_plot(ax4) plt.show() 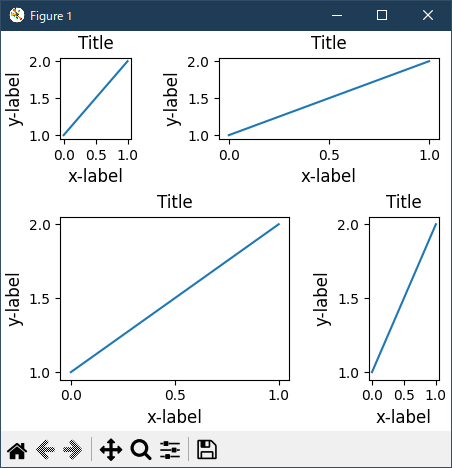
- Other Caveats
- constrained_layout は、ティックラベル、軸ラベル、タイトル、および凡例のみを考慮します。 従って、他のアーティストはクリップされてもよく、重複してもよい。
- ティックラベル、軸ラベル、およびタイトルに必要な余分なスペースが、元の軸の位置とは無関係であると想定しています。 これはしばしば真実ですが、そうでない場合はまれです。
- バックエンドがフォントのレンダリングを処理する方法には小さな違いがあるため、結果はピクセルが同一ではありません。
- Debugging
制約のあるレイアウトは、予想外のやり方で失敗する可能性があります。 制約ソルバを使用するため、ソルバは数学的に正しい解を見つけることができますが、これはユーザが望むものではありません。 通常の失敗モードは、すべてのサイズが最小許容値に崩壊することです。 このような場合は、次の 2 つの理由の1つです。
- 1.あなたが描くことを要求していた要素のための十分なスペースがありませんでした。
- 2.バグがあります。その場合、https://github.com/matplotlib/matplotlib/issues で問題を開きます。
- Notes on the algorithm
制約のアルゴリズムは比較的単純ですが、図をレイアウトする複雑な方法のために複雑さがあります。
- Figure layout
図は階層構造になっています。
1.Figure: fig = plt.figure()

    1.Gridspec gs0 = gridspec.GridSpec(1, 2, figure=fig)

	1.Subplotspec: ss = gs[0, 0]
	    1.Axes: ax0 = fig.add_subplot(ss)
	2.Subplotspec: ss = gs[0, 1]

	    1.Gridspec: gsR = gridspec.GridSpecFromSubplotSpec(2, 1, ss)

		・Subplotspec: ss = gsR[0, 0]

		    ・Axes: axR0 = fig.add_subplot(ss)

		・Subplotspec: ss = gsR[1, 0]

		    ・Axes: axR1 = fig.add_subplot(ss)
各項目にはレイアウトボックスが関連付けられています。 GridSpecFromSubplotSpec で作成された gridspec のネストは、任意の深さにすることができます。
各軸には 2 つのレイアウトボックスがあります。 最初のもの、ax._layoutbox は、Axes の外側とそのすべての装飾(ティンバー、軸ラベルなど)を表します。 2 番目のレイアウトボックスは Axes の ax.position に対応し、図のどこに背骨が配置されるかを設定します。
なぜそんなに多くの積み重なった容器? 理想的には、Axes のレイアウトボックスだけが必要です。 Gridspec の場合、Gridspec が GridSpecFromSubplotSpec を介してネストされている場合はコンテナが必要です。 最上位レベルでは、対称性が望ましいが、それでも suptitle の余地がある。
Subplotspec / Axesの場合、Axes にはカラーバーやその他のアノテーションが Subplotspec 内にパッケージ化する必要があるため、外層が必要になることがよくあります。
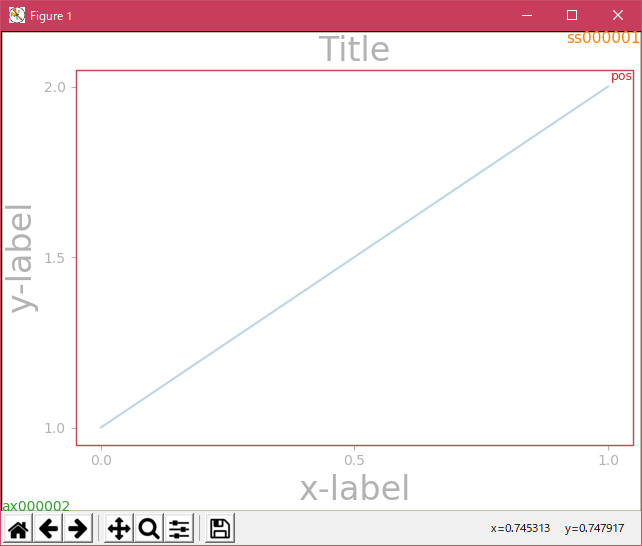
- Simple case: one Axes
単一の Axes の場合、レイアウトはまっすぐです。 Figure と外部の Gridspec レイアウトボックスが一致します。 Axes にはカラーバーがないため、[Subplotspec] ボックスと [Axes] ボックスも一致します。 赤いボックスと緑色のボックスの違いは、軸の周りの装飾のサイズによって設定されることに注意してください。
コードでは、これは do_constrained_layout() のエントリによって次のように実行されます。
ax._poslayoutbox.edit_left_margin_min(-bbox.x0 + pos.x0 + w_padt)
# sphinx_gallery_thumbnail_number = 18

#import matplotlib
#matplotlib.use('Qt5Agg')

import warnings

import matplotlib.pyplot as plt
import numpy as np
import matplotlib.colors as mcolors
import matplotlib.gridspec as gridspec

import matplotlib._layoutbox as layoutbox


def example_plot(ax, fontsize=12, nodec=False):
    ax.plot([1, 2])

    ax.locator_params(nbins=3)
    if not nodec:
        ax.set_xlabel('x-label', fontsize=fontsize)
        ax.set_ylabel('y-label', fontsize=fontsize)
        ax.set_title('Title', fontsize=fontsize)
    else:
        ax.set_xticklabels('')
        ax.set_yticklabels('')

# fig = plt.figure()
# fig = plt.figure(constrained_layout=True)

from matplotlib._layoutbox import plot_children

fig, ax = plt.subplots(constrained_layout=True)
# ax._poslayoutbox.edit_left_margin_min(-bbox.x0 + pos.x0 + w_padt)

example_plot(ax, fontsize=24)
plot_children(fig, fig._layoutbox, printit=False)

plt.show()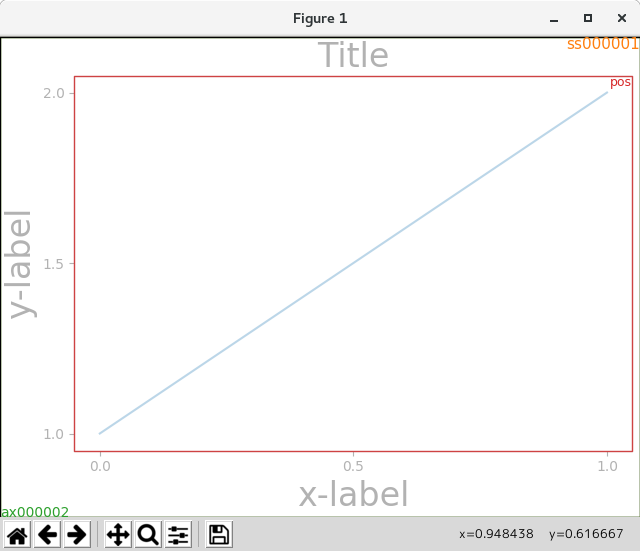
Python 3.11.2 見直しました。上記のコードでは、下記のエラーが発生します。
Traceback (most recent call last):
File "_:\Constrained_Layout_01.py", line 13, in
import matplotlib._layoutbox as layoutbox
ModuleNotFoundError: No module named 'matplotlib._layoutbox'
import matplotlib.pyplot as plt import matplotlib.colors as mcolors import matplotlib.gridspec as gridspec import numpy as np plt.rcParams['savefig.facecolor'] = "0.8" plt.rcParams['figure.figsize'] = 4.5, 4. plt.rcParams['figure.max_open_warning'] = 50 def example_plot(ax, fontsize=12, hide_labels=False): ax.plot([1, 2]) ax.locator_params(nbins=3) if hide_labels: ax.set_xticklabels([]) ax.set_yticklabels([]) else: ax.set_xlabel('x-label', fontsize=fontsize) ax.set_ylabel('y-label', fontsize=fontsize) ax.set_title('Title', fontsize=fontsize) from matplotlib._layoutgrid import plot_children fig, ax = plt.subplots(layout="constrained") example_plot(ax, fontsize=24) plot_children(fig) plt.show() 
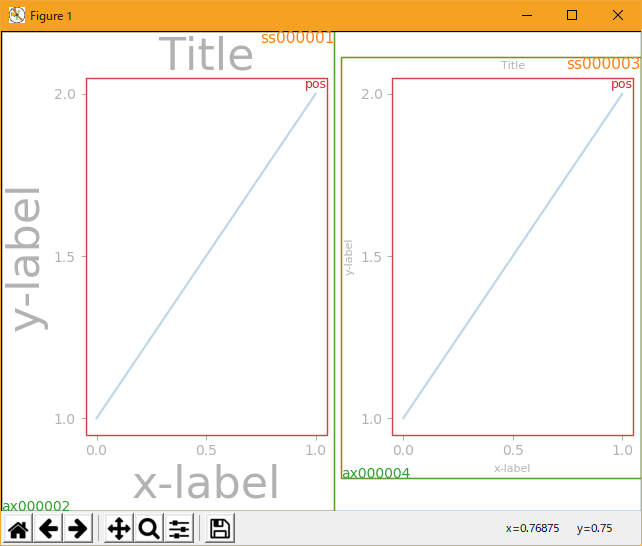
- Simple case: two Axes
この場合、Axes のレイアウトボックスと [Subplotspec] ボックスは引き続き一致します。しかし、右プロットの装飾は左手よりもはるかに小さいので、右のレイアウトボックスは小さくなります。
Subplotspec ボックスは、サブルーチン arange_subplotspecs() のコード内に配置されています。このサブルーチンは、コード内のサブプロットスペックを互いに照合して適切にスタックするだけです。
2 つの pos 軸が並んでいます。彼らは同じ最小行を持っているので、彼らは一番上に並んでいます。彼らは同じ最大行を持っているので、彼らは一番下に並んでいます。コードでは、これは layoutbox.align への呼び出しを介して行われます。複数の行がある場合、同じ水平方向の配置が行間で発生します。
2 つの pos 軸は同じ幅になります。なぜなら、サブプロットスペックは同じ数の列を占めるからです。これは、dcols0 と dcolsC を比較したコードで実行されます。それらが等しければ、それらの幅は等しくなるように制約される。
この場合は少し微妙ですが、Subplotspec 間の分割は中央に配置されていませんが、左側に大きなラベルのスペースを作るために右に移動しています。
# sphinx_gallery_thumbnail_number = 18

#import matplotlib
#matplotlib.use('Qt5Agg')

import warnings

import matplotlib.pyplot as plt
import numpy as np
import matplotlib.colors as mcolors
import matplotlib.gridspec as gridspec

import matplotlib._layoutbox as layoutbox

def example_plot(ax, fontsize=12, nodec=False):
    ax.plot([1, 2])

    ax.locator_params(nbins=3)
    if not nodec:
        ax.set_xlabel('x-label', fontsize=fontsize)
        ax.set_ylabel('y-label', fontsize=fontsize)
        ax.set_title('Title', fontsize=fontsize)
    else:
        ax.set_xticklabels('')
        ax.set_yticklabels('')

# fig = plt.figure()
# fig = plt.figure(constrained_layout=True)

from matplotlib._layoutbox import plot_children

fig, ax = plt.subplots(1, 2, constrained_layout=True)
example_plot(ax[0], fontsize=32)
example_plot(ax[1], fontsize=8)
plot_children(fig, fig._layoutbox, printit=False)

plt.show()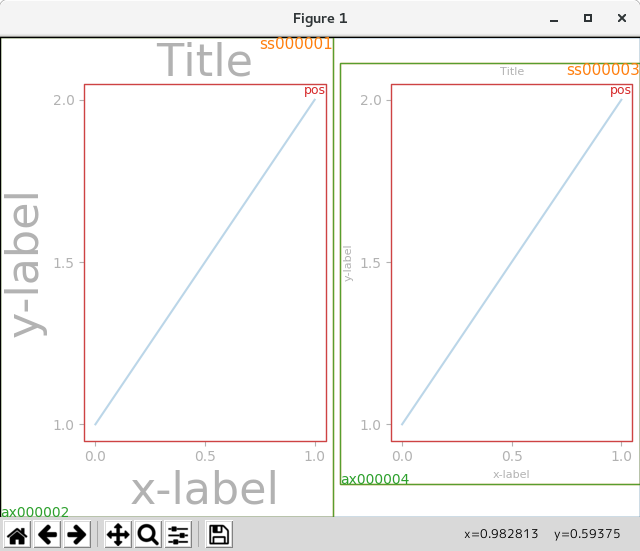
Python 3.11.2 見直しました。上記のコードでは、下記のエラーが発生します。
Traceback (most recent call last):
File "_:\Constrained_Layout_01.py", line 13, in
import matplotlib._layoutbox as layoutbox
ModuleNotFoundError: No module named 'matplotlib._layoutbox'
import matplotlib.pyplot as plt import matplotlib.colors as mcolors import matplotlib.gridspec as gridspec import numpy as np plt.rcParams['savefig.facecolor'] = "0.8" plt.rcParams['figure.figsize'] = 4.5, 4. plt.rcParams['figure.max_open_warning'] = 50 def example_plot(ax, fontsize=12, hide_labels=False): ax.plot([1, 2]) ax.locator_params(nbins=3) if hide_labels: ax.set_xticklabels([]) ax.set_yticklabels([]) else: ax.set_xlabel('x-label', fontsize=fontsize) ax.set_ylabel('y-label', fontsize=fontsize) ax.set_title('Title', fontsize=fontsize) from matplotlib._layoutgrid import plot_children fig, ax = plt.subplots(1, 2, layout="constrained") example_plot(ax[0], fontsize=32) example_plot(ax[1], fontsize=8) plot_children(fig) plt.show() 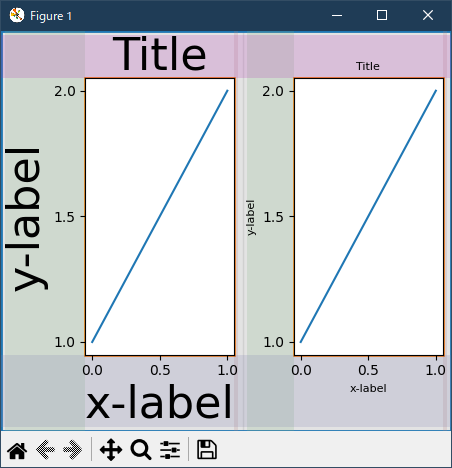
- Two Axes and colorbar
カラーバーを追加すると、Subplotspec のレイアウトボックスが軸レイアウトボックスと異なる必要がある理由が明確になります。 ここでは、左の subplotspec が colorbar を収容する余地があり、ss ボックスの中に2つの緑の ax ボックスがあることがわかります。
pos ボックスの幅は、そのサブプロットスペックが同じ数のカラム(この例では 1 つ)を占めるため、幅に制約があるため、依然として同じであることに注意してください。
カラーバーレイアウトロジックは make_axes に含まれています。これは、単一の軸にアタッチされた cbars に対して _constrained_layout.layoutcolorbarsingle() を呼び出し、colorbar がグリッドスペックに関連付けられている場合は _constrained_layout.layoutcolorbargridspec() を呼び出します。
# sphinx_gallery_thumbnail_number = 18

#import matplotlib
#matplotlib.use('Qt5Agg')

import warnings

import matplotlib.pyplot as plt
import numpy as np
import matplotlib.colors as mcolors
import matplotlib.gridspec as gridspec

import matplotlib._layoutbox as layoutbox
from matplotlib._layoutbox import plot_children

def example_plot(ax, fontsize=12, nodec=False):
    ax.plot([1, 2])

    ax.locator_params(nbins=3)
    if not nodec:
        ax.set_xlabel('x-label', fontsize=fontsize)
        ax.set_ylabel('y-label', fontsize=fontsize)
        ax.set_title('Title', fontsize=fontsize)
    else:
        ax.set_xticklabels('')
        ax.set_yticklabels('')

def docomplicated(suptitle=None):
    arr = np.arange(100).reshape((10, 10))
    norm = mcolors.Normalize(vmin=0., vmax=100.)
    # see note above: this makes all pcolormesh calls consistent:
    pc_kwargs = {'rasterized': True, 'cmap': 'viridis', 'norm': norm}

    # fig = plt.figure()
    fig = plt.figure(constrained_layout=True)
    gs0 = fig.add_gridspec(1, 2, figure=fig, width_ratios=[1., 2.])
    gsl = gs0[0].subgridspec(2, 1)
    gsr = gs0[1].subgridspec(2, 2)

    for gs in gsl:
        ax = fig.add_subplot(gs)
        example_plot(ax)
    axs = []
    for gs in gsr:
        ax = fig.add_subplot(gs)
        pcm = ax.pcolormesh(arr, **pc_kwargs)
        ax.set_xlabel('x-label')
        ax.set_ylabel('y-label')
        ax.set_title('title')

        axs += [ax]
    fig.colorbar(pcm, ax=axs)
    if suptitle is not None:
        fig.suptitle(suptitle)

# docomplicated()

arr = np.arange(100).reshape((10, 10))
norm = mcolors.Normalize(vmin=0., vmax=100.)
# see note above: this makes all pcolormesh calls consistent:
pc_kwargs = {'rasterized': True, 'cmap': 'viridis', 'norm': norm}

fig, ax = plt.subplots(1, 2, constrained_layout=True)
im = ax[0].pcolormesh(arr, **pc_kwargs)
fig.colorbar(im, ax=ax[0], shrink=0.6)
im = ax[1].pcolormesh(arr, **pc_kwargs)
plot_children(fig, fig._layoutbox, printit=False)

plt.show()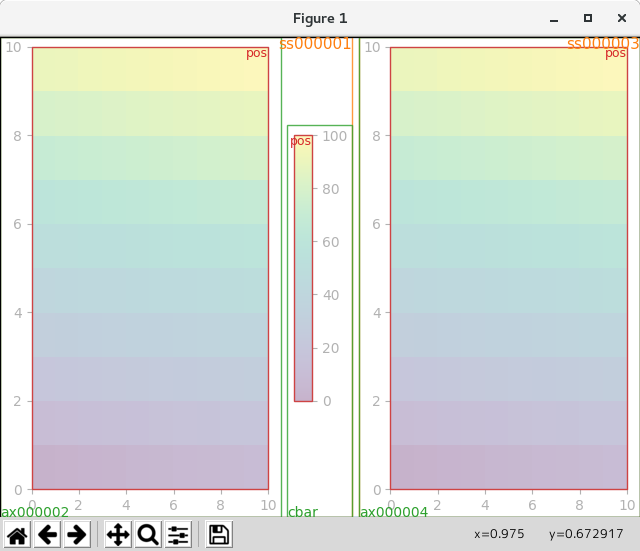
Python 3.11.2 見直しました。上記のコードでは、下記のエラーが発生します。
Traceback (most recent call last):
File "_:\Constrained_Layout_01.py", line 13, in
import matplotlib._layoutbox as layoutbox
ModuleNotFoundError: No module named 'matplotlib._layoutbox'
import matplotlib.pyplot as plt import matplotlib.colors as mcolors import matplotlib.gridspec as gridspec import numpy as np plt.rcParams['savefig.facecolor'] = "0.8" plt.rcParams['figure.figsize'] = 4.5, 4. plt.rcParams['figure.max_open_warning'] = 50 def example_plot(ax, fontsize=12, hide_labels=False): ax.plot([1, 2]) ax.locator_params(nbins=3) if hide_labels: ax.set_xticklabels([]) ax.set_yticklabels([]) else: ax.set_xlabel('x-label', fontsize=fontsize) ax.set_ylabel('y-label', fontsize=fontsize) ax.set_title('Title', fontsize=fontsize) from matplotlib._layoutgrid import plot_children arr = np.arange(100).reshape((10, 10)) norm = mcolors.Normalize(vmin=0., vmax=100.) pc_kwargs = {'rasterized': True, 'cmap': 'viridis', 'norm': norm} fig, ax = plt.subplots(1, 2, layout="constrained") im = ax[0].pcolormesh(arr, **pc_kwargs) fig.colorbar(im, ax=ax[0], shrink=0.6) im = ax[1].pcolormesh(arr, **pc_kwargs) plot_children(fig) plt.show() 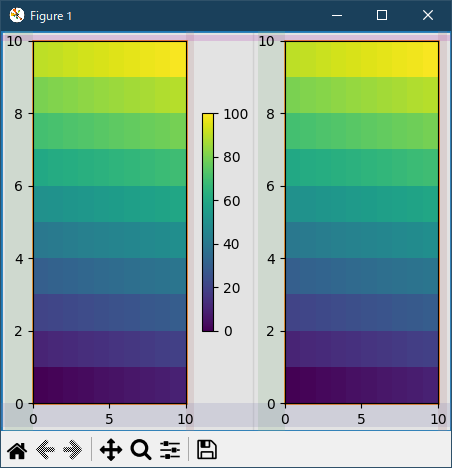
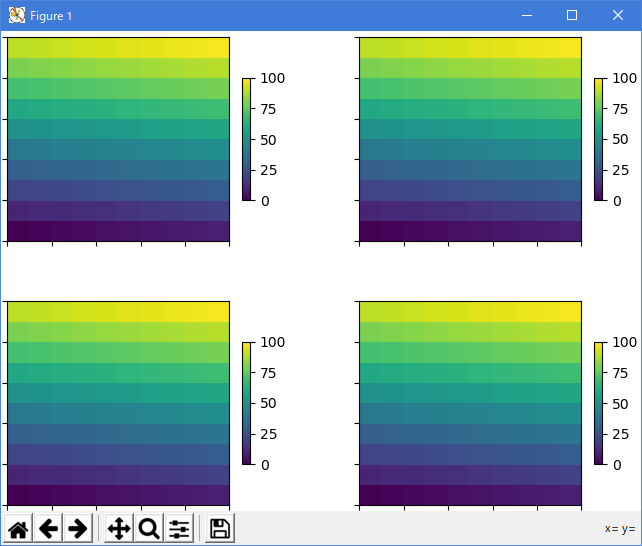
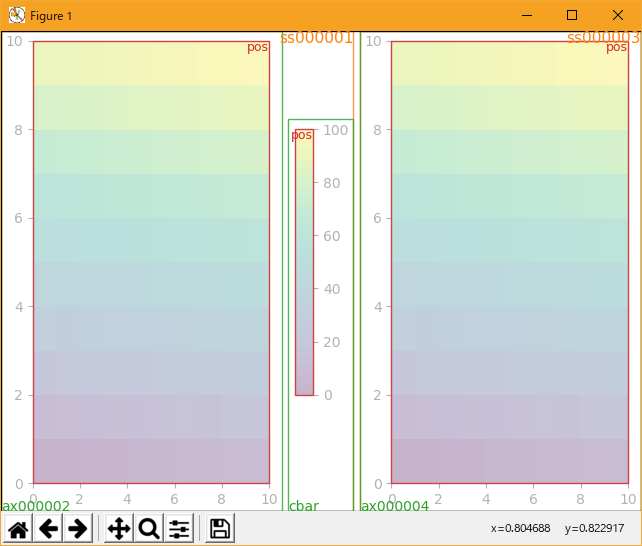
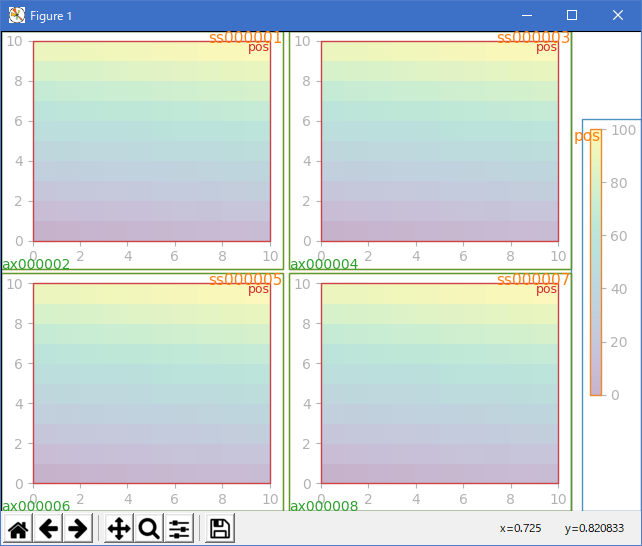
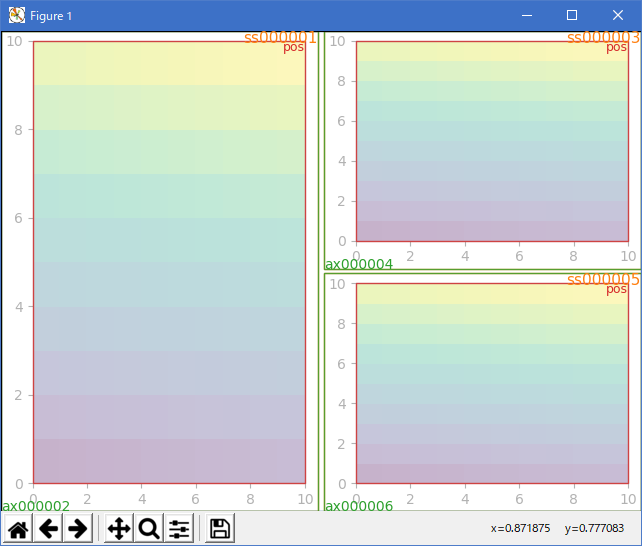
- Colorbar associated with a Gridspec
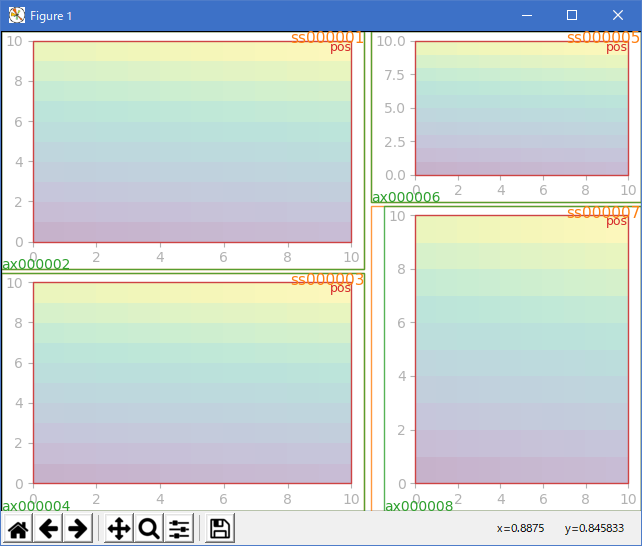
この例は、カラーバーのレイアウトボックスによって小さくされた Subplotspec レイアウトボックスを示しています。 カラーバーレイアウトボックスのサイズは、グリッドスペックの pos レイアウトボックスの垂直範囲より小さく縮小され、その2つのポイントの中央に配置されます。
# sphinx_gallery_thumbnail_number = 18

#import matplotlib
#matplotlib.use('Qt5Agg')

import warnings

import matplotlib.pyplot as plt
import numpy as np
import matplotlib.colors as mcolors
import matplotlib.gridspec as gridspec

import matplotlib._layoutbox as layoutbox
from matplotlib._layoutbox import plot_children

def example_plot(ax, fontsize=12, nodec=False):
    ax.plot([1, 2])

    ax.locator_params(nbins=3)
    if not nodec:
        ax.set_xlabel('x-label', fontsize=fontsize)
        ax.set_ylabel('y-label', fontsize=fontsize)
        ax.set_title('Title', fontsize=fontsize)
    else:
        ax.set_xticklabels('')
        ax.set_yticklabels('')

def docomplicated(suptitle=None):
    arr = np.arange(100).reshape((10, 10))
    norm = mcolors.Normalize(vmin=0., vmax=100.)
    # see note above: this makes all pcolormesh calls consistent:
    pc_kwargs = {'rasterized': True, 'cmap': 'viridis', 'norm': norm}

    # fig = plt.figure()
    fig = plt.figure(constrained_layout=True)
    gs0 = fig.add_gridspec(1, 2, figure=fig, width_ratios=[1., 2.])
    gsl = gs0[0].subgridspec(2, 1)
    gsr = gs0[1].subgridspec(2, 2)

    for gs in gsl:
        ax = fig.add_subplot(gs)
        example_plot(ax)
    axs = []
    for gs in gsr:
        ax = fig.add_subplot(gs)
        pcm = ax.pcolormesh(arr, **pc_kwargs)
        ax.set_xlabel('x-label')
        ax.set_ylabel('y-label')
        ax.set_title('title')

        axs += [ax]
    fig.colorbar(pcm, ax=axs)
    if suptitle is not None:
        fig.suptitle(suptitle)

# docomplicated()

arr = np.arange(100).reshape((10, 10))
norm = mcolors.Normalize(vmin=0., vmax=100.)
# see note above: this makes all pcolormesh calls consistent:
pc_kwargs = {'rasterized': True, 'cmap': 'viridis', 'norm': norm}

fig, ax = plt.subplots(2, 2, constrained_layout=True)
for a in ax.flatten():
    im = a.pcolormesh(arr, **pc_kwargs)
fig.colorbar(im, ax=ax, shrink=0.6)
plot_children(fig, fig._layoutbox, printit=False)

plt.show()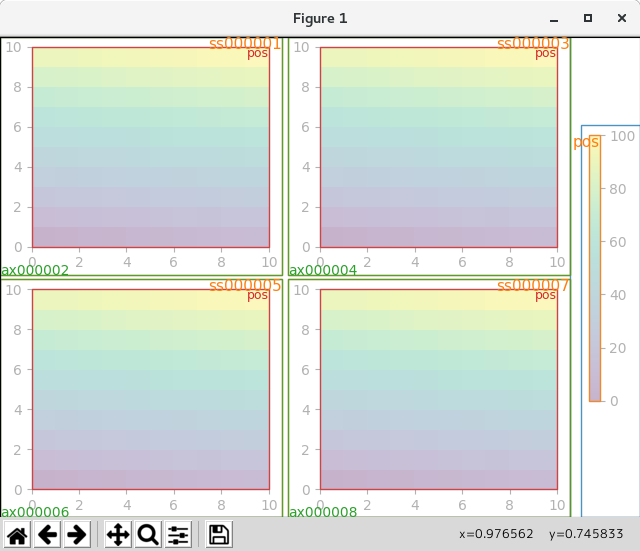
Python 3.11.2 見直しました。上記のコードでは、下記のエラーが発生します。
Traceback (most recent call last):
File "_:\Constrained_Layout_01.py", line 13, in
import matplotlib._layoutbox as layoutbox
ModuleNotFoundError: No module named 'matplotlib._layoutbox'
import matplotlib.pyplot as plt import matplotlib.colors as mcolors import matplotlib.gridspec as gridspec import numpy as np plt.rcParams['savefig.facecolor'] = "0.8" plt.rcParams['figure.figsize'] = 4.5, 4. plt.rcParams['figure.max_open_warning'] = 50 def example_plot(ax, fontsize=12, hide_labels=False): ax.plot([1, 2]) ax.locator_params(nbins=3) if hide_labels: ax.set_xticklabels([]) ax.set_yticklabels([]) else: ax.set_xlabel('x-label', fontsize=fontsize) ax.set_ylabel('y-label', fontsize=fontsize) ax.set_title('Title', fontsize=fontsize) from matplotlib._layoutgrid import plot_children arr = np.arange(100).reshape((10, 10)) norm = mcolors.Normalize(vmin=0., vmax=100.) pc_kwargs = {'rasterized': True, 'cmap': 'viridis', 'norm': norm} fig, axs = plt.subplots(2, 2, layout="constrained") for ax in axs.flat: im = ax.pcolormesh(arr, **pc_kwargs) fig.colorbar(im, ax=axs, shrink=0.6) plot_children(fig) plt.show() 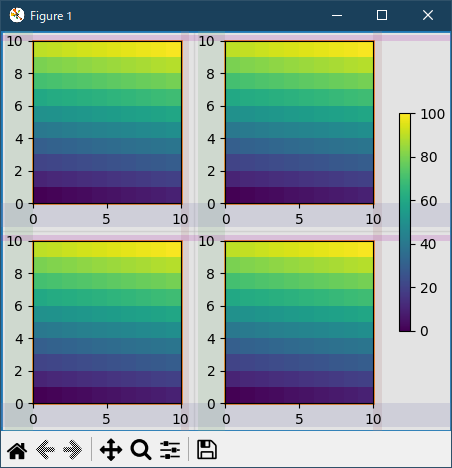
- Uneven sized Axes
グリッドスペックの行または列をまたがるように指定するか、または幅と高さの比率を指定することによって、軸が不均一なサイズになるようにするには 2 つの方法があります。
最初の方法がここで使用されます。 高さを正確にする制約は、drowsC < drows0 である場合には1であるコード内にあります。したがって、1 行の Axes の高さを 2 行の Axes の高さの半分以下に制限します。 行の軸。
# sphinx_gallery_thumbnail_number = 18

#import matplotlib
#matplotlib.use('Qt5Agg')

import warnings

import matplotlib.pyplot as plt
import numpy as np
import matplotlib.colors as mcolors
import matplotlib.gridspec as gridspec

import matplotlib._layoutbox as layoutbox
from matplotlib._layoutbox import plot_children

def example_plot(ax, fontsize=12, nodec=False):
    ax.plot([1, 2])

    ax.locator_params(nbins=3)
    if not nodec:
        ax.set_xlabel('x-label', fontsize=fontsize)
        ax.set_ylabel('y-label', fontsize=fontsize)
        ax.set_title('Title', fontsize=fontsize)
    else:
        ax.set_xticklabels('')
        ax.set_yticklabels('')

def docomplicated(suptitle=None):
    arr = np.arange(100).reshape((10, 10))
    norm = mcolors.Normalize(vmin=0., vmax=100.)
    # see note above: this makes all pcolormesh calls consistent:
    pc_kwargs = {'rasterized': True, 'cmap': 'viridis', 'norm': norm}

    # fig = plt.figure()
    fig = plt.figure(constrained_layout=True)
    gs0 = fig.add_gridspec(1, 2, figure=fig, width_ratios=[1., 2.])
    gsl = gs0[0].subgridspec(2, 1)
    gsr = gs0[1].subgridspec(2, 2)

    for gs in gsl:
        ax = fig.add_subplot(gs)
        example_plot(ax)
    axs = []
    for gs in gsr:
        ax = fig.add_subplot(gs)
        pcm = ax.pcolormesh(arr, **pc_kwargs)
        ax.set_xlabel('x-label')
        ax.set_ylabel('y-label')
        ax.set_title('title')

        axs += [ax]
    fig.colorbar(pcm, ax=axs)
    if suptitle is not None:
        fig.suptitle(suptitle)

# docomplicated()

arr = np.arange(100).reshape((10, 10))
norm = mcolors.Normalize(vmin=0., vmax=100.)
# see note above: this makes all pcolormesh calls consistent:
pc_kwargs = {'rasterized': True, 'cmap': 'viridis', 'norm': norm}

fig = plt.figure(constrained_layout=True)
gs = gridspec.GridSpec(2, 2, figure=fig)
ax = fig.add_subplot(gs[:, 0])
im = ax.pcolormesh(arr, **pc_kwargs)
ax = fig.add_subplot(gs[0, 1])
im = ax.pcolormesh(arr, **pc_kwargs)
ax = fig.add_subplot(gs[1, 1])
im = ax.pcolormesh(arr, **pc_kwargs)
plot_children(fig, fig._layoutbox, printit=False)

plt.show()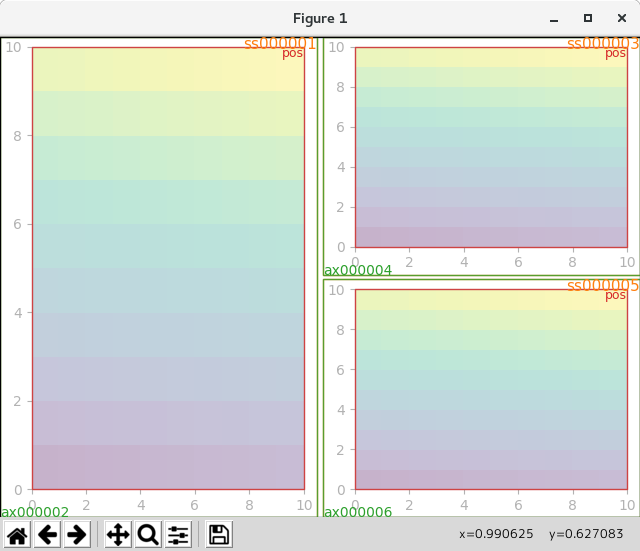
Python 3.11.2 見直しました。上記のコードでは、下記のエラーが発生します。
Traceback (most recent call last):
File "_:\Constrained_Layout_01.py", line 13, in
import matplotlib._layoutbox as layoutbox
ModuleNotFoundError: No module named 'matplotlib._layoutbox'
import matplotlib.pyplot as plt import matplotlib.colors as mcolors import matplotlib.gridspec as gridspec import numpy as np plt.rcParams['savefig.facecolor'] = "0.8" plt.rcParams['figure.figsize'] = 4.5, 4. plt.rcParams['figure.max_open_warning'] = 50 def example_plot(ax, fontsize=12, hide_labels=False): ax.plot([1, 2]) ax.locator_params(nbins=3) if hide_labels: ax.set_xticklabels([]) ax.set_yticklabels([]) else: ax.set_xlabel('x-label', fontsize=fontsize) ax.set_ylabel('y-label', fontsize=fontsize) ax.set_title('Title', fontsize=fontsize) from matplotlib._layoutgrid import plot_children arr = np.arange(100).reshape((10, 10)) norm = mcolors.Normalize(vmin=0., vmax=100.) pc_kwargs = {'rasterized': True, 'cmap': 'viridis', 'norm': norm} fig = plt.figure(layout="constrained") gs = gridspec.GridSpec(2, 2, figure=fig) ax = fig.add_subplot(gs[:, 0]) im = ax.pcolormesh(arr, **pc_kwargs) ax = fig.add_subplot(gs[0, 1]) im = ax.pcolormesh(arr, **pc_kwargs) ax = fig.add_subplot(gs[1, 1]) im = ax.pcolormesh(arr, **pc_kwargs) plot_children(fig) plt.show() 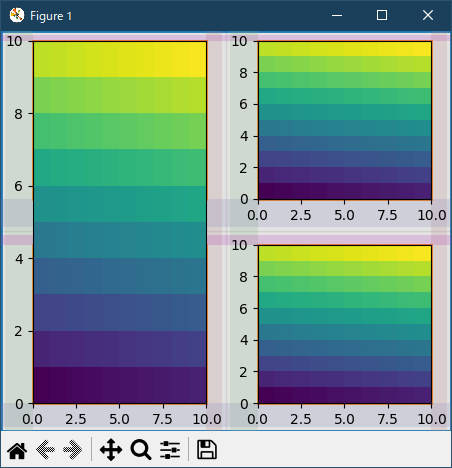
高さと幅の比率はコードの同じ部分に対応し、小さい軸は常に大きいものよりサイズが小さくなるように制約されます。
# sphinx_gallery_thumbnail_number = 18

#import matplotlib
#matplotlib.use('Qt5Agg')

import warnings

import matplotlib.pyplot as plt
import numpy as np
import matplotlib.colors as mcolors
import matplotlib.gridspec as gridspec

import matplotlib._layoutbox as layoutbox
from matplotlib._layoutbox import plot_children

def example_plot(ax, fontsize=12, nodec=False):
    ax.plot([1, 2])

    ax.locator_params(nbins=3)
    if not nodec:
        ax.set_xlabel('x-label', fontsize=fontsize)
        ax.set_ylabel('y-label', fontsize=fontsize)
        ax.set_title('Title', fontsize=fontsize)
    else:
        ax.set_xticklabels('')
        ax.set_yticklabels('')

def docomplicated(suptitle=None):
    arr = np.arange(100).reshape((10, 10))
    norm = mcolors.Normalize(vmin=0., vmax=100.)
    # see note above: this makes all pcolormesh calls consistent:
    pc_kwargs = {'rasterized': True, 'cmap': 'viridis', 'norm': norm}

    # fig = plt.figure()
    fig = plt.figure(constrained_layout=True)
    gs0 = fig.add_gridspec(1, 2, figure=fig, width_ratios=[1., 2.])
    gsl = gs0[0].subgridspec(2, 1)
    gsr = gs0[1].subgridspec(2, 2)

    for gs in gsl:
        ax = fig.add_subplot(gs)
        example_plot(ax)
    axs = []
    for gs in gsr:
        ax = fig.add_subplot(gs)
        pcm = ax.pcolormesh(arr, **pc_kwargs)
        ax.set_xlabel('x-label')
        ax.set_ylabel('y-label')
        ax.set_title('title')

        axs += [ax]
    fig.colorbar(pcm, ax=axs)
    if suptitle is not None:
        fig.suptitle(suptitle)

# docomplicated()

arr = np.arange(100).reshape((10, 10))
norm = mcolors.Normalize(vmin=0., vmax=100.)
# see note above: this makes all pcolormesh calls consistent:
pc_kwargs = {'rasterized': True, 'cmap': 'viridis', 'norm': norm}

fig = plt.figure(constrained_layout=True)
gs = gridspec.GridSpec(3, 2, figure=fig,
    height_ratios=[1., 0.5, 1.5],
    width_ratios=[1.2, 0.8])
ax = fig.add_subplot(gs[:2, 0])
im = ax.pcolormesh(arr, **pc_kwargs)
ax = fig.add_subplot(gs[2, 0])
im = ax.pcolormesh(arr, **pc_kwargs)
ax = fig.add_subplot(gs[0, 1])
im = ax.pcolormesh(arr, **pc_kwargs)
ax = fig.add_subplot(gs[1:, 1])
im = ax.pcolormesh(arr, **pc_kwargs)
plot_children(fig, fig._layoutbox, printit=False)

plt.show()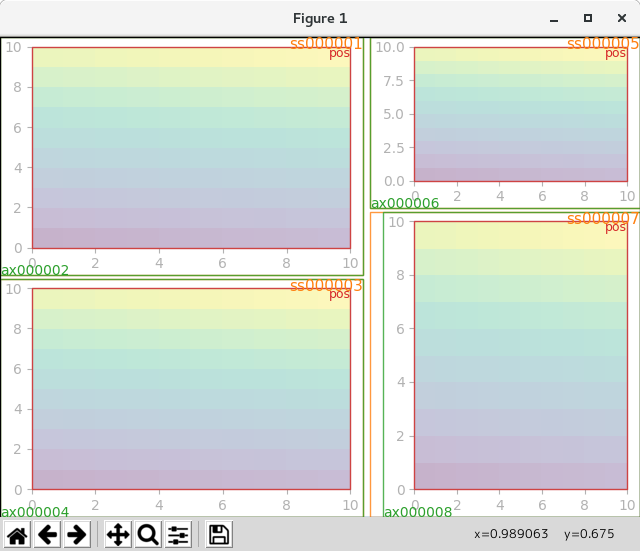
Python 3.11.2 見直しました。上記のコードでは、下記のエラーが発生します。
Traceback (most recent call last):
File "_:\Constrained_Layout_01.py", line 13, in
import matplotlib._layoutbox as layoutbox
ModuleNotFoundError: No module named 'matplotlib._layoutbox'
import matplotlib.pyplot as plt import matplotlib.colors as mcolors import matplotlib.gridspec as gridspec import numpy as np plt.rcParams['savefig.facecolor'] = "0.8" plt.rcParams['figure.figsize'] = 4.5, 4. plt.rcParams['figure.max_open_warning'] = 50 def example_plot(ax, fontsize=12, hide_labels=False): ax.plot([1, 2]) ax.locator_params(nbins=3) if hide_labels: ax.set_xticklabels([]) ax.set_yticklabels([]) else: ax.set_xlabel('x-label', fontsize=fontsize) ax.set_ylabel('y-label', fontsize=fontsize) ax.set_title('Title', fontsize=fontsize) from matplotlib._layoutgrid import plot_children arr = np.arange(100).reshape((10, 10)) norm = mcolors.Normalize(vmin=0., vmax=100.) pc_kwargs = {'rasterized': True, 'cmap': 'viridis', 'norm': norm} fig = plt.figure(layout="constrained") gs = fig.add_gridspec(2, 4) ax00 = fig.add_subplot(gs[0, 0:2]) ax01 = fig.add_subplot(gs[0, 2:]) ax10 = fig.add_subplot(gs[1, 1:3]) example_plot(ax10, fontsize=14) plot_children(fig) plt.show() 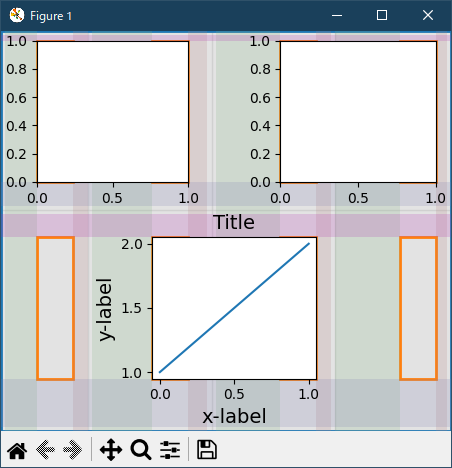
- Empty gridspec slots
説明されていないコードの最後の部分は、空の gridspec がある場合に起こることです。 その場合、見えない偽の軸が追加され、前と同じように処理されます。 空の gridspec にはデコレーションはありませんが、Axes の位置は Axes の占有位置と同じサイズになっています。
これは、 _constrained_layout.do_constrained_layout() ( hassubplotspec )の開始時に行われます。
# sphinx_gallery_thumbnail_number = 18

#import matplotlib
#matplotlib.use('Qt5Agg')

import warnings

import matplotlib.pyplot as plt
import numpy as np
import matplotlib.colors as mcolors
import matplotlib.gridspec as gridspec

import matplotlib._layoutbox as layoutbox
from matplotlib._layoutbox import plot_children

def example_plot(ax, fontsize=12, nodec=False):
    ax.plot([1, 2])

    ax.locator_params(nbins=3)
    if not nodec:
        ax.set_xlabel('x-label', fontsize=fontsize)
        ax.set_ylabel('y-label', fontsize=fontsize)
        ax.set_title('Title', fontsize=fontsize)
    else:
        ax.set_xticklabels('')
        ax.set_yticklabels('')

def docomplicated(suptitle=None):
    arr = np.arange(100).reshape((10, 10))
    norm = mcolors.Normalize(vmin=0., vmax=100.)
    # see note above: this makes all pcolormesh calls consistent:
    pc_kwargs = {'rasterized': True, 'cmap': 'viridis', 'norm': norm}

    # fig = plt.figure()
    fig = plt.figure(constrained_layout=True)
    gs0 = fig.add_gridspec(1, 2, figure=fig, width_ratios=[1., 2.])
    gsl = gs0[0].subgridspec(2, 1)
    gsr = gs0[1].subgridspec(2, 2)

    for gs in gsl:
        ax = fig.add_subplot(gs)
        example_plot(ax)
    axs = []
    for gs in gsr:
        ax = fig.add_subplot(gs)
        pcm = ax.pcolormesh(arr, **pc_kwargs)
        ax.set_xlabel('x-label')
        ax.set_ylabel('y-label')
        ax.set_title('title')

        axs += [ax]
    fig.colorbar(pcm, ax=axs)
    if suptitle is not None:
        fig.suptitle(suptitle)

# docomplicated()

arr = np.arange(100).reshape((10, 10))
norm = mcolors.Normalize(vmin=0., vmax=100.)
# see note above: this makes all pcolormesh calls consistent:
pc_kwargs = {'rasterized': True, 'cmap': 'viridis', 'norm': norm}

fig = plt.figure(constrained_layout=True)
gs = gridspec.GridSpec(1, 3, figure=fig)
ax = fig.add_subplot(gs[0])
im = ax.pcolormesh(arr, **pc_kwargs)
ax = fig.add_subplot(gs[-1])
im = ax.pcolormesh(arr, **pc_kwargs)
plot_children(fig, fig._layoutbox, printit=False)
plt.show()

plt.show()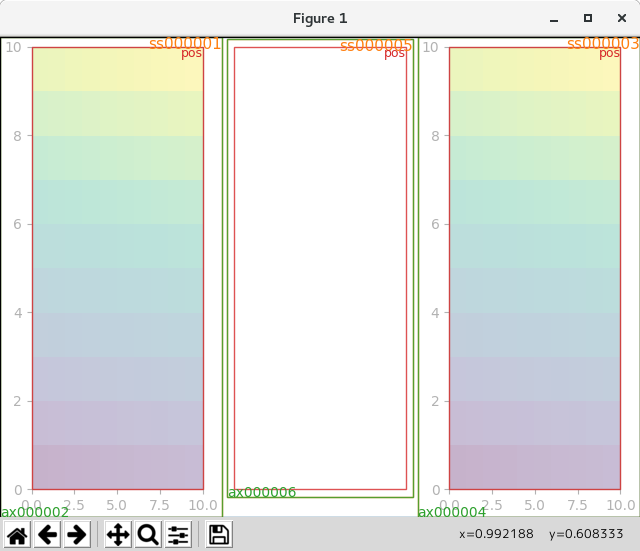
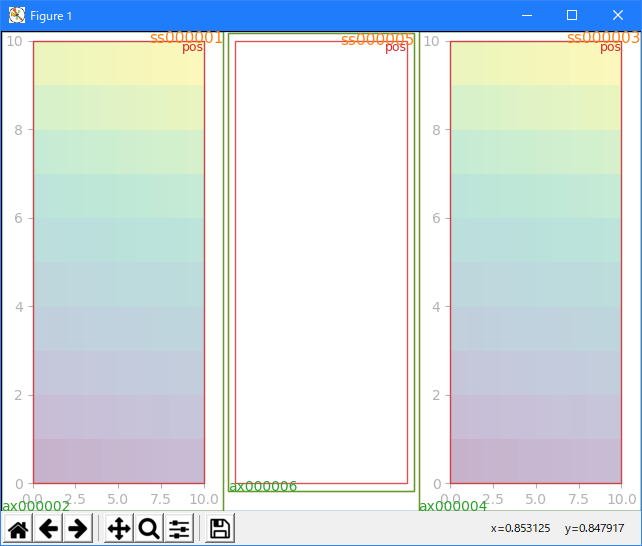
Python 3.11.2 見直しました。上記のコードでは、下記のエラーが発生します。
Traceback (most recent call last):
File "_:\Constrained_Layout_01.py", line 13, in
import matplotlib._layoutbox as layoutbox
ModuleNotFoundError: No module named 'matplotlib._layoutbox'
import matplotlib.pyplot as plt import matplotlib.colors as mcolors import matplotlib.gridspec as gridspec import numpy as np plt.rcParams['savefig.facecolor'] = "0.8" plt.rcParams['figure.figsize'] = 4.5, 4. plt.rcParams['figure.max_open_warning'] = 50 def example_plot(ax, fontsize=12, hide_labels=False): ax.plot([1, 2]) ax.locator_params(nbins=3) if hide_labels: ax.set_xticklabels([]) ax.set_yticklabels([]) else: ax.set_xlabel('x-label', fontsize=fontsize) ax.set_ylabel('y-label', fontsize=fontsize) ax.set_title('Title', fontsize=fontsize) from matplotlib._layoutgrid import plot_children arr = np.arange(100).reshape((10, 10)) norm = mcolors.Normalize(vmin=0., vmax=100.) pc_kwargs = {'rasterized': True, 'cmap': 'viridis', 'norm': norm} fig = plt.figure(constrained_layout=True) gs = gridspec.GridSpec(1, 3, figure=fig) ax = fig.add_subplot(gs[0]) im = ax.pcolormesh(arr, **pc_kwargs) ax = fig.add_subplot(gs[-1]) im = ax.pcolormesh(arr, **pc_kwargs) plot_children(fig) plt.show() 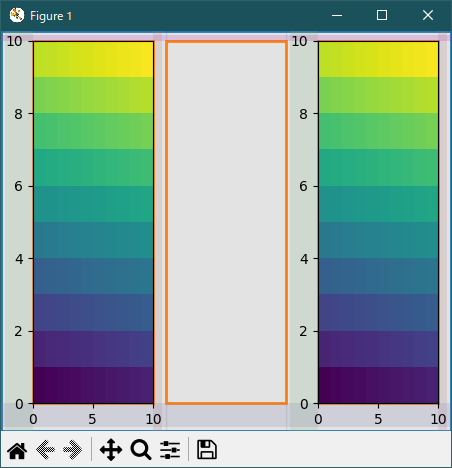
- Other notes
レイアウトは一度だけ呼び出されます。 元のレイアウトがかなり近い場合(これはほとんどの場合に当てはまるはずです)、これは問題ありません。 しかし、レイアウトがデフォルトのレイアウトから大きく変わった場合、デコレータはサイズを変更できます。 特に x と ytick のラベルは変更できます。 このようなことが起こった場合は、おそらくルーチンを 2 回呼び出す必要があります。
スクリプトの合計実行時間:( 0分2.336秒)
- 参照ページ
Constrained Layout Guide
- リリースノート
- 2023/03/24 Ver=1.03 Python 3.11.2 で確認
- 2020/10/28 Ver=1.01 Python 3.7.8 で確認
- 2018/11/08 Ver=1.01 初版リリース
- 関連ページ