|
| matplotlib Artist tutorial. |
H.Kamifuji . |
- 目 次
- Artist tutorial
アーティストオブジェクトを使用してキャンバスにレンダリングする。
matplotlib API には 3 つのレイヤーがあります。
- matplotlib.backend_bases.FigureCanvasは、Figureが描画される領域です
- matplotlib.backend_bases.Rendererは、FigureCanvas上に描画する方法を知っているオブジェクトです
- matplotlib.artist.Artist はレンダラーを使ってキャンバスにペイントする方法を知っているオブジェクトです。
アーティストには、プリミティブとコンテナの 2 種類があります。プリミティブは、Line2D 、Rectangle 、Text 、AxesImage などキャンバスにペイントしたい標準的なグラフィックオブジェクトを表し、コンテナはそれらを配置する場所です( Axis 、Axes 、Figure )。標準的な使い方は、Figure インスタンスを作成し、Figure を使用して 1 つ以上の Axes または Subplot インスタンスを作成し、Axes インスタンスヘルパーメソッドを使用してプリミティブを作成することです。以下の例では、Figure インスタンスをインスタンス化し、ユーザーインターフェイスまたは描画ツールキット FigureCanvas と接続するための便利なメソッドである matplotlib.pyplot.figure() を使用して Figure インスタンスを作成します。以下で説明するように、これは必須ではありません .PostScript 、PDF Gtk + 、wxPython の FigureCanvas インスタンスで直接作業したり、Figure を直接インスタンス化して接続することはできますが、ここでは Artist API に焦点を当てています。 pyplot にそれらの詳細の一部を処理させてください:
import matplotlib.pyplot as plt
fig = plt.figure()
ax = fig.add_subplot(2,1,1) # two rows, one column, first plot
Axes はおそらく matplotlib API の中で最も重要なクラスであり、あなたが大部分の時間を使って作業するクラスです。 これは、Axes がほとんどのオブジェクトが入るプロット領域であり、Axes には最も一般的なグラフィックスプリミティブを作成するための特別なヘルパーメソッド(plot() 、text() 、hist() 、imshow() Line2D 、Text 、Rectangle 、Image 、それぞれ)。 これらのヘルパーメソッドは、必要に応じてデータ(例: numpy 配列や文字列)を取得し、必要に応じてプリミティブアーティストインスタンスを作成し(例: Line2D )、関連するコンテナに追加し、リクエストされたときに描画します。 あなたの大部分はおそらくサブプロットをよく知っているでしょう。これは、サブプロットインスタンスの列ごとに規則的な行に存在する Axes の特別なケースです。 Axes を任意の場所に作成するには、add_axes() メソッドを使用します。このメソッドは、[left、bottom、width、height] 値のリストを0?1の相対座標で取ります。
fig2 = plt.figure()
ax2 = fig2.add_axes([0.15, 0.1, 0.7, 0.3])
例を続ける:
import numpy as np
t = np.arange(0.0, 1.0, 0.01)
s = np.sin(2*np.pi*t)
line, = ax.plot(t, s, color='blue', lw=2)
この例では、ax は、上記の fig.add_subplot 呼び出しで作成された Axes インスタンスです( SubplotはAxes のサブクラスであることを覚えておいてください)。ax.plot を呼び出すと、Line2D インスタンスが作成され Axes.lines リストに追加されます。 以下のインタラクティブな ipython セッションでは、Axes.lines リストが長さ 1 で、行によって返された同じ行、 line, = ax.plot ... call を含んでいることがわかります。
In [101]: ax.lines[0]
Out[101]: <matplotlib.lines.Line2D instance at 0x19a95710>

In [102]: line
Out[102]: <matplotlib.lines.Line2D instance at 0x19a95710>
ax.plot を後で呼び出すと(デフォルトでは "hold" 状態が "on" になっています)、追加の行がリストに追加されます。 後でリストメソッドを呼び出すだけで、後で行を削除することができます。 これらのいずれかが動作します:
del ax.lines[0]
ax.lines.remove(line)  # one or the other, not both!
Axesには、x軸とy軸のダニ、目盛りのラベル、および軸のラベルを設定および装飾するヘルパーメソッドもあります。
xtext = ax.set_xlabel('my xdata') # returns a Text instance
ytext = ax.set_ylabel('my ydata')
ax.set_xlabel を呼び出すと、XAxis の Text インスタンスに関する情報が渡されます。 各 Axes インスタンスには、ダッシュ、目盛りラベル、および軸ラベルのレイアウトと描画を処理する XAxis および YAxis インスタンスが含まれています。
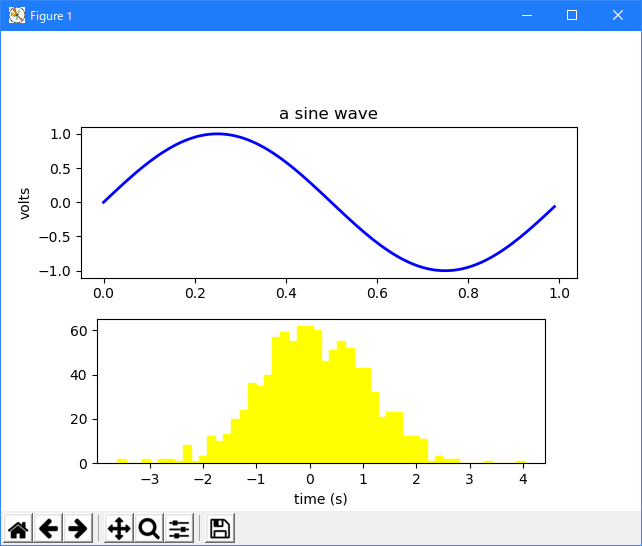
下の図を作成してみてください。
import numpy as np
import matplotlib.pyplot as plt

fig = plt.figure()
fig.subplots_adjust(top=0.8)
ax1 = fig.add_subplot(211)
ax1.set_ylabel('volts')
ax1.set_title('a sine wave')

t = np.arange(0.0, 1.0, 0.01)
s = np.sin(2*np.pi*t)
line, = ax1.plot(t, s, color='blue', lw=2)

# Fixing random state for reproducibility
np.random.seed(19680801)

ax2 = fig.add_axes([0.15, 0.1, 0.7, 0.3])
n, bins, patches = ax2.hist(np.random.randn(1000), 50,
                            facecolor='yellow', edgecolor='yellow')
ax2.set_xlabel('time (s)')

plt.show()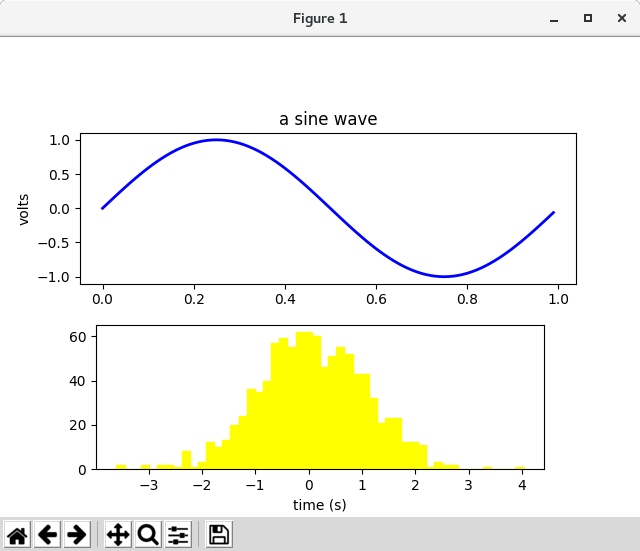
- Customizing your objects
Figure のすべての要素は Matplotlib Artist で表され、それぞれの外観を構成するためのプロパティの広範なリストがあります。 Figure 自体には、Figure の背景色と透明度を設定するのに使用できる Figure のサイズとまったく同じ Rectangle が含まれています。 同様に、各Axesのバウンディングボックス(標準的な Matplotlib プロットの黒い辺を持つ標準的な白いボックスには、Axes の色、透明度、およびその他のプロパティを決定する Rectangle インスタンスがあります。 .patch ( "Patch"はMATLAB から継承された名前で、図の色の2次元パッチ、例えば長方形、円、ポリゴンです)すべての matplotlib Artist は以下のプロパティを持っています
Property Description alpha 透明度 - 0-1 のスカラー animated アニメーション描画を容易にするために使用されるブール値 axes アーティストが存在する軸。恐らくNone clip_box アーティストをクリップするバウンディングボックス clip_on クリッピングが有効かどうか clip_path アーティストがクリッピングされたパス contains アーティストにピッキングポイントが含まれているかどうかをテストするピッキング機能 figure アーティストが存在するフィギュアのインスタンス、おそらくはNone label テキストラベル(例えば、自動ラベル付け用) picker オブジェクトのピッキングを制御するpythonオブジェクト transform 変換 visible アーティストが描画されるべきかどうかを示すブール値 zorder 図面の順序を決定する番号。 rasterized ブール値、ベクトルをラスタグラフィックスに変換します:(圧縮と eps の透明度の場合)
各プロパティは旧式のセッターまたはゲッターでアクセスされます(これは Pythonistas を苛立たせ、プロパティや特性による直接アクセスをサポートする予定ですが、まだ実行されていません)。 たとえば、現在のアルファを 1/2 に掛けるには:
a = o.get_alpha()
o.set_alpha(0.5*a)
一度に多数のプロパティを設定したい場合は、キーワード引数を指定して set メソッドを使用することもできます。 例えば:
o.set(alpha=0.5, zorder=2)
Python シェルで対話的に作業している場合は、プロパティとその値をリストする matplotlib.artist.getp() 関数(単に pyplotでgetp() を使用することです)。 これは、Artist から派生したクラス( FigureやRectangle など)でも有効です。 上記の図の長方形のプロパティは次のとおりです。
In [149]: matplotlib.artist.getp(fig.patch)
    alpha = 1.0
    animated = False
    antialiased or aa = True
    axes = None
    clip_box = None
    clip_on = False
    clip_path = None
    contains = None
    edgecolor or ec = w
    facecolor or fc = 0.75
    figure = Figure(8.125x6.125)
    fill = 1
    hatch = None
    height = 1
    label =
    linewidth or lw = 1.0
    picker = None
    transform = <Affine object at 0x134cca84>
    verts = ((0, 0), (0, 1), (1, 1), (1, 0))
    visible = True
    width = 1
    window_extent = <Bbox object at 0x134acbcc>
    x = 0
    y = 0
    zorder = 1
すべてのクラスのドキュメンテーションには Artist プロパティも含まれているので、インタラクティブな "help" やアーティストに問い合わせて、特定のオブジェクトのプロパティリストを参照することができます。
- Object containers
ここで、設定したいオブジェクトのプロパティを調べて設定する方法を知ったので、そのオブジェクトを取得する方法を知る必要があります。 序文で述べたように、プリミティブとコンテナの 2 種類のオブジェクトがあります。 プリミティブは通常、コンテナにもいくつかのプロパティがありますが、設定したいもの( Text インスタンスのフォント、Line2D の幅)です。たとえば、Axes Artist はプリミティブの多くを含むコンテナです あなたのプロットだけでなく、xscaleが 'linear' か 'log' かを制御する xscale のようなプロパティも持っています。 このセクションでは、取得したいアーティストをさまざまなコンテナオブジェクトが格納する場所を確認します。
- Figure container
最上位のコンテナ Artistはmatplotlib.figure.Figure であり、図のすべてが含まれています。 Figure の背景は、Figure.patch に格納されている Rectangle です。 サブプロット( add_subplot() )と axes(add_axes() )をFigure に追加すると、これらは Figure.axes に追加されます。 これらは、それらを作成するメソッドによっても返されます。
In [156]: fig = plt.figure()

In [157]: ax1 = fig.add_subplot(211)

In [158]: ax2 = fig.add_axes([0.1, 0.1, 0.7, 0.3])

In [159]: ax1
Out[159]: <matplotlib.axes.Subplot instance at 0xd54b26c>

In [160]: print(fig.axes)
[<matplotlib.axes.Subplot instance at 0xd54b26c>, <matplotlib.axes.Axes instance at 0xd3f0b2c>
Figureはpylab / pyplot 状態マシンをサポートするための "current axes" ( Figure.gca と Figure.sca を参照)の概念を維持しているので、Axes リストから軸を直接挿入または削除するのではなく、add_subplot() と add_axes() メソッドを挿入し、削除する delaxes() メソッドを追加します。 ただし、Axesの リストを反復処理したり、Axes にインデックスを付けてカスタマイズしたい Axes インスタンスにアクセスすることは自由です。 すべての軸グリッドをオンにする例を次に示します。
for ax in fig.axes:
    ax.grid(True)
図には独自のテキスト、線、パッチ、イメージがあり、プリミティブを直接追加することができます。 Figure のデフォルトの座標系は単純にピクセルで表示されます(これは通常は必要ではありません)。Figure に追加する Artist の transform プロパティを設定することでこれを制御できます。
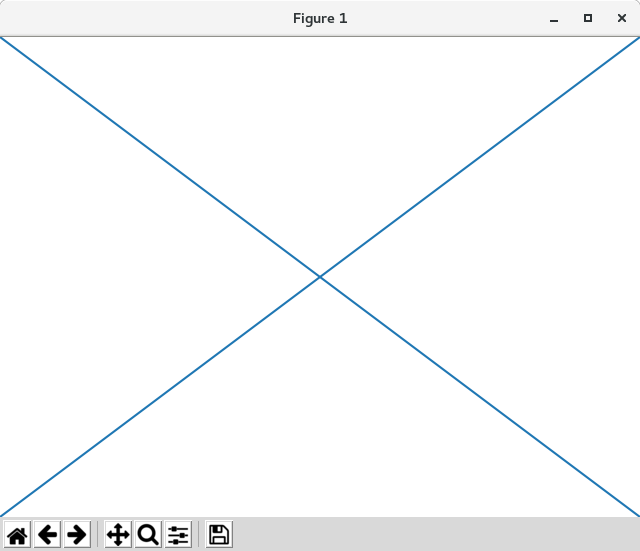
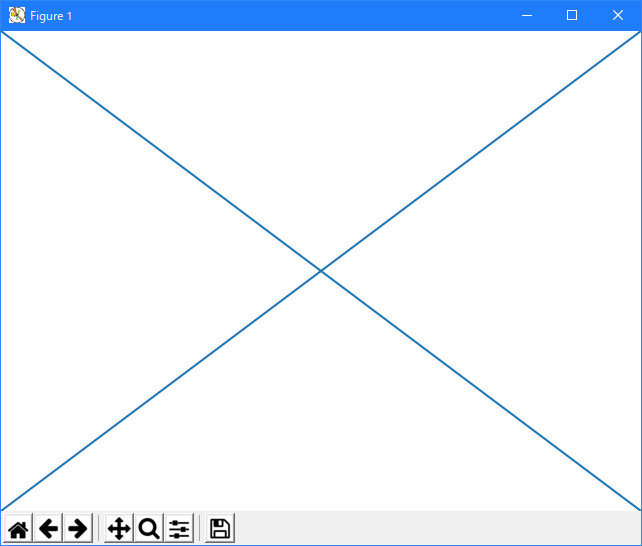
より便利なのは、Figure の左下を(0、0)とし、Artist トランスフォームを fig.transFigure に設定することで得られる図の右上を(1,1)とした "figure coordinates" です。
import numpy as np
import matplotlib.pyplot as plt
import matplotlib.lines as lines

fig = plt.figure()

l1 = lines.Line2D([0, 1], [0, 1], transform=fig.transFigure, figure=fig)
l2 = lines.Line2D([0, 1], [1, 0], transform=fig.transFigure, figure=fig)
fig.lines.extend([l1, l2])

plt.show()
ここには図が含まれるアーティストの要約があります
Figure attribute Description axes Axesインスタンスのリスト(Subplotを含む) patch 矩形の背景 images Imageパッチのリスト - 生のピクセル表示に役立ちます legends Figure Legendインスタンスのリスト(Axes.legendsとは異なる) lines Line2Dインスタンスのリスト(めったに使われません、Axes.linesを参照) patches 図パッチのリスト(めったに使われない、Axes.patchesを参照) texts リストの図Textインスタンス
- Axes container
matplotlib.axes.Axes は matplotlib 宇宙の中心です - それは、これらのアーティストを作成して自分自身に追加するための多くのヘルパーメソッドと、アクセスとカスタマイズのためのヘルパーメソッド それに含まれるアーティスト。 Figure のように、デカルト座標の Rectangle と極座標の Circle である Patch パッチが含まれています。 このパッチは、プロット領域の形状、背景、境界を決定します。
ax = fig.add_subplot(111)
rect = ax.patch  # a Rectangle instance
rect.set_facecolor('green')
正規の plot() などのプロット方法を呼び出して配列や値のリストを渡すと、matplotlib.lines.Line2D() インスタンスが作成され、キーワード引数として渡されたすべての Line2D プロパティでラインが更新され、 Axes.lines コンテナにその行を追加し、それをあなたに返します:
In [213]: x, y = np.random.rand(2, 100)

In [214]: line, = ax.plot(x, y, '-', color='blue', linewidth=2)
plot は複数の x と y の組を plot に渡すことができるので、行のリストを返します。そして、length のリストの最初の要素を line 変数に展開します。 ラインが Axes.lines リストに追加されました:
In [229]: print(ax.lines)
[<matplotlib.lines.Line2D instance at 0xd378b0c>]
同様に、bar() のようなパッチを作成するメソッドは長方形のリストを作成し、パッチを Axes.patches リストに追加します:
In [233]: n, bins, rectangles = ax.hist(np.random.randn(1000), 50, facecolor='yellow')

In [234]: rectangles
Out[234]: <a list of 50 Patch objects>

In [235]: print(len(ax.patches))
Axes.lines または Axes.patches リストにオブジェクトを直接追加するべきではありません。何をしているのか正確に分かっていなければ Axes はオブジェクトを作成して追加するときにいくつかのことを行う必要があるからです。 Artist の Figure と Axes のプロパティと、デフォルトの Axes の変換を設定します(変換が設定されていない場合)。 また、自動スケールを制御するデータ構造を更新するためにアーティストに含まれるデータを検査し、プロットされたデータを含むように表示制限を調整できるようにします。 それにもかかわらず、add_line() や add_patch() などのヘルパーメソッドを使用して、オブジェクトを自分で作成して Axes に直接追加できます。 ここでは、何が起こっているかを示す注釈付きインタラクティブセッションがあります:
In [262]: fig, ax = plt.subplots()

# create a rectangle instance
In [263]: rect = matplotlib.patches.Rectangle( (1,1), width=5, height=12)

# by default the axes instance is None
In [264]: print(rect.get_axes())
None

# and the transformation instance is set to the "identity transform"
In [265]: print(rect.get_transform())
<Affine object at 0x13695544>

# now we add the Rectangle to the Axes
In [266]: ax.add_patch(rect)

# and notice that the ax.add_patch method has set the axes
# instance
In [267]: print(rect.get_axes())
Axes(0.125,0.1;0.775x0.8)

# and the transformation has been set too
In [268]: print(rect.get_transform())
<Affine object at 0x15009ca4>

# the default axes transformation is ax.transData
In [269]: print(ax.transData)
<Affine object at 0x15009ca4>

# notice that the xlimits of the Axes have not been changed
In [270]: print(ax.get_xlim())
(0.0, 1.0)

# but the data limits have been updated to encompass the rectangle
In [271]: print(ax.dataLim.bounds)
(1.0, 1.0, 5.0, 12.0)

# we can manually invoke the auto-scaling machinery
In [272]: ax.autoscale_view()

# and now the xlim are updated to encompass the rectangle
In [273]: print(ax.get_xlim())
(1.0, 6.0)

# we have to manually force a figure draw
In [274]: ax.figure.canvas.draw()
プリミティブアーティストを作成してそれぞれのコンテナに追加するには、多くの Axes ヘルパーメソッドがあります。 以下の表は、それらの小さなサンプル、彼らが作成するアーティストの種類、およびそれらを保存する場所をまとめたものです
Helper method Artist Container ax.annotate - text annotations Annotate ax.texts ax.bar - bar charts Rectangle ax.patches ax.errorbar - error bar plots Line2D and Rectangle ax.lines and ax.patches ax.fill - shared area Polygon ax.patches ax.hist - histograms Rectangle ax.patches ax.imshow - image data AxesImage ax.images ax.legend - axes legends Legend ax.legends ax.plot - xy plots Line2D ax.lines ax.scatter - scatter charts PolygonCollection ax.collections ax.text - text Text ax.texts
これらのすべてのアーティストに加えて、Axes には 2 つの重要な Artist コンテナが含まれています .XAxis と YAxis はダニとラベルの描画を処理します。 これらはインスタンス変数 xaxis と yaxis として格納されます。 XAxis コンテナと YAxis コンテナについては以下で詳しく説明しますが、Axes には Axis インスタンスにコールを転送する多くのヘルパメソッドが含まれているので、必要な場合を除いて直接操作する必要はありません。 たとえば、Axes ヘルパーメソッドを使用して XAxis ティックラベルのフォント色を設定できます。
for label in ax.get_xticklabels():
    label.set_color('orange')
以下に、Axesに含まれるアーティストの概要を示します
Axes attribute Description artists A list of Artist instances patch Rectangle instance for Axes background collections A list of Collection instances images A list of AxesImage legends A list of Legend instances lines A list of Line2D instances patches A list of Patch instances texts A list of Text instances xaxis matplotlib.axis.XAxis instance yaxis matplotlib.axis.YAxis instance
- Axis containers
matplotlib.axis.Axis インスタンスは、ティックライン、グリッドライン、ティックラベル、および軸ラベルの描画を処理します。左右のティックを y 軸に、上下のティックを x 軸に別々に設定することができます。 Axis には、自動スケーリング、パン、ズームに使用されるデータとビュー間隔、およびティックがどこに配置され、どのように文字列として表されるかを制御する Locator と Formatter のインスタンスも格納されます。
各 Axis オブジェクトには、ラベル属性(これは、xlabel() とylabel() への呼び出しで pyplot が変更するものです)、メジャーおよびマイナーダニのリストも含まれています。ティックは XTick と YTick のインスタンスで、実際のラインと、ティックとティックラベルを描画するテキストプリミティブを含んでいます。ティックは必要に応じて動的に作成されるため(パンやズームなど)、アクセサメソッド get_major_ticks() と get_minor_ticks() を使用してメジャーおよびマイナーティックのリストにアクセスする必要があります。ティックにはすべてのプリミティブが含まれていますが、Axis インスタンスにはティックライン、ティックラベル、ティックの位置などを返すアクセサメソッドがあります。
import numpy as np
import matplotlib.pyplot as plt
import matplotlib.lines as lines

fig, ax = plt.subplots()
axis = ax.xaxis
axis.get_ticklocs()

plt.show()

axis.get_ticklabels()
デフォルトでは、上下にチケット行がありますが、x 軸の下に目盛りのラベルが付いているだけなので、ラベルの 2 倍のティックラインがあることに注意してください。 これはカスタマイズすることができます
axis.get_ticklines()
デフォルトでは、大きな目盛りが戻ってくる
axis.get_ticklines()
get_major_ticks()
マイナーティックを尋ねることもできます
axis.get_ticklines(minor=True)
get_minor_ticks()
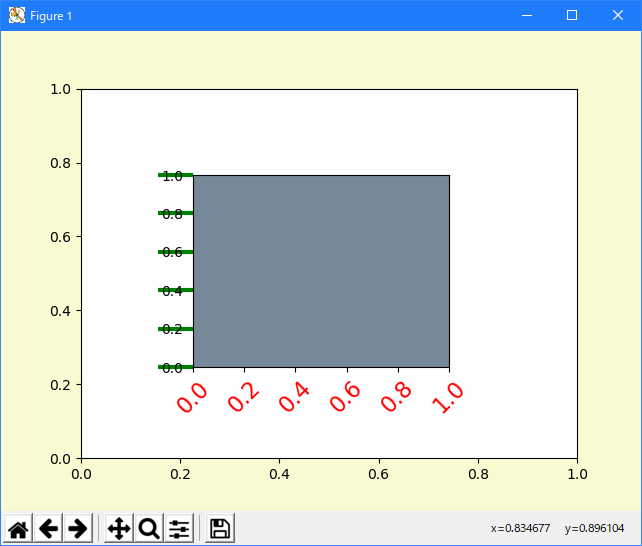
import numpy as np
import matplotlib.pyplot as plt
import matplotlib.lines as lines

fig, ax = plt.subplots()
axis = ax.xaxis
# a = axis.get_ticklocs()
# print(a)

axis.get_ticklines(minor=True)

# Here is a summary of some of the useful accessor methods of the ``Axis``
# (these have corresponding setters where useful, such as
# set_major_formatter)
#
# ======================  =========================================================
# Accessor method         Description
# ======================  =========================================================
# get_scale               The scale of the axis, e.g., 'log' or 'linear'
# get_view_interval       The interval instance of the axis view limits
# get_data_interval       The interval instance of the axis data limits
# get_gridlines           A list of grid lines for the Axis
# get_label               The axis label - a Text instance
# get_ticklabels          A list of Text instances - keyword minor=True|False
# get_ticklines           A list of Line2D instances - keyword minor=True|False
# get_ticklocs            A list of Tick locations - keyword minor=True|False
# get_major_locator       The matplotlib.ticker.Locator instance for major ticks
# get_major_formatter     The matplotlib.ticker.Formatter instance for major ticks
# get_minor_locator       The matplotlib.ticker.Locator instance for minor ticks
# get_minor_formatter     The matplotlib.ticker.Formatter instance for minor ticks
# get_major_ticks         A list of Tick instances for major ticks
# get_minor_ticks         A list of Tick instances for minor ticks
# grid                    Turn the grid on or off for the major or minor ticks
# ======================  =========================================================
#
# Here is an example, not recommended for its beauty, which customizes
# the axes and tick properties

# plt.figure creates a matplotlib.figure.Figure instance
# fig = plt.figure()
rect = fig.patch  # a rectangle instance
rect.set_facecolor('lightgoldenrodyellow')

ax1 = fig.add_axes([0.3, 0.3, 0.4, 0.4])
rect = ax1.patch
rect.set_facecolor('lightslategray')

for label in ax1.xaxis.get_ticklabels():
    # label is a Text instance
    label.set_color('red')
    label.set_rotation(45)
    label.set_fontsize(16)

for line in ax1.yaxis.get_ticklines():
    # line is a Line2D instance
    line.set_color('green')
    line.set_markersize(25)
    line.set_markeredgewidth(3)

plt.show()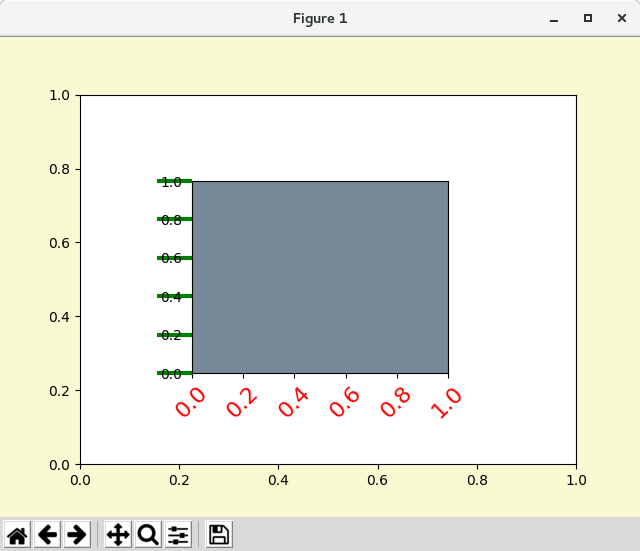
- Tick containers
matplotlib.axis.Tick は、Figure から Axes への Axis から Tick への降下の最後のコンテナオブジェクトです。 Tick には、ティックとグリッドラインのインスタンスと、上下のダニのラベルインスタンスが含まれています。 これらのそれぞれは、Tick の属性として直接アクセスできます。 さらに、x 軸に対して上のラベルとティックがオンであるかどうか、y 軸に対して右のラベルとティックがオンであるかどうかを決定するブール変数があります。
Tick attribute Description tick1line Line2D インスタンス tick2line Line2D インスタンス gridline Line2D インスタンス label1 Text インスタンス label2 Text インスタンス gridOn boolean 値。グリッド線を描画するかどうかを決定します。 tick1On boolean 値。最初のティックラインを描画するかどうかを決定します。 tick2On boolean 値。2番目のティックラインを描画するかどうかを決定します。 label1On boolean 値。最初のティックラベルを描画するかどうかを指定します。 label2On boolean 値。2番目のティックラベルを描画するかどうかを指定します。
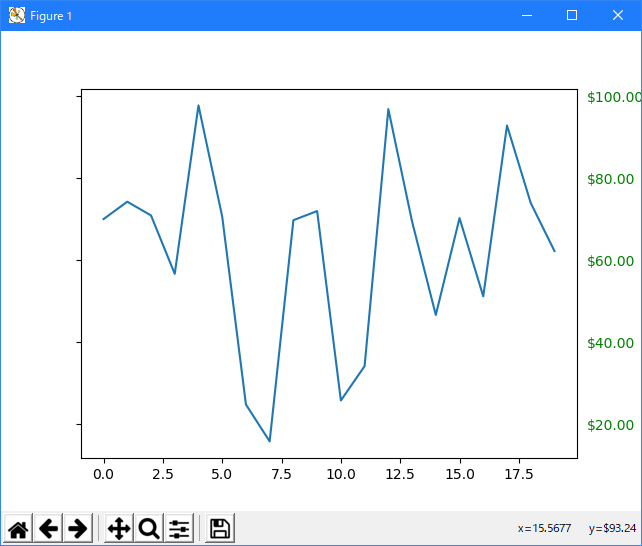
ここでは、右側の目盛りのフォーマッタをドル記号で設定し、y 軸の右側に緑色に色付けする例を示します
import numpy as np
import matplotlib.pyplot as plt
import matplotlib.lines as lines
import matplotlib.ticker as ticker

# Fixing random state for reproducibility
np.random.seed(19680801)

fig, ax = plt.subplots()
ax.plot(100*np.random.rand(20))

formatter = ticker.FormatStrFormatter('$%1.2f')
ax.yaxis.set_major_formatter(formatter)

for tick in ax.yaxis.get_major_ticks():
    tick.label1On = False
    tick.label2On = True
    tick.label2.set_color('green')

plt.show()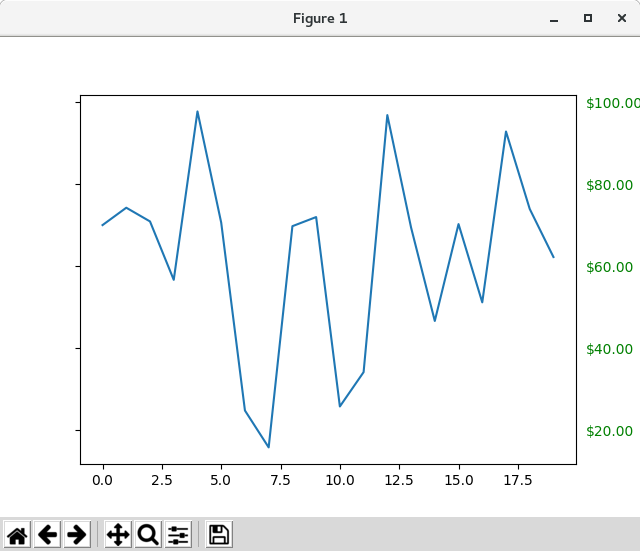
- 参照ページ
Artist tutorial
- リリースノート
- 2023/03/11 Ver=1.03 Python 3.11.2 で確認
- 2020/10/28 Ver=1.01 Python 3.7.8 で確認
- 2018/11/08 Ver=1.01 初版リリース
- 関連ページ