|
|
matplotlib Text properties and layout. |
H.Kamifuji . |
- 目 次
- Text properties and layout
Matplotlib によるテキストのプロパティとそのレイアウトの制御
matplotlib.text.Text インスタンスには、テキストコマンドに対するキーワード引数( title() 、xlabel() 、text() など)を使用して設定できるさまざまなプロパティがあります。
Property Value Type alpha float backgroundcolor any matplotlib color bbox Rectangle prop dict plus key 'pad' which is a pad in points clip_box a matplotlib.transform.Bbox instance clip_on bool clip_path a Path instance and a Transform instance, a Patch color any matplotlib color family [ 'serif' | 'sans-serif' | 'cursive' | 'fantasy' | 'monospace' ] fontproperties a FontProperties instance horizontalalignment or ha [ 'center' | 'right' | 'left' ] label any string linespacing float multialignment ['left' | 'right' | 'center' ] name or fontname string e.g., ['Sans' | 'Courier' | 'Helvetica' ...] picker [None|float|boolean|callable] position (x, y) rotation [ angle in degrees | 'vertical' | 'horizontal' ] size or fontsize [ size in points | relative size, e.g., 'smaller', 'x-large' ] style or fontstyle [ 'normal' | 'italic' | 'oblique' ] text string or anything printable with '%s' conversion transform a Transform instance variant [ 'normal' | 'small-caps' ] verticalalignment or va [ 'center' | 'top' | 'bottom' | 'baseline' ] visible bool weight or fontweight [ 'normal' | 'bold' | 'heavy' | 'light' | 'ultrabold' | 'ultralight'] x float y float zorder any number
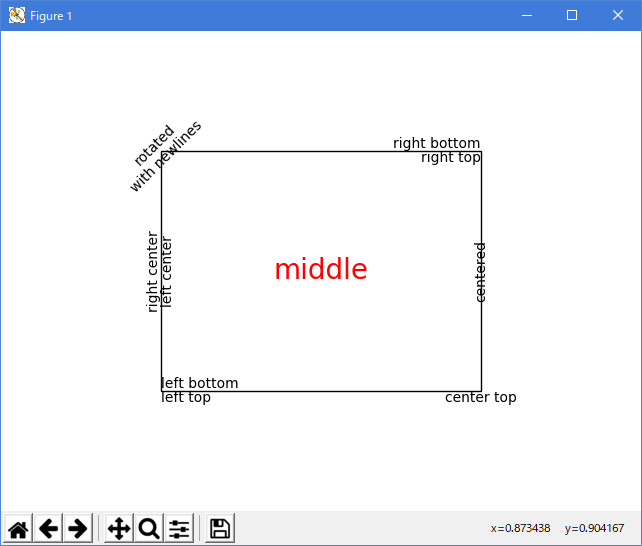
整列引数 horizontalalignment、verticalalignment、multialignment を使ってテキストをレイアウトすることができます。 horizontalalignment は、テキストのx位置引数がテキスト境界ボックスの左、中央、または右を示すかどうかを制御します。 verticalalignment は、テキストのy位置引数がテキスト境界ボックスの下部、中央、または上部を示すかどうかを制御します。 multialignment は、改行で区切られた文字列の場合のみ、異なる行を左揃え、中央揃え、または右揃えにするかどうかを制御します。 次に、text() コマンドを使用してさまざまな配置の可能性を示す例を示します。 コード全体で transform = ax.transAxes を使用すると、軸の左下を0,0、右上を1,1とした座標が軸の境界ボックスに相対的に与えられます。
import matplotlib.pyplot as plt
import matplotlib.patches as patches

# build a rectangle in axes coords
left, width = .25, .5
bottom, height = .25, .5
right = left + width
top = bottom + height

fig = plt.figure()
ax = fig.add_axes([0, 0, 1, 1])

# axes coordinates are 0,0 is bottom left and 1,1 is upper right
p = patches.Rectangle(
    (left, bottom), width, height,
    fill=False, transform=ax.transAxes, clip_on=False
    )

ax.add_patch(p)

ax.text(left, bottom, 'left top',
        horizontalalignment='left',
        verticalalignment='top',
        transform=ax.transAxes)

ax.text(left, bottom, 'left bottom',
        horizontalalignment='left',
        verticalalignment='bottom',
        transform=ax.transAxes)

ax.text(right, top, 'right bottom',
        horizontalalignment='right',
        verticalalignment='bottom',
        transform=ax.transAxes)

ax.text(right, top, 'right top',
        horizontalalignment='right',
        verticalalignment='top',
        transform=ax.transAxes)

ax.text(right, bottom, 'center top',
        horizontalalignment='center',
        verticalalignment='top',
        transform=ax.transAxes)

ax.text(left, 0.5*(bottom+top), 'right center',
        horizontalalignment='right',
        verticalalignment='center',
        rotation='vertical',
        transform=ax.transAxes)

ax.text(left, 0.5*(bottom+top), 'left center',
        horizontalalignment='left',
        verticalalignment='center',
        rotation='vertical',
        transform=ax.transAxes)

ax.text(0.5*(left+right), 0.5*(bottom+top), 'middle',
        horizontalalignment='center',
        verticalalignment='center',
        fontsize=20, color='red',
        transform=ax.transAxes)

ax.text(right, 0.5*(bottom+top), 'centered',
        horizontalalignment='center',
        verticalalignment='center',
        rotation='vertical',
        transform=ax.transAxes)

ax.text(left, top, 'rotated\nwith newlines',
        horizontalalignment='center',
        verticalalignment='center',
        rotation=45,
        transform=ax.transAxes)

ax.set_axis_off()

plt.show()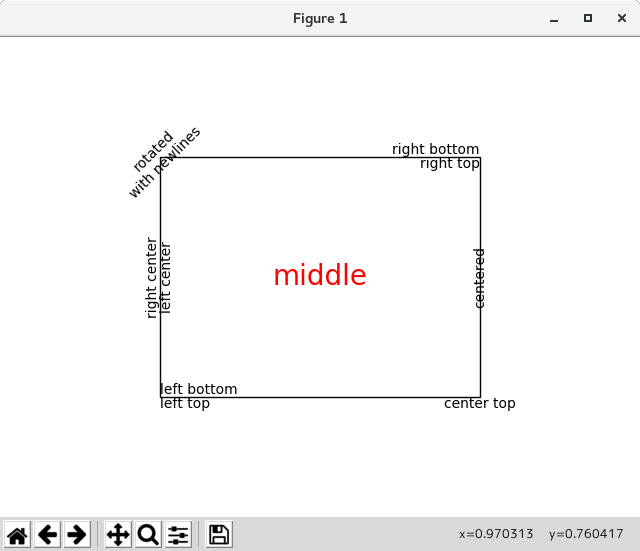
- Default Font
ベースのデフォルトフォントは、rcParams のセットによって制御されます。 数式のフォントを設定するには、mathtext で始まるrcParams を使用します(mathtext を参照)。
rcParam usage 'font.family' List of either names of font or {'cursive', 'fantasy', 'monospace', 'sans', 'sans serif', 'sans-serif', 'serif'}. 'font.style' The default style, ex 'normal', 'italic'. 'font.variant' Default variant, ex 'normal', 'small-caps' (untested) 'font.stretch' Default stretch, ex 'normal', 'condensed' (incomplete) 'font.weight' Default weight. Either string or integer 'font.size' Default font size in points. Relative font sizes ('large', 'x-small') are computed against this size.
({'cursive', 'fantasy', 'monospace', 'sans', 'sans serif', 'sans-serif', 'serif'}) と実際のフォント名の間のマッピングは、以下のrcParamsによって制御されます。
family alias rcParam with mappings 'serif' 'font.serif' 'monospace' 'font.monospace' 'fantasy' 'font.fantasy' 'cursive' 'font.cursive' {'sans', 'sans serif', 'sans-serif'} 'font.sans-serif'
フォント名のリストです。
- Text with non-latin glyphs
v2.0 では、 default font には多くの西洋のアルファベットのグリフが含まれていますが、mpl ユーザーが必要とするすべてのグリフをカバーするわけではありません。 たとえば、DejaVu には中国語、韓国語、または日本語が含まれていません。
既定のフォントを必要なコードポイントをサポートするフォントに設定するには、フォント名を 'font.family' または必要なエイリアスリストの前に追加します
matplotlib.rcParams['font.sans-serif'] = ['Source Han Sans TW', 'sans-serif']
.matplotlibrci ファイルで設定してください:
font.sans-serif: Source Han Sans TW, Arial, sans-serif
アーティストごとに使用されるフォントを制御するには、上記の 'name'、 'fontname' または 'fontproperties' kwargs を使用します。
linux では、fc-list はフォント名を見つけるのに便利なツールです。 例えば
$ fc-list :lang=ja family
WenQuanYi Micro Hei Mono,文泉驛等寬微米黑,文泉驿等宽微米黑
VL ゴシック,VL Gothic
VL Pゴシック,VL PGothic
WenQuanYi Micro Hei,文泉驛微米黑,文泉驿微米黑

$ fc-list :lang=en family
Clean
PT Sans
Century Schoolbook L
Carlito
Khmer OS System
PT Sans Narrow
DejaVu Sans Mono
Khmer OS Content
Open Sans,Open Sans Semibold
URW Palladio L
Cantarell
PakType Naskh Basic
URW Gothic L
URW Chancery L
FreeSerif
DejaVu Sans,DejaVu Sans Light
WenQuanYi Micro Hei Mono,文泉驛等寬微米黑,文泉驿等宽微米黑
DejaVu Sans
VL ゴシック,VL Gothic
DejaVu Serif,DejaVu Serif Condensed
Utopia
Bitstream Charter
DejaVu Sans,DejaVu Sans Condensed
Khmer OS
Courier 10 Pitch
Open Sans
Liberation Mono
WenQuanYi Zen Hei Mono,文泉驛等寬正黑,文泉驿等宽正黑
Nimbus Sans L
Caladea
AR PL UMing TW MBE
VL Pゴシック,VL PGothic
WenQuanYi Micro Hei,文泉驛微米黑,文泉驿微米黑
AR PL UMing HK
AR PL UMing CN
AR PL UMing TW
Nimbus Mono L
Liberation Serif
STIX
Nimbus Roman No9 L
WenQuanYi Zen Hei Sharp,文泉驛點陣正黑,文泉驿点阵正黑
Liberation Sans
Jomolhari
WenQuanYi Zen Hei,文泉驛正黑,文泉驿正黑
FreeSans
Fixed
Abyssinica SIL
Waree
Open Sans,Open Sans Light
Overpass
DejaVu Serif
Open Sans,Open Sans Extrabold
FreeMono
URW Bookman L

$ fc-list :lang=zh family
WenQuanYi Micro Hei Mono,文泉驛等寬微米黑,文泉驿等宽微米黑
WenQuanYi Zen Hei Mono,文泉驛等寬正黑,文泉驿等宽正黑
AR PL UMing TW MBE
WenQuanYi Micro Hei,文泉驛微米黑,文泉驿微米黑
AR PL UMing HK
AR PL UMing CN
AR PL UMing TW
WenQuanYi Zen Hei Sharp,文泉驛點陣正黑,文泉驿点阵正黑
WenQuanYi Zen Hei,文泉驛正黑,文泉驿正黑
日本語、英語および中国語をサポートするすべてのフォントを一覧表示します。
- 参照ページ
Text properties and layout
- リリースノート
- 2023/03/11 Ver=1.03 Python 3.11.2 で確認
- 2020/10/28 Ver=1.01 Python 3.7.8 で確認
- 2018/11/08 Ver=1.01 初版リリース
- 関連ページ