|
|
matplotlib Simple Axis Direction01. |
H.Kamifuji . |
- Simple Axis Direction01
import matplotlib.pyplot as plt
import mpl_toolkits.axisartist as axisartist

fig = plt.figure(figsize=(4, 2.5))
ax1 = fig.add_subplot(axisartist.Subplot(fig, "111"))
fig.subplots_adjust(right=0.8)

ax1.axis["left"].major_ticklabels.set_axis_direction("top")
ax1.axis["left"].label.set_text("Label")

ax1.axis["right"].label.set_visible(True)
ax1.axis["right"].label.set_text("Label")
ax1.axis["right"].label.set_axis_direction("left")

plt.show()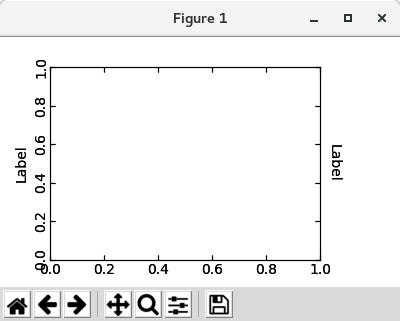
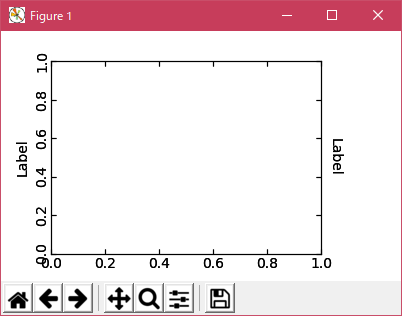
Python 3.11.2 見直しました。上記のコードでは、下記のエラーが発生します。
Traceback (most recent call last):
File "_:\Axis_Direction01_01.py", line 5, in
ax1 = fig.add_subplot(axisartist.Subplot(fig, "111"))
^^^^^^^^^^^^^^^^^^^^^^^^^^^^^^
File "C:\Users\_____\AppData\Local\Programs\Python\Python311\Lib\site-packages\mpl_toolkits\axisartist\axislines.py", line 444, in __init__
super().__init__(*args, **kwargs)
File "C:\Users\_____\AppData\Local\Programs\Python\Python311\Lib\site-packages\matplotlib\axes\_base.py", line 641, in __init__
self._position = mtransforms.Bbox.from_bounds(*args[0])
^^^^^^^^^^^^^^^^^^^^^^^^^^^^^^^^^^^^^^
TypeError: Bbox.from_bounds() missing 1 required positional argument: 'height'
import matplotlib.pyplot as plt import mpl_toolkits.axisartist as axisartist fig = plt.figure(figsize=(4, 2.5)) ax1 = fig.add_subplot(axes_class=axisartist.Axes) fig.subplots_adjust(right=0.8) ax1.axis["left"].major_ticklabels.set_axis_direction("top") ax1.axis["left"].label.set_text("Label") ax1.axis["right"].label.set_visible(True) ax1.axis["right"].label.set_text("Label") ax1.axis["right"].label.set_axis_direction("left") plt.show() 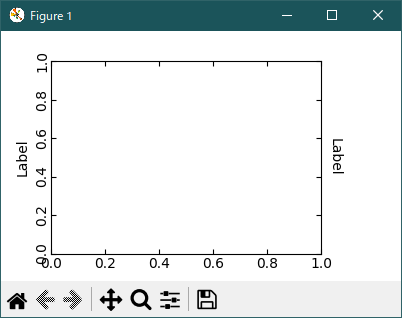
- 参照ページ
Simple Axis Direction01
- リリースノート
- 2023/03/26 Ver=1.03 Python 3.11.2 で確認
- 2020/10/28 Ver=1.01 Python 3.7.8 で確認
- 2018/11/08 Ver=1.01 初版リリース
- 関連ページ