|
|
JFreeChart を使ったグラフ作成 ウォーターフォールグラフ(WaterfallChart) |
H.Kamifuji . |
- はじめに
ウォーターフォールグラフ(WaterfallChart)の作成について確認します。ウォーターフォールグラフでは全体に占める割合を階段状のグラフとして表示する時に使われます。
当ページでは、Linux CentOS7 の Gnome で動作テストしています。
現在(2021/08)では、JDK-16.0.2 にアップされています。一部、上位互換について、見直しを行っていきます。
現在(2023/04)では、JDK-20.0.1 にアップされています。一部、上位互換について、見直しを行っていきます。
現在(2024/10)では、JDK-23 に、アップされています。JDK-23 + jfreechart-1.0.19 で、上位互換について、見直しを行っていきます。
- 目 次
- ウォーターフォールグラフの作成(createWaterfallChartメソッド)
[ 目次 ]
ウォーターフォールグラフの基本的な作成方法を確認します。
まずChartFactoryクラスの「createWaterfallChart」メソッドを使ってウォーターフォールグラフを扱うJFreeChartクラスのオブジェクトを作成します。
public static JFreeChart createWaterfallChart(java.lang.String title,
                                              java.lang.String categoryAxisLabel,
                                              java.lang.String valueAxisLabel,
                                              CategoryDataset dataset,
                                              PlotOrientation orientation,
                                              boolean legend,
                                              boolean tooltips,
                                              boolean urls)
Creates a waterfall chart. The chart object returned by this method uses a CategoryPlot instance as the plot, with a CategoryAxis for the domain axis, a NumberAxis as the range axis, and a WaterfallBarRenderer as the renderer.
Parameters:
title - the chart title (null permitted).
categoryAxisLabel - the label for the category axis (null permitted).
valueAxisLabel - the label for the value axis (null permitted).
dataset - the dataset for the chart (null permitted).
orientation - the plot orientation (horizontal or vertical) (null NOT permitted).
legend - a flag specifying whether or not a legend is required.
tooltips - configure chart to generate tool tips?
urls - configure chart to generate URLs?
Returns:
A waterfall chart.
1番目の引数にグラフのタイトルを文字列で指定します。
2番目の引数には項目を表す軸のラベルを文字列で指定します。3番目の引数には値を表す軸のラベルを文字列で指定します。
4番目の引数にはグラフのデータをCategoryDatasetインターフェースを実装したクラスのオブジェクトで指定します。今回はDefaultCategoryDatasetクラスを使います。詳細は次のページで確認します。
5番目の引数にはグラフの向きを指定します。指定可能な値はorg.jfree.chart.plot.PlotOrientationクラスで定義されており、次のどちらかとなります。
PlotOrientation.VERTICAL    デフォルト
PlotOrientation.HORIZONTAL  X軸とY軸が反転
6番目の引数には凡例を表示するかどうかを「true」か「false」で指定します。
7番目の引数にはツールチップを作成するかどうかを「true」か「false」で指定します。
8番目の引数にはURLを作成するかどうかを「true」か「false」で指定します。
実際の使い方は次のようになります。
DefaultCategoryDataset data = new DefaultCategoryDataset();
JFreeChart chart =
      ChartFactory.createWaterfallChart("売り上げ分析",
                                        "項目",
                                        "金額",
                                         data,
                                         PlotOrientation.VERTICAL,
                                         true,
                                         false,
                                         false);
実際のデータの追加方法は次のページで確認します。
では簡単なサンプルを作成して試してみます。
サンプルプログラム
下記のサンプルを実行してみよう。
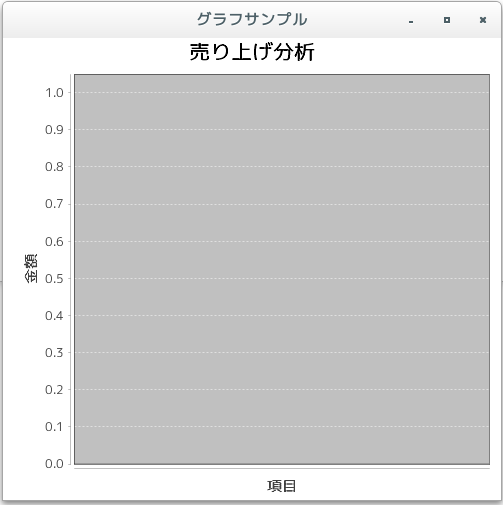
/**
 * ウォーターフォールグラフの作成(createWaterfallChartメソッド)
 */
import org.jfree.chart.JFreeChart;
import org.jfree.chart.ChartFactory;
import org.jfree.data.category.DefaultCategoryDataset;
import org.jfree.chart.plot.PlotOrientation;

import javax.swing.JFrame;
import java.awt.BorderLayout;
import org.jfree.chart.ChartPanel;

public class Test1_1 extends JFrame{
  public static void main(String[] args) {
    Test1_1 frame = new Test1_1();

    frame.setDefaultCloseOperation(JFrame.EXIT_ON_CLOSE);
    frame.setBounds(10, 10, 500, 500);
    frame.setTitle("グラフサンプル");
    frame.setVisible(true);
  }

  Test1_1(){
    DefaultCategoryDataset data = new DefaultCategoryDataset();
    JFreeChart chart = ChartFactory.createWaterfallChart("売り上げ分析",
                                                     "項目",
                                                     "金額",
                                                     data,
                                                     PlotOrientation.VERTICAL,
                                                     true,
                                                     false,
                                                     false);

    ChartPanel cpanel = new ChartPanel(chart);
    getContentPane().add(cpanel, BorderLayout.CENTER);
  }
}
上記をコンパイルした後で実行すると次のように表示されます。
- ウォーターフォールグラフのデータ(DefaultCategoryDatasetクラス)
[ 目次 ]
ウォーターフォールグラフではDefaultCategoryDatasetクラスを使います。
DefaultCategoryDatasetクラスについては棒グラフの場合と同じですので詳しくは「棒グラフのデータ(DefaultCategoryDataset)」を参照して下さい。
次のようにオブジェクトを作成します。
DefaultCategoryDataset data = new DefaultCategoryDataset();
データの登録
オブジェクトを作成したらデータを登録していきます。DefaultCategoryDatasetクラスで用意されている「addValue」メソッドを使います。
addValue
public void addValue(java.lang.Number value,
                     java.lang.Comparable rowKey,
                     java.lang.Comparable columnKey)
Adds a value to the table. Performs the same function as setValue().
Parameters:
value - the value.
rowKey - the row key.
columnKey - the column key.
ウォーターフォールグラフではデータ毎に値、系列、項目をセットにして1つのデータを登録します。「addValue」メソッドでは1番目の引数に値、2番目の引数に系列名、3番目の引数に項目名を指定します。
今回は例として次のようなデータを使用します。
A商品 売上 2400 売上原価 1300 販売管理費 700 営業外損益 150 経常利益 250
実際には次のように記述します。
DefaultCategoryDataset data = new DefaultCategoryDataset();

data.addValue(1300, "A商品", "売上原価");
data.addValue(700, "A商品", "販売管理費");
data.addValue(150, "A商品", "営業外損益");
data.addValue(250, "A商品", "経常利益");
data.addValue(2400, "A商品", "売上");
デフォルトでは最後のデータを除いたものが階段状に表示され、最後のデータが全体を表すことになります。詳しいグラフの形状はサンプルを見て下さい。
また複数の系列を扱う事も可能なようですが、使い方が今ひとつ分かりませんでした。
では簡単なサンプルを作成して試してみます。
サンプルプログラム
下記のサンプルを実行してみよう。
/**
 * ウォーターフォールグラフのデータ(DefaultCategoryDatasetクラス)
 */
import org.jfree.chart.JFreeChart;
import org.jfree.chart.ChartFactory;
import org.jfree.data.category.DefaultCategoryDataset;
import org.jfree.chart.plot.PlotOrientation;

import javax.swing.JFrame;
import java.awt.BorderLayout;
import org.jfree.chart.ChartPanel;

public class Test2_1 extends JFrame{
  public static void main(String[] args) {
    Test2_1 frame = new Test2_1();

    frame.setDefaultCloseOperation(JFrame.EXIT_ON_CLOSE);
    frame.setBounds(10, 10, 500, 500);
    frame.setTitle("グラフサンプル");
    frame.setVisible(true);
  }

  Test2_1(){
    DefaultCategoryDataset data = new DefaultCategoryDataset();
    JFreeChart chart = ChartFactory.createWaterfallChart("売り上げ分析",
                                                     "項目",
                                                     "金額",
                                                     createData(),
                                                     PlotOrientation.VERTICAL,
                                                     true,
                                                     false,
                                                     false);

    ChartPanel cpanel = new ChartPanel(chart);
    getContentPane().add(cpanel, BorderLayout.CENTER);
  }

  private DefaultCategoryDataset createData(){
    DefaultCategoryDataset data = new DefaultCategoryDataset();

    data.addValue(1300, "A商品", "売上原価");
    data.addValue(700, "A商品", "販売管理費");
    data.addValue(150, "A商品", "営業外損益");
    data.addValue(250, "A商品", "経常利益");
    data.addValue(2400, "A商品", "売上");

    return data;
  }
}
上記をコンパイルした後で実行すると次のように表示されます。

- グラフの向きを変更
[ 目次 ]
ウォーターフォールグラフではX軸とY軸の表示する位置を入れ替えて表示することが可能です。
「createWaterfallChart」メソッドを使ってオブジェクトを作成する時の5番目の引数で指定します。指定できる値は次のいずれかです。
PlotOrientation.VERTICAL
PlotOrientation.HORIZONTAL
PlotOrientation.VERTICALとPlotOrientation.HORIZONTALを指定した場合ではX軸とY軸の位置関係が入れ替わるだけです。
実際には次のように記述します。
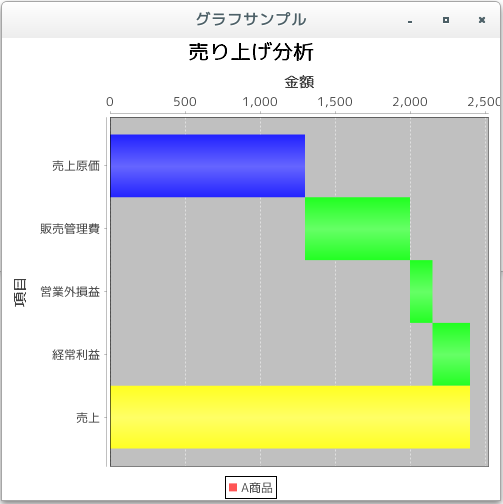
DefaultCategoryDataset data = new DefaultCategoryDataset();
JFreeChart chart =
     ChartFactory.createWaterfallChart("売り上げ分析",
                                       "項目",
                                       "金額",
                                       createData(),
                                       PlotOrientation.HORIZONTAL,
                                       true,
                                       false,
                                       false);
では簡単なサンプルを作成して試してみます。
サンプルプログラム
下記のサンプルを実行してみよう。
/**
 * グラフの向きを変更
 */
import org.jfree.chart.JFreeChart;
import org.jfree.chart.ChartFactory;
import org.jfree.data.category.DefaultCategoryDataset;
import org.jfree.chart.plot.PlotOrientation;

import javax.swing.JFrame;
import java.awt.BorderLayout;
import org.jfree.chart.ChartPanel;

public class Test3_1 extends JFrame{
  public static void main(String[] args) {
    Test3_1 frame = new Test3_1();

    frame.setDefaultCloseOperation(JFrame.EXIT_ON_CLOSE);
    frame.setBounds(10, 10, 500, 500);
    frame.setTitle("グラフサンプル");
    frame.setVisible(true);
  }

  Test3_1(){
    DefaultCategoryDataset data = new DefaultCategoryDataset();
    JFreeChart chart = ChartFactory.createWaterfallChart("売り上げ分析",
                                                     "項目",
                                                     "金額",
                                                     createData(),
                                                     PlotOrientation.HORIZONTAL,
                                                     true,
                                                     false,
                                                     false);

    ChartPanel cpanel = new ChartPanel(chart);
    getContentPane().add(cpanel, BorderLayout.CENTER);
  }

  private DefaultCategoryDataset createData(){
    DefaultCategoryDataset data = new DefaultCategoryDataset();

    data.addValue(1300, "A商品", "売上原価");
    data.addValue(700, "A商品", "販売管理費");
    data.addValue(150, "A商品", "営業外損益");
    data.addValue(250, "A商品", "経常利益");
    data.addValue(2400, "A商品", "売上");

    return data;
  }
}
上記をコンパイルした後で実行すると次のように表示されます。
- ウォーターフォールグラフの描画領域(CategoryPlotクラス)
[ 目次 ]
グラフの描画領域を取得し、描画領域に対する設定を行っていきます。ファクトリメソッドを使ってJFreeChartクラスのオブジェクトを作成した場合は、JFreeChartクラスで用意されている「getPlot」メソッドを使ってPlotクラスのオブジェクトを取得します。
ウォーターフォールグラフの場合には、取得したPlotクラスのオブジェクトを、PlotクラスのサブクラスであるCategoryPlotクラスにキャストして取得して使います。棒グラフの場合と同じですので、詳しくは「棒グラフの描画領域(CategoryPlotクラス)」を参照して下さい。
例えば次のように記述します。
JFreeChart chart = ChartFactory.createWaterfallChart(...);   /* 引数は省略 */

CategoryPlot plot = (CategoryPlot)chart.getPlot();
または次のように記述しても結構です。
JFreeChart chart = ChartFactory.createWaterfallChart(...);   /* 引数は省略 */

CategoryPlot plot = chart.getCategoryPlot();
では簡単なサンプルを作成して試してみます。
サンプルプログラム
下記のサンプルを実行してみよう。
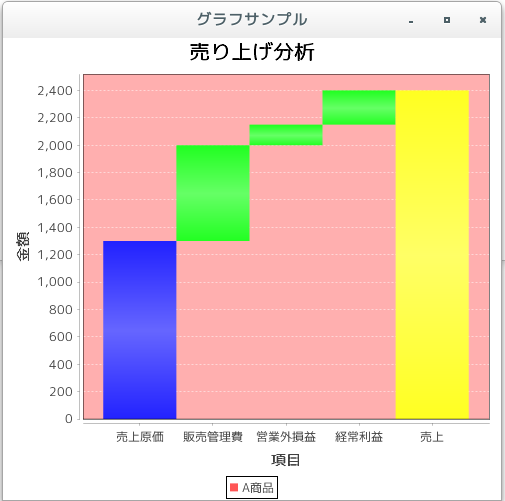
/**
 * ウォーターフォールグラフの描画領域(CategoryPlotクラス)
 */
import org.jfree.chart.JFreeChart;
import org.jfree.chart.ChartFactory;
import org.jfree.data.category.DefaultCategoryDataset;
import org.jfree.chart.plot.PlotOrientation;

import javax.swing.JFrame;
import java.awt.BorderLayout;
import org.jfree.chart.ChartPanel;

import org.jfree.chart.plot.CategoryPlot;
import java.awt.Color;

public class Test4_1 extends JFrame{
  public static void main(String[] args) {
    Test4_1 frame = new Test4_1();

    frame.setDefaultCloseOperation(JFrame.EXIT_ON_CLOSE);
    frame.setBounds(10, 10, 500, 500);
    frame.setTitle("グラフサンプル");
    frame.setVisible(true);
  }

  Test4_1(){
    DefaultCategoryDataset data = new DefaultCategoryDataset();
    JFreeChart chart = ChartFactory.createWaterfallChart("売り上げ分析",
                                                     "項目",
                                                     "金額",
                                                     createData(),
                                                     PlotOrientation.VERTICAL,
                                                     true,
                                                     false,
                                                     false);

    CategoryPlot plot = chart.getCategoryPlot();
    plot.setBackgroundPaint(Color.PINK);

    ChartPanel cpanel = new ChartPanel(chart);
    getContentPane().add(cpanel, BorderLayout.CENTER);
  }

  private DefaultCategoryDataset createData(){
    DefaultCategoryDataset data = new DefaultCategoryDataset();

    data.addValue(1300, "A商品", "売上原価");
    data.addValue(700, "A商品", "販売管理費");
    data.addValue(150, "A商品", "営業外損益");
    data.addValue(250, "A商品", "経常利益");
    data.addValue(2400, "A商品", "売上");

    return data;
  }
}
上記をコンパイルした後で実行すると次のように表示されます。
- リリースノート
[ 目次 ]- 2024/10/20 Ver=2.05 JDK_23 + jfreechart-1.0.19 で確認
- 2023/04/26 Ver=2.03 JDK_20 で確認
- 2021/08/08 Ver=1.03 JDK_16 で確認
- 2020/10/25 Ver=1.02 JDK_15 で確認
- 2017/02/18 Ver=1.01 初版リリース
- 関連ページ
[ 目次 ]