|
|
JFreeChart を使ったグラフ作成 棒グラフ(BarChart, BarChart3D) |
H.Kamifuji . |
- はじめに
棒グラフの作成に関して確認します。
当ページでは、Linux CentOS7 の Gnome で動作テストしています。
現在(2021/08)では、JDK-16.0.2 にアップされています。一部、上位互換について、見直しを行っていきます。
現在(2023/04)では、JDK-20.0.1 にアップされています。一部、上位互換について、見直しを行っていきます。
現在(2024/10)では、JDK-23 に、アップされています。JDK-23 + jfreechart-1.0.19 で、上位互換について、見直しを行っていきます。
- 目 次
-
棒グラフの作成(createBarChartメソッド)
[ 目次 ]
棒グラフの基本的な作成方法を確認します。
まずChartFactoryクラスの「createBarChart」メソッドを使って棒グラフを扱うJFreeChartクラスのオブジェクトを作成します。
createBarChart
public static JFreeChart createBarChart(java.lang.String title,
                                        java.lang.String categoryAxisLabel,
                                        java.lang.String valueAxisLabel,
                                        CategoryDataset dataset,
                                        PlotOrientation orientation,
                                        boolean legend,
                                        boolean tooltips,
                                        boolean urls)
Creates a bar chart. The chart object returned by this method uses a CategoryPlot instance as the plot, with a CategoryAxis for the domain axis, a NumberAxis as the range axis, and a BarRenderer as the renderer.
Parameters:
title - the chart title (null permitted).
categoryAxisLabel - the label for the category axis (null permitted).
valueAxisLabel - the label for the value axis (null permitted).
dataset - the dataset for the chart (null permitted).
orientation - the plot orientation (horizontal or vertical) (null not permitted).
legend - a flag specifying whether or not a legend is required.
tooltips - configure chart to generate tool tips?
urls - configure chart to generate URLs?
Returns:
A bar chart.
1番目の引数にグラフのタイトルを文字列で指定します。
2番目の引数には項目が配置される軸のラベルを文字列で指定します。3番目の引数には値が配置される軸のラベルを文字列で指定します。
4番目の引数にはグラフのデータをCategoryDatasetインターフェースを実装したクラスのオブジェクトで指定します。今回はDefaultCategoryDatasetクラスを使います。詳細は次のページで確認します。
5番目の引数には棒グラフの向きを指定します。指定可能な値はorg.jfree.chart.plot.PlotOrientationクラスで定義されており、次のどちらかとなります。
PlotOrientation.VERTICAL    値を表す軸がY軸
PlotOrientation.HORIZONTAL  値を表す軸がX軸
6番目の引数には凡例を表示するかどうかを「true」か「false」で指定します。
7番目の引数にはツールチップを作成するかどうかを「true」か「false」で指定します。
8番目の引数にはURLを作成するかどうかを「true」か「false」で指定します。
実際の使い方は次のようになります。
DefaultCategoryDataset data = new DefaultCategoryDataset();
JFreeChart chart = ChartFactory.createBarChart("月別売上",
                                               "月",
                                               "売上",
                                               data,
                                               PlotOrientation.VERTICAL,
                                               true,
                                               false,
                                               false);
実際のデータの追加方法は次のページで確認します。
では簡単なサンプルを作成して試してみます。
サンプルプログラム
下記のサンプルを実行してみよう。
/**
 * 棒グラフの作成(createBarChartメソッド)
 */
import org.jfree.chart.JFreeChart;
import org.jfree.chart.ChartFactory;
import org.jfree.data.category.DefaultCategoryDataset;
import org.jfree.chart.plot.PlotOrientation;

import javax.swing.JFrame;
import java.awt.BorderLayout;
import org.jfree.chart.ChartPanel;

public class Test1_1 extends JFrame{
  public static void main(String[] args) {
    Test1_1 frame = new Test1_1();

    frame.setDefaultCloseOperation(JFrame.EXIT_ON_CLOSE);
    frame.setBounds(10, 10, 500, 500);
    frame.setTitle("グラフサンプル");
    frame.setVisible(true);
  }

  Test1_1(){
    DefaultCategoryDataset data = new DefaultCategoryDataset();
    JFreeChart chart =
      ChartFactory.createBarChart("月別売上",
                                  "月",
                                  "売上",
                                  data,
                                  PlotOrientation.VERTICAL,
                                  true,
                                  false,
                                  false);

    ChartPanel cpanel = new ChartPanel(chart);
    getContentPane().add(cpanel, BorderLayout.CENTER);
  }
}
上記をコンパイルした後で実行すると次のように表示されます。
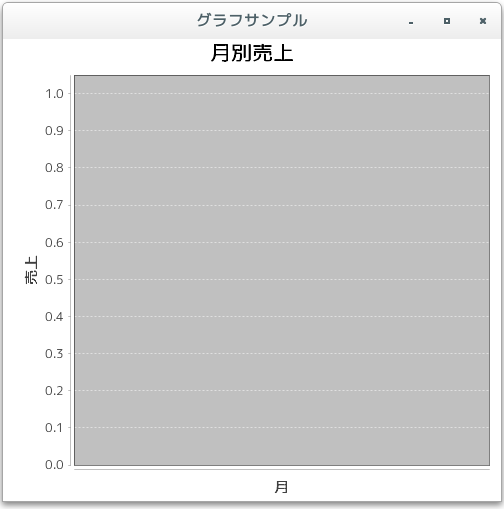
現状ではグラフのデータが含まれていませんので凡例なども表示されていません。
- 棒グラフのデータ(DefaultCategoryDataset)
[ 目次 ]
棒グラフのデータはDefaultCategoryDatasetクラスを使って表します。
DefaultCategoryDatasetクラスのクラス図は次のようになっています。
java.lang.Object
 |
 +-- org.jfree.data.general.AbstractDataset
      |
      +-- org.jfree.data.category.DefaultCategoryDataset

public class DefaultCategoryDataset extends AbstractDataset implements CategoryDataset,
    org.jfree.util.PublicCloneable, java.io.Serializable
コンストラクタは1つだけ用意されています。
DefaultCategoryDataset
public DefaultCategoryDataset()
Creates a new (empty) dataset.
デフォルトのコンストラクタのみです。次のようにオブジェクトを作成します。
DefaultCategoryDataset data = new DefaultCategoryDataset();
データの登録
オブジェクトを作成したらデータを登録していきます。DefaultCategoryDatasetクラスで用意されている「addValue」メソッドを使います。
addValue
public void addValue(java.lang.Number value,
                     java.lang.Comparable rowKey,
                     java.lang.Comparable columnKey)
Adds a value to the table. Performs the same function as setValue().
Parameters:
value - the value.
rowKey - the row key.
columnKey - the column key.
棒グラフの場合には、値、系列、項目をセットにしてデータを登録していきます。「addValue」メソッドでは1番目の引数に値、2番目の引数に系列名、3番目の引数に項目名を指定します。
ここでは例として次のようなデータを元にグラフを作成します。
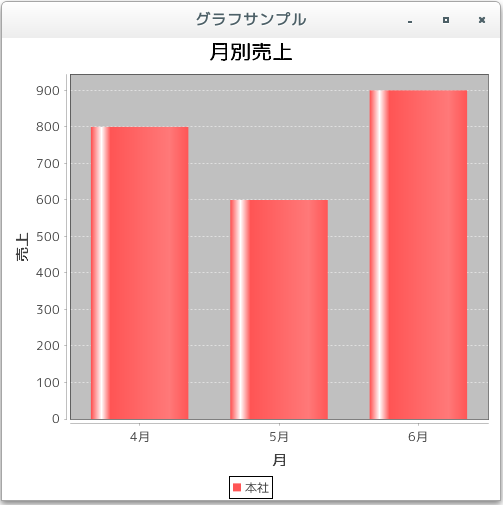
本社 4月 800 5月 600 6月 900
今回は系列が1つですので、実際には次のようになります。
DefaultCategoryDataset data = new DefaultCategoryDataset();
data.addValue(800, "本社", "4月");
data.addValue(600, "本社", "5月");
data.addValue(900, "本社", "6月");
複数の系列については次のページで確認します。
では簡単なサンプルを作成して試してみます。
サンプルプログラム
下記のサンプルを実行してみよう。
/**
 * 棒グラフのデータ(DefaultCategoryDataset)
 */
import org.jfree.chart.JFreeChart;
import org.jfree.chart.ChartFactory;
import org.jfree.data.category.DefaultCategoryDataset;
import org.jfree.chart.plot.PlotOrientation;

import javax.swing.JFrame;
import java.awt.BorderLayout;
import org.jfree.chart.ChartPanel;

public class Test2_1 extends JFrame{
  public static void main(String[] args) {
    Test2_1 frame = new Test2_1();

    frame.setDefaultCloseOperation(JFrame.EXIT_ON_CLOSE);
    frame.setBounds(10, 10, 500, 500);
    frame.setTitle("グラフサンプル");
    frame.setVisible(true);
  }

  Test2_1(){
    DefaultCategoryDataset data = new DefaultCategoryDataset();
    data.addValue(800, "本社", "4月");
    data.addValue(600, "本社", "5月");
    data.addValue(900, "本社", "6月");

    JFreeChart chart =
      ChartFactory.createBarChart("月別売上",
                                  "月",
                                  "売上",
                                  data,
                                  PlotOrientation.VERTICAL,
                                  true,
                                  false,
                                  false);

    ChartPanel cpanel = new ChartPanel(chart);
    getContentPane().add(cpanel, BorderLayout.CENTER);
  }
}
上記をコンパイルした後で実行すると次のように表示されます。
- 複数の系列のデータ
[ 目次 ]
棒グラフの場合は複数の系列のデータを取り扱う事が可能です。
ここでは例として次のようなデータを元にグラフを作成します。
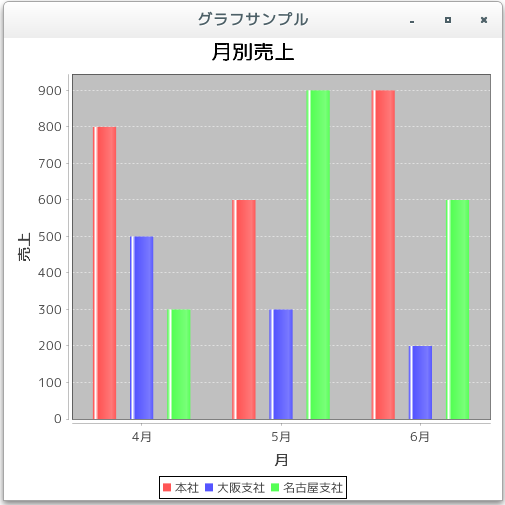
本社 大阪支社 名古屋支社 4月 800 500 300 5月 600 300 900 6月 900 200 600
複数の系列の場合も手順は同じです。データの数だけ「addValue」メソッドを実行します。「addValue」メソッドの引数は次の通りとなっていました。
addValue(値, 系列, 項目)
先ほどのデータであれば次のように記述します。
DefaultCategoryDataset data = new DefaultCategoryDataset();
String[] series = {"本社", "大阪支社", "名古屋支社"};
String[] category = {"4月", "5月", "6月"};

data.addValue(800, series[0], category[0]);
data.addValue(600, series[0], category[1]);
data.addValue(900, series[0], category[2]);
data.addValue(500, series[1], category[0]);
data.addValue(300, series[1], category[1]);
data.addValue(200, series[1], category[2]);
data.addValue(300, series[2], category[0]);
data.addValue(900, series[2], category[1]);
data.addValue(600, series[2], category[2]);
では簡単なサンプルを作成して試してみます。
サンプルプログラム
下記のサンプルを実行してみよう。
/**
 * 複数の系列のデータ
 */
import org.jfree.chart.JFreeChart;
import org.jfree.chart.ChartFactory;
import org.jfree.data.category.DefaultCategoryDataset;
import org.jfree.chart.plot.PlotOrientation;

import javax.swing.JFrame;
import java.awt.BorderLayout;
import org.jfree.chart.ChartPanel;

public class Test3_1 extends JFrame{
  public static void main(String[] args) {
    Test3_1 frame = new Test3_1();

    frame.setDefaultCloseOperation(JFrame.EXIT_ON_CLOSE);
    frame.setBounds(10, 10, 500, 500);
    frame.setTitle("グラフサンプル");
    frame.setVisible(true);
  }

  Test3_1(){
    DefaultCategoryDataset data = new DefaultCategoryDataset();
    String[] series = {"本社", "大阪支社", "名古屋支社"};
    String[] category = {"4月", "5月", "6月"};

    data.addValue(800, series[0], category[0]);
    data.addValue(600, series[0], category[1]);
    data.addValue(900, series[0], category[2]);
    data.addValue(500, series[1], category[0]);
    data.addValue(300, series[1], category[1]);
    data.addValue(200, series[1], category[2]);
    data.addValue(300, series[2], category[0]);
    data.addValue(900, series[2], category[1]);
    data.addValue(600, series[2], category[2]);

    JFreeChart chart =
      ChartFactory.createBarChart("月別売上",
                                  "月",
                                  "売上",
                                  data,
                                  PlotOrientation.VERTICAL,
                                  true,
                                  false,
                                  false);

    ChartPanel cpanel = new ChartPanel(chart);
    getContentPane().add(cpanel, BorderLayout.CENTER);
  }
}
上記をコンパイルした後で実行すると次のように表示されます。
- グラフの向きを変更
[ 目次 ]
棒グラフではグラフの向きとして値を表す軸をY軸とX軸で選択することが可能です。どちらを使用するかは「createAreaChart」メソッドの5番目の引数で指定します。
垂直方向であれば「PlotOrientation.VERTICAL」を指定します。例えば次のように記述します。
DefaultCategoryDataset data = new DefaultCategoryDataset();
JFreeChart chart = ChartFactory.createBarChart("月別売上",
                                               "月",
                                               "売上",
                                               data,
                                               PlotOrientation.VERTICAL,
                                               true,
                                               false,
                                               false);
水平方向であれば「PlotOrientation.HORIZONTAL」を指定します。例えば次のように記述します。
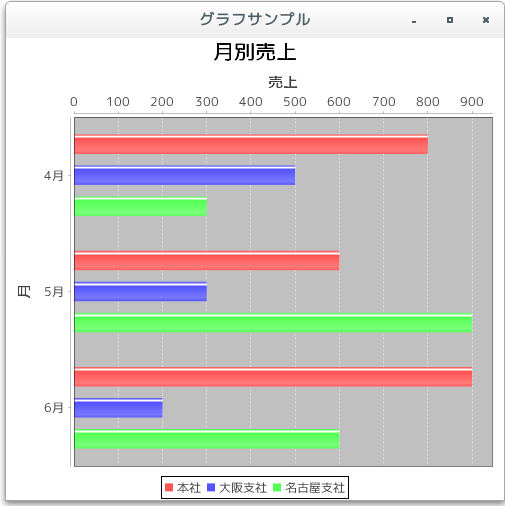
DefaultCategoryDataset data = new DefaultCategoryDataset();
JFreeChart chart = ChartFactory.createBarChart("月別売上",
                                               "月",
                                               "売上",
                                               data,
                                               PlotOrientation.HORIZONTAL,
                                               true,
                                               false,
                                               false);
この時、あくまで棒グラフの棒の頂点が表すのは値として設定したデータです。その為、棒グラフの棒の向きを変えたからといって棒グラフが表現する対象は値のままです。また各軸に表示されるラベルもX軸やY軸といった指定ではなく、「項目が配置される軸に対するラベル」のような指定方法ですので、棒グラフの向きに合わせてその他の設定を変更する必要はありません。
では簡単なサンプルを作成して試してみます。
サンプルプログラム
下記のサンプルを実行してみよう。
/**
 * グラフの向きを変更
 */
import org.jfree.chart.JFreeChart;
import org.jfree.chart.ChartFactory;
import org.jfree.data.category.DefaultCategoryDataset;
import org.jfree.chart.plot.PlotOrientation;

import javax.swing.JFrame;
import java.awt.BorderLayout;
import org.jfree.chart.ChartPanel;

public class Test4_1 extends JFrame{
  public static void main(String[] args) {
    Test4_1 frame = new Test4_1();

    frame.setDefaultCloseOperation(JFrame.EXIT_ON_CLOSE);
    frame.setBounds(10, 10, 500, 500);
    frame.setTitle("グラフサンプル");
    frame.setVisible(true);
  }

  Test4_1(){
    DefaultCategoryDataset data = new DefaultCategoryDataset();
    String[] series = {"本社", "大阪支社", "名古屋支社"};
    String[] category = {"4月", "5月", "6月"};

    data.addValue(800, series[0], category[0]);
    data.addValue(600, series[0], category[1]);
    data.addValue(900, series[0], category[2]);
    data.addValue(500, series[1], category[0]);
    data.addValue(300, series[1], category[1]);
    data.addValue(200, series[1], category[2]);
    data.addValue(300, series[2], category[0]);
    data.addValue(900, series[2], category[1]);
    data.addValue(600, series[2], category[2]);

    JFreeChart chart =
      ChartFactory.createBarChart("月別売上",
                                  "月",
                                  "売上",
                                  data,
                                  PlotOrientation.HORIZONTAL,
                                  true,
                                  false,
                                  false);

    ChartPanel cpanel = new ChartPanel(chart);
    getContentPane().add(cpanel, BorderLayout.CENTER);
  }
}
上記をコンパイルした後で実行すると次のように表示されます。
- 3D棒グラフの作成(createBarChart3Dメソッド)
[ 目次 ]
棒グラフでは棒を立体的にした3D棒グラフも利用することが出来ます。
まずChartFactoryクラスの「createBarChart3D」メソッドを使って棒グラフを扱うJFreeChartクラスのオブジェクトを作成します。
createBarChart3D
public static JFreeChart createBarChart3D(java.lang.String title,
                                          java.lang.String categoryAxisLabel,
                                          java.lang.String valueAxisLabel,
                                          CategoryDataset dataset,
                                          PlotOrientation orientation,
                                          boolean legend,
                                          boolean tooltips,
                                          boolean urls)
Creates a bar chart with a 3D effect. The chart object returned by this method uses a CategoryPlot instance as the plot, with a CategoryAxis3D for the domain axis, a NumberAxis3D as the range axis, and a BarRenderer3D as the renderer.
Parameters:
title - the chart title (null permitted).
categoryAxisLabel - the label for the category axis (null permitted).
valueAxisLabel - the label for the value axis (null permitted).
dataset - the dataset for the chart (null permitted).
orientation - the plot orientation (horizontal or vertical) (null not permitted).
legend - a flag specifying whether or not a legend is required.
tooltips - configure chart to generate tool tips?
urls - configure chart to generate URLs?
Returns:
A bar chart with a 3D effect.
1番目の引数にグラフのタイトルを文字列で指定します。
2番目の引数には項目が配置される軸のラベルを文字列で指定します。3番目の引数には値が配置される軸のラベルを文字列で指定します。
4番目の引数にはグラフのデータをCategoryDatasetインターフェースを実装したクラスのオブジェクトで指定します。今回はDefaultCategoryDatasetクラスを使います。詳細は次のページで確認します。
5番目の引数には棒グラフの向きを指定します。指定可能な値はorg.jfree.chart.plot.PlotOrientationクラスで定義されており、次のどちらかとなります。
PlotOrientation.HORIZONTAL
PlotOrientation.VERTICAL
6番目の引数には凡例を表示するかどうかを「true」か「false」で指定します。
7番目の引数にはツールチップを作成するかどうかを「true」か「false」で指定します。
8番目の引数にはURLを作成するかどうかを「true」か「false」で指定します。
実際の使い方は次のようになります。
DefaultCategoryDataset data = new DefaultCategoryDataset();
JFreeChart chart = ChartFactory.createBarChart3D("月別売上",
                                                 "月",
                                                 "売上",
                                                 data,
                                                 PlotOrientation.VERTICAL,
                                                 true,
                                                 false,
                                                 false);
データの登録
データの登録は棒グラフの場合と同じくDefaultCategoryDatasetクラスを使用します。
本社 大阪支社 名古屋支社 4月 800 500 300 5月 600 300 900 6月 900 200 600
実際には次のように記述します。
DefaultCategoryDataset data = new DefaultCategoryDataset();
String[] series = {"本社", "大阪支社", "名古屋支社"};
String[] category = {"4月", "5月", "6月"};

data.addValue(800, series[0], category[0]);
data.addValue(600, series[0], category[1]);
data.addValue(900, series[0], category[2]);
data.addValue(500, series[1], category[0]);
data.addValue(300, series[1], category[1]);
data.addValue(200, series[1], category[2]);
data.addValue(300, series[2], category[0]);
data.addValue(900, series[2], category[1]);
data.addValue(600, series[2], category[2]);
では簡単なサンプルを作成して試してみます。
サンプルプログラム
下記のサンプルを実行してみよう。
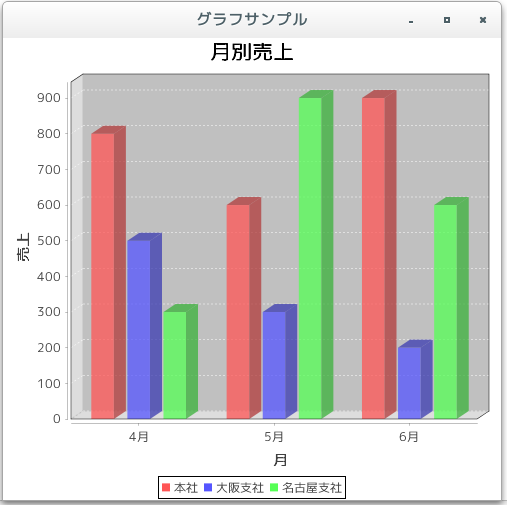
/**
 * 3D棒グラフの作成(createBarChart3Dメソッド)
 */
import org.jfree.chart.JFreeChart;
import org.jfree.chart.ChartFactory;
import org.jfree.data.category.DefaultCategoryDataset;
import org.jfree.chart.plot.PlotOrientation;

import javax.swing.JFrame;
import java.awt.BorderLayout;
import org.jfree.chart.ChartPanel;

public class Test5_1 extends JFrame{
  public static void main(String[] args) {
    Test5_1 frame = new Test5_1();

    frame.setDefaultCloseOperation(JFrame.EXIT_ON_CLOSE);
    frame.setBounds(10, 10, 500, 500);
    frame.setTitle("グラフサンプル");
    frame.setVisible(true);
  }

  Test5_1(){
    DefaultCategoryDataset data = new DefaultCategoryDataset();
    String[] series = {"本社", "大阪支社", "名古屋支社"};
    String[] category = {"4月", "5月", "6月"};

    data.addValue(800, series[0], category[0]);
    data.addValue(600, series[0], category[1]);
    data.addValue(900, series[0], category[2]);
    data.addValue(500, series[1], category[0]);
    data.addValue(300, series[1], category[1]);
    data.addValue(200, series[1], category[2]);
    data.addValue(300, series[2], category[0]);
    data.addValue(900, series[2], category[1]);
    data.addValue(600, series[2], category[2]);

    JFreeChart chart =
      ChartFactory.createBarChart3D("月別売上",
                                    "月",
                                    "売上",
                                    data,
                                    PlotOrientation.VERTICAL,
                                    true,
                                    false,
                                    false);

    ChartPanel cpanel = new ChartPanel(chart);
    getContentPane().add(cpanel, BorderLayout.CENTER);
  }
}
上記をコンパイルした後で実行すると次のように表示されます。
もう一つサンプルを試します。今度はグラフの向きを変えてみます。
サンプルプログラム
下記のサンプルを実行してみよう。
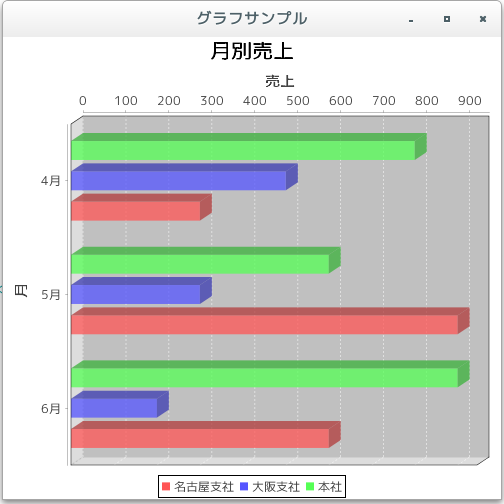
/**
 * 3D棒グラフの作成(createBarChart3Dメソッド)
 */
import org.jfree.chart.JFreeChart;
import org.jfree.chart.ChartFactory;
import org.jfree.data.category.DefaultCategoryDataset;
import org.jfree.chart.plot.PlotOrientation;

import javax.swing.JFrame;
import java.awt.BorderLayout;
import org.jfree.chart.ChartPanel;

public class Test5_2 extends JFrame{
  public static void main(String[] args) {
    Test5_2 frame = new Test5_2();

    frame.setDefaultCloseOperation(JFrame.EXIT_ON_CLOSE);
    frame.setBounds(10, 10, 500, 500);
    frame.setTitle("グラフサンプル");
    frame.setVisible(true);
  }

  Test5_2(){
    DefaultCategoryDataset data = new DefaultCategoryDataset();
    String[] series = {"本社", "大阪支社", "名古屋支社"};
    String[] category = {"4月", "5月", "6月"};

    data.addValue(800, series[0], category[0]);
    data.addValue(600, series[0], category[1]);
    data.addValue(900, series[0], category[2]);
    data.addValue(500, series[1], category[0]);
    data.addValue(300, series[1], category[1]);
    data.addValue(200, series[1], category[2]);
    data.addValue(300, series[2], category[0]);
    data.addValue(900, series[2], category[1]);
    data.addValue(600, series[2], category[2]);

    JFreeChart chart =
      ChartFactory.createBarChart3D("月別売上",
                                    "月",
                                    "売上",
                                    data,
                                    PlotOrientation.HORIZONTAL,
                                    true,
                                    false,
                                    false);

    ChartPanel cpanel = new ChartPanel(chart);
    getContentPane().add(cpanel, BorderLayout.CENTER);
  }
}
上記をコンパイルした後で実行すると次のように表示されます。
- 棒グラフの描画領域(CategoryPlotクラス)
[ 目次 ]
グラフの描画領域を取得し、描画領域に対する設定を行っていきます。ファクトリメソッドを使ってJFreeChartクラスのオブジェクトを作成した場合は、JFreeChartクラスで用意されている「getPlot」メソッドを使ってPlotクラスのオブジェクトを取得します。
getPlot
public Plot getPlot()
Returns the plot for the chart. The plot is a class responsible for coordinating the visual representation of the data, including the axes (if any).
Returns:
The plot.
棒グラフの場合には、取得したPlotクラスのオブジェクトを、PlotクラスのサブクラスであるCategoryPlotクラスにキャストして取得して使います。例えば次のように記述します。
JFreeChart chart = ChartFactory.createBarChart(...);      /* 引数は省略 */

CategoryPlot plot = (CategoryPlot)chart.getPlot();
またCategoryPlotクラスのオブジェクトを取得する場合には「getPlot」メソッドの代わりに「getCategoryPlot」メソッドを使って直接CategoryPlotクラスのオブジェクトを取得することも可能です。
getCategoryPlot
public CategoryPlot getCategoryPlot()
Returns the plot cast as a CategoryPlot.
NOTE: if the plot is not an instance of CategoryPlot, then a ClassCastException is thrown.
Returns:
The plot.
例えば次のように記述します。
JFreeChart chart = ChartFactory.createBarChart(...);      /* 引数は省略 */

CategoryPlot plot = chart.getCategoryPlot();
ではCategoryPlotクラスについて確認します。
CategoryPlotクラス
CategoryPlotクラスのクラス図は次のようになっています。
java.lang.Object
 |
 +-- org.jfree.chart.plot.Plot
      |
      +-- org.jfree.chart.plot.CategoryPlot

public class CategoryPlot extends Plot implements ValueAxisPlot, Zoomable, RendererChangeListener,
     java.lang.Cloneable, org.jfree.util.PublicCloneable, java.io.Serializable
用意されているコンストラクタは次の2つです。
コンストラクタ CategoryPlot()
Default constructor.CategoryPlot(CategoryDataset dataset, CategoryAxis domainAxis, ValueAxis rangeAxis, CategoryItemRenderer renderer)
Creates a new plot.
今回はコンストラクタでオブジェクトを直接生成するのではなく、JFreeChartクラスの「getPlot」メソッドでオブジェクトを取得します。
取得したCategoryPlotクラスのオブジェクトは棒グラフの描画領域を表すオブジェクトです。CategoryPlotクラスで定義されているメソッドや、親クラスのPlotクラスで用意されているメソッドを使用して描画領域に対する設定を行うことが可能です。
では簡単なサンプルを作成して試してみます。
サンプルプログラム
下記のサンプルを実行してみよう。
/**
 * 棒グラフの描画領域(CategoryPlotクラス)
 */
import org.jfree.chart.JFreeChart;
import org.jfree.chart.ChartFactory;
import org.jfree.data.category.DefaultCategoryDataset;
import org.jfree.chart.plot.PlotOrientation;

import javax.swing.JFrame;
import java.awt.BorderLayout;
import org.jfree.chart.ChartPanel;

import org.jfree.chart.plot.CategoryPlot;
import java.awt.Color;

public class Test6_1 extends JFrame{
  public static void main(String[] args) {
    Test6_1 frame = new Test6_1();

    frame.setDefaultCloseOperation(JFrame.EXIT_ON_CLOSE);
    frame.setBounds(10, 10, 500, 500);
    frame.setTitle("グラフサンプル");
    frame.setVisible(true);
  }

  Test6_1(){
    JFreeChart chart =
      ChartFactory.createBarChart("月別売上",
                                  "月",
                                  "売上",
                                  createData(),
                                  PlotOrientation.VERTICAL,
                                  true,
                                  false,
                                  false);

    CategoryPlot plot = chart.getCategoryPlot();
    plot.setBackgroundPaint(Color.ORANGE);

    ChartPanel cpanel = new ChartPanel(chart);
    getContentPane().add(cpanel, BorderLayout.CENTER);
  }

  private DefaultCategoryDataset createData(){
    DefaultCategoryDataset data = new DefaultCategoryDataset();
    String[] series = {"本社", "大阪支社", "名古屋支社"};
    String[] category = {"4月", "5月", "6月"};

    data.addValue(800, series[0], category[0]);
    data.addValue(600, series[0], category[1]);
    data.addValue(900, series[0], category[2]);
    data.addValue(500, series[1], category[0]);
    data.addValue(300, series[1], category[1]);
    data.addValue(200, series[1], category[2]);
    data.addValue(300, series[2], category[0]);
    data.addValue(900, series[2], category[1]);
    data.addValue(600, series[2], category[2]);

    return data;
  }
}
上記をコンパイルした後で実行すると次のように表示されます。
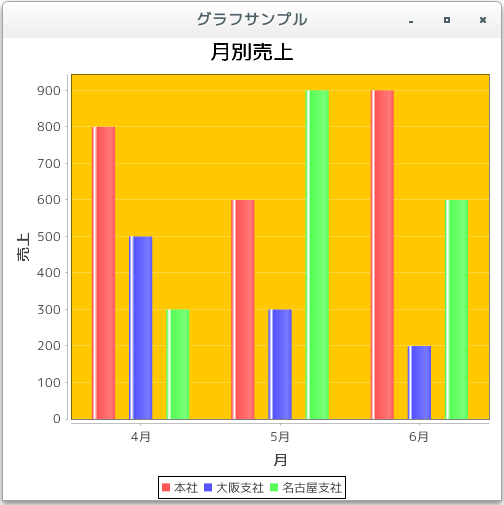
今回は例として描画領域の背景色をオレンジに変更しました。また上記のオレンジの箇所がグラフの描画領域となります。
- リリースノート
[ 目次 ]- 2024/10/20 Ver=2.05 JDK_23 + jfreechart-1.0.19 で確認
- 2023/04/25 Ver=2.03 JDK_20 で確認
- 2021/08/08 Ver=1.03 JDK_16 で確認
- 2020/10/25 Ver=1.02 JDK_15 で確認
- 2017/02/12 Ver=1.01 初版リリース
- 関連ページ
[ 目次 ]