|
|
JFreeChart を使ったグラフ作成 描画領域の設定 |
H.Kamifuji . |
- はじめに
グラフの描画領域に関する設定方法を確認していきます。ここでは各グラフで共通して利用可能なPlotクラスに関する設定について見ていきます。
当ページでは、Linux CentOS7 の Gnome で動作テストしています。
現在(2021/08)では、JDK-16.0.2 にアップされています。一部、上位互換について、見直しを行っていきます。
現在(2023/04)では、JDK-20.0.1 にアップされています。一部、上位互換について、見直しを行っていきます。
現在(2024/10)では、JDK-23 に、アップされています。JDK-23 + jfreechart-1.0.19 で、上位互換について、見直しを行っていきます。
- 目 次
- Plotクラス
[ 目次 ]
JFreeChartではタイトルや凡例の他に実際にグラフが表示されるグラフの描画領域があります。描画領域にはグラフそのものの他に軸などが含まれます。そして描画領域はPlotクラスのオブジェクトを使って表されます。
まずはPlotクラスについて確認します。Plotクラスのクラス図は次のようになっています。
java.lang.Object
  |
  +-- org.jfree.chart.plot.Plot

public abstract class Plot extends java.lang.Object implements AxisChangeListener,
  DatasetChangeListener, MarkerChangeListener, LegendItemSource, org.jfree.util.PublicCloneable,
  java.lang.Cloneable, java.io.Serializable
Plotクラスはabstractクラスですので直接オブジェクトを作成することは出来ません。Plotクラスを継承して独自のクラスを定義するか、既に用意されているabstractを使用します。
用意されているabstractは次の通りです。
CategoryPlot
CompassPlot
ContourPlot
DialPlot
FastScatterPlot
MeterPlot
MultiplePiePlot
PiePlot
PolarPlot
SpiderWebPlot
ThermometerPlot
WaferMapPlot
XYPlot
ファクトリメソッドを使って用意されたグラフを使用する場合、上記のいずれかのサブクラスを実際には使っています。使用するサブクラスによって独自のメソッドなどが用意されておりグラフ毎に描画領域に対して行える設定は異なりますが、次のページ以降では大元となるPlotクラスで用意されているメソッドの使い方について確認していきます。
Plotクラスのオブジェクトの取得
現在表示されているグラフの描画領域を表すPlotクラスのオブジェクトはJFreeChartクラスで用意されている「getPlot」メソッドを使って取得できます。
getPlot
public Plot getPlot()
Returns the plot for the chart. The plot is a class responsible for coordinating the visual representation of the data, including the axes (if any).
Returns:
The plot.
メソッドを実行すると対象のグラフの描画領域を表すPlotクラスのオブジェクトを取得できます。
JFreeChart chart = ChartFactory.createPieChart(...);      /* 引数は省略 */

Plot plot = chart.getPlot();
取得したPlotクラスのオブジェクトに対して、Plotクラスで用意されている各種メソッドを使って設定を行っていきます。
では簡単なサンプルを作成して試してみます。
サンプルプログラム
下記のサンプルを実行してみよう。
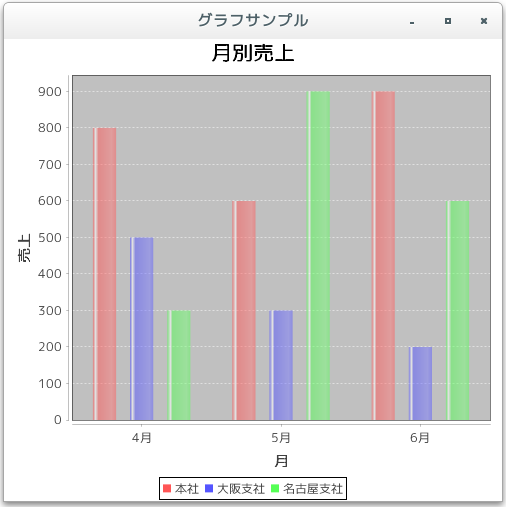
/**
 * Plotクラス
 */
import org.jfree.chart.JFreeChart;
import org.jfree.chart.ChartFactory;
import org.jfree.data.category.DefaultCategoryDataset;
import org.jfree.chart.plot.PlotOrientation;

import javax.swing.JFrame;
import java.awt.BorderLayout;
import org.jfree.chart.ChartPanel;

import org.jfree.chart.plot.Plot;
import java.awt.Color;

public class Test1_1 extends JFrame{
  public static void main(String[] args) {
    Test1_1 frame = new Test1_1();

    frame.setDefaultCloseOperation(JFrame.EXIT_ON_CLOSE);
    frame.setBounds(10, 10, 500, 500);
    frame.setTitle("グラフサンプル");
    frame.setVisible(true);
  }

  Test1_1(){
    JFreeChart chart =
      ChartFactory.createBarChart("月別売上",
                                  "月",
                                  "売上",
                                  createData(),
                                  PlotOrientation.VERTICAL,
                                  true,
                                  false,
                                  false);

    Plot plot = chart.getPlot();
    plot.setBackgroundPaint(new Color(255, 248, 220));

    ChartPanel cpanel = new ChartPanel(chart);
    getContentPane().add(cpanel, BorderLayout.CENTER);
  }

  private DefaultCategoryDataset createData(){
    DefaultCategoryDataset data = new DefaultCategoryDataset();
    String[] series = {"本社", "大阪支社", "名古屋支社"};
    String[] category = {"4月", "5月", "6月"};

    data.addValue(800, series[0], category[0]);
    data.addValue(600, series[0], category[1]);
    data.addValue(900, series[0], category[2]);
    data.addValue(500, series[1], category[0]);
    data.addValue(300, series[1], category[1]);
    data.addValue(200, series[1], category[2]);
    data.addValue(300, series[2], category[0]);
    data.addValue(900, series[2], category[1]);
    data.addValue(600, series[2], category[2]);

    return data;
  }
}
上記をコンパイルした後で実行すると次のように表示されます。
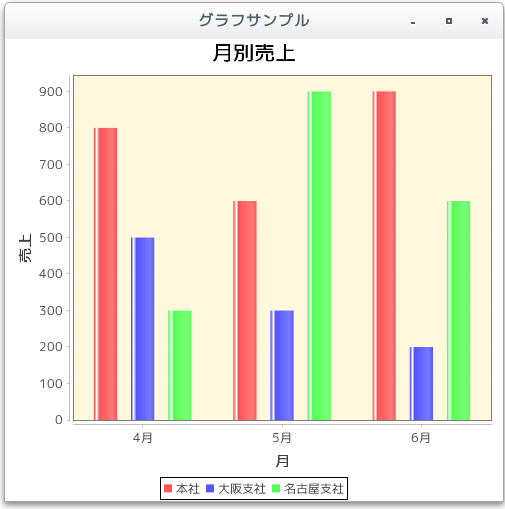
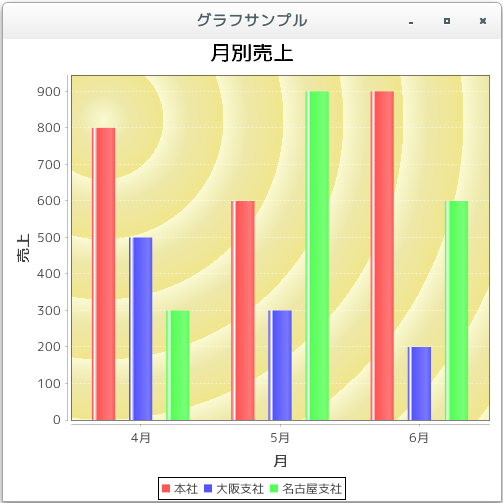
今回は背景の色を設定しました。では次のページから各設定方法を詳しく確認していきます。
- 輪郭の表示(setOutlineVisible)
[ 目次 ]
描画領域の輪郭を描画するかどうかの設定方法です。Plotクラスで用意されている「setOutlineVisible」メソッドを使います。
setOutlineVisible
public void setOutlineVisible(boolean visible)
Sets the flag that controls whether or not the plot's outline is drawn, and sends a PlotChangeEvent to all registered listeners.
Parameters:
visible - the new flag value.
引数に「true」を設定すると輪郭を描画し、「false」を指定すると輪郭を描画しません。なお輪郭とは描画領域の中の軸を除いた部分となります。
例えば次のように記述します。
JFreeChart chart = ChartFactory.createPieChart(...);      /* 引数は省略 */

Plot plot = chart.getPlot();
plot.setOutlineVisible(true);
では簡単なサンプルを作成して試してみます。
サンプルプログラム
下記のサンプルを実行してみよう。
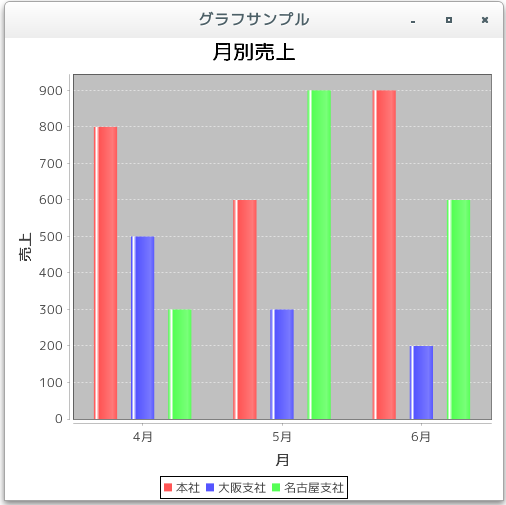
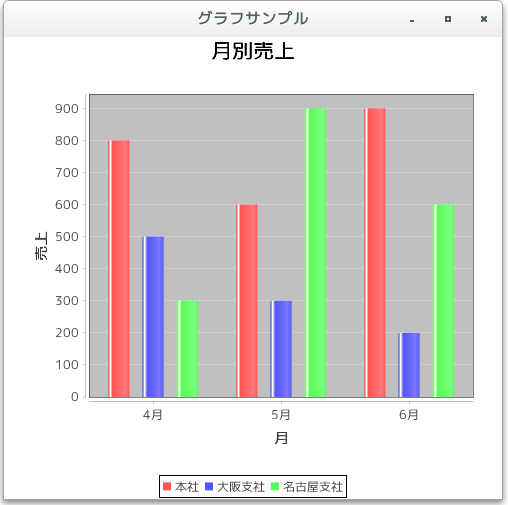
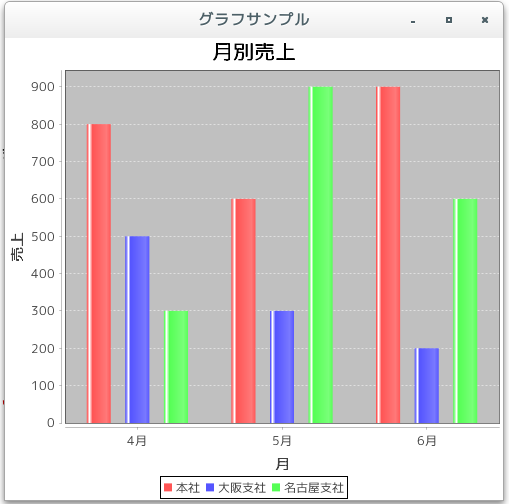
/**
 * 輪郭の表示(setOutlineVisible)
 */
import org.jfree.chart.JFreeChart;
import org.jfree.chart.ChartFactory;
import org.jfree.data.category.DefaultCategoryDataset;
import org.jfree.chart.plot.PlotOrientation;

import javax.swing.JFrame;
import java.awt.BorderLayout;
import org.jfree.chart.ChartPanel;

import org.jfree.chart.plot.Plot;
import java.awt.Color;

public class Test2_1 extends JFrame{
  public static void main(String[] args) {
    Test2_1 frame = new Test2_1();

    frame.setDefaultCloseOperation(JFrame.EXIT_ON_CLOSE);
    frame.setBounds(10, 10, 500, 500);
    frame.setTitle("グラフサンプル");
    frame.setVisible(true);
  }

  Test2_1(){
    JFreeChart chart =
      ChartFactory.createBarChart("月別売上",
                                  "月",
                                  "売上",
                                  createData(),
                                  PlotOrientation.VERTICAL,
                                  true,
                                  false,
                                  false);

    Plot plot = chart.getPlot();
    plot.setOutlineVisible(false);

    ChartPanel cpanel = new ChartPanel(chart);
    getContentPane().add(cpanel, BorderLayout.CENTER);
  }

  private DefaultCategoryDataset createData(){
    DefaultCategoryDataset data = new DefaultCategoryDataset();
    String[] series = {"本社", "大阪支社", "名古屋支社"};
    String[] category = {"4月", "5月", "6月"};

    data.addValue(800, series[0], category[0]);
    data.addValue(600, series[0], category[1]);
    data.addValue(900, series[0], category[2]);
    data.addValue(500, series[1], category[0]);
    data.addValue(300, series[1], category[1]);
    data.addValue(200, series[1], category[2]);
    data.addValue(300, series[2], category[0]);
    data.addValue(900, series[2], category[1]);
    data.addValue(600, series[2], category[2]);

    return data;
  }
}
上記をコンパイルした後で実行すると次のように表示されます。

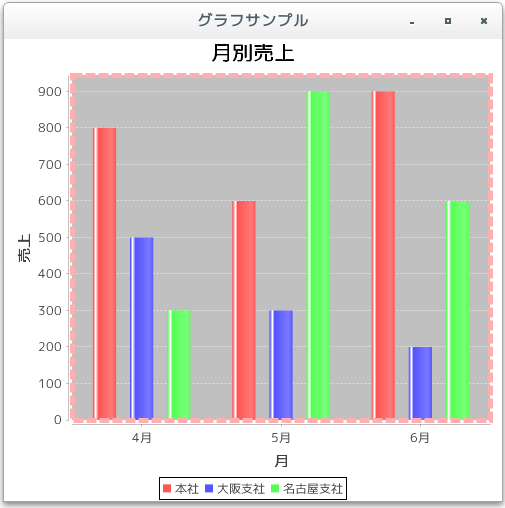
今回は輪郭を表示していません。なお「true」を設定した場合は次のようになります。
- 輪郭の色の指定(setOutlinePaint)
[ 目次 ]
輪郭を表示する設定にしたいる場合に輪郭の色などを設定する方法を確認します。Plotクラスで用意されている「setOutlinePaint」メソッドを使います。
setOutlinePaint
public void setOutlinePaint(java.awt.Paint paint)
Sets the paint used to draw the outline of the plot area and sends a PlotChangeEvent to all registered listeners. If you set this attribute to null, no outline will be drawn.
Parameters:
paint - the paint (null permitted).
引数にはPaintインターフェースを実装したクラスのオブジェクトを指定します。
Paintインターフェースを実装したクラスとしては次のようなものがあります。(詳細は「色属性の設定」などを参照して下さい)。
Color                  単純色
GradientPaint          線形グラデーションパターン
TexturePaint           テクスチャーによる塗りつぶし
LinearGradientPaint    線形グラデーションパターン
RadialGradientPaint    円放射状グラデーションパターン
グラデーションやテクスチャーなども利用できますが、枠線ですので今回は単に色を指定してみます。色指定の場合は「java.awt.Color」クラスのオブジェクトを使います。(Colorクラスについては「Colorクラス」を参照して下さい)。
例えば次のように記述します。
JFreeChart chart = ChartFactory.createPieChart(...);      /* 引数は省略 */

Plot plot = chart.getPlot();
plot.setOutlinePaint(Color.PINK);
では簡単なサンプルを作成して試してみます。
サンプルプログラム
下記のサンプルを実行してみよう。
/**
 * 輪郭の色の指定(setOutlinePaint)
 */
import org.jfree.chart.JFreeChart;
import org.jfree.chart.ChartFactory;
import org.jfree.data.category.DefaultCategoryDataset;
import org.jfree.chart.plot.PlotOrientation;

import javax.swing.JFrame;
import java.awt.BorderLayout;
import org.jfree.chart.ChartPanel;

import org.jfree.chart.plot.Plot;
import java.awt.Color;

public class Test3_1 extends JFrame{
  public static void main(String[] args) {
    Test3_1 frame = new Test3_1();

    frame.setDefaultCloseOperation(JFrame.EXIT_ON_CLOSE);
    frame.setBounds(10, 10, 500, 500);
    frame.setTitle("グラフサンプル");
    frame.setVisible(true);
  }

  Test3_1(){
    JFreeChart chart =
      ChartFactory.createBarChart("月別売上",
                                  "月",
                                  "売上",
                                  createData(),
                                  PlotOrientation.VERTICAL,
                                  true,
                                  false,
                                  false);

    Plot plot = chart.getPlot();
    plot.setOutlinePaint(Color.PINK);

    ChartPanel cpanel = new ChartPanel(chart);
    getContentPane().add(cpanel, BorderLayout.CENTER);
  }

  private DefaultCategoryDataset createData(){
    DefaultCategoryDataset data = new DefaultCategoryDataset();
    String[] series = {"本社", "大阪支社", "名古屋支社"};
    String[] category = {"4月", "5月", "6月"};

    data.addValue(800, series[0], category[0]);
    data.addValue(600, series[0], category[1]);
    data.addValue(900, series[0], category[2]);
    data.addValue(500, series[1], category[0]);
    data.addValue(300, series[1], category[1]);
    data.addValue(200, series[1], category[2]);
    data.addValue(300, series[2], category[0]);
    data.addValue(900, series[2], category[1]);
    data.addValue(600, series[2], category[2]);

    return data;
  }
}
上記をコンパイルした後で実行すると次のように表示されます。

- 輪郭の線属性の指定(setOutlineStroke)
[ 目次 ]
輪郭を表示する設定にしたいる場合に輪郭の線の属性を設定する方法を確認します。Plotクラスで用意されている「setOutlineStroke」メソッドを使います。
setOutlineStroke
public void setOutlineStroke(java.awt.Stroke stroke)
Sets the stroke used to outline the plot area and sends a PlotChangeEvent to all registered listeners. If you set this attribute to null, no outline will be drawn.
Parameters:
stroke - the stroke (null permitted).
引数にはStrokeインターフェースを実装したクラスのオブジェクトを指定します。
Strokeインターフェースを実装したクラスとしては「java.awt.BasicStroke」クラスがあります。線の形状や太さなどの設定が可能です。(詳細は「線属性の設定」などを参照して下さい)。
例えば次のように記述します。
JFreeChart chart = ChartFactory.createPieChart(...);      /* 引数は省略 */

Plot plot = chart.getPlot();

float dash[] = {10.0f, 3.0f};
BasicStroke dsahStroke = new BasicStroke(5.0f,
                                         BasicStroke.CAP_BUTT,
                                         BasicStroke.JOIN_MITER,
                                         3.0f,
                                         dash,
                                         0.0f);
plot.setOutlineStroke(dsahStroke);
では簡単なサンプルを作成して試してみます。
サンプルプログラム
下記のサンプルを実行してみよう。
/**
 * 輪郭の線属性の指定(setOutlineStroke)
 */
import org.jfree.chart.JFreeChart;
import org.jfree.chart.ChartFactory;
import org.jfree.data.category.DefaultCategoryDataset;
import org.jfree.chart.plot.PlotOrientation;

import javax.swing.JFrame;
import java.awt.BorderLayout;
import org.jfree.chart.ChartPanel;

import org.jfree.chart.plot.Plot;
import java.awt.Color;
import java.awt.BasicStroke;

public class Test4_1 extends JFrame{
  public static void main(String[] args) {
    Test4_1 frame = new Test4_1();

    frame.setDefaultCloseOperation(JFrame.EXIT_ON_CLOSE);
    frame.setBounds(10, 10, 500, 500);
    frame.setTitle("グラフサンプル");
    frame.setVisible(true);
  }

  Test4_1(){
    JFreeChart chart =
      ChartFactory.createBarChart("月別売上",
                                  "月",
                                  "売上",
                                  createData(),
                                  PlotOrientation.VERTICAL,
                                  true,
                                  false,
                                  false);

    Plot plot = chart.getPlot();
    plot.setOutlinePaint(Color.PINK);

    float dash[] = {10.0f, 3.0f};
    BasicStroke dsahStroke = new BasicStroke(5.0f,
                                             BasicStroke.CAP_BUTT,
                                             BasicStroke.JOIN_MITER,
                                             3.0f,
                                             dash,
                                             0.0f);
    plot.setOutlineStroke(dsahStroke);

    ChartPanel cpanel = new ChartPanel(chart);
    getContentPane().add(cpanel, BorderLayout.CENTER);
  }

  private DefaultCategoryDataset createData(){
    DefaultCategoryDataset data = new DefaultCategoryDataset();
    String[] series = {"本社", "大阪支社", "名古屋支社"};
    String[] category = {"4月", "5月", "6月"};

    data.addValue(800, series[0], category[0]);
    data.addValue(600, series[0], category[1]);
    data.addValue(900, series[0], category[2]);
    data.addValue(500, series[1], category[0]);
    data.addValue(300, series[1], category[1]);
    data.addValue(200, series[1], category[2]);
    data.addValue(300, series[2], category[0]);
    data.addValue(900, series[2], category[1]);
    data.addValue(600, series[2], category[2]);

    return data;
  }
}
上記をコンパイルした後で実行すると次のように表示されます。
- 背景の色の設定(setBackgroundPaint)
[ 目次 ]
描画領域の背景を設定する方法を確認します。Plotクラスで用意されている「setBackgroundPaint」メソッドを使います。
setBackgroundPaint
public void setBackgroundPaint(java.awt.Paint paint)
Sets the background color of the plot area and sends a PlotChangeEvent to all registered listeners.
Parameters:
paint - the paint (null permitted).
引数にはjava.awt.Paintインターフェースを実装したクラスのオブジェクトを指定します。Paintインターフェースを実装している主なクラスは以下の通りです。
クラス 使用方法 Color 単純色 GradientPaint 線形グラデーションパターン TexturePaint テクスチャーによる塗りつぶし LinearGradientPaint 線形グラデーションパターン RadialGradientPaint 円放射状グラデーションパターン
まずはColorクラスを使い単色の色を指定して描画領域の背景色を設定してみます。Colorクラスについての詳細は「Colorクラス」を参照して下さい。
例えば次のように記述します。
JFreeChart chart = ChartFactory.createPieChart(...);      /* 引数は省略 */

Plot plot = chart.getPlot();
plot.setBackgroundPaint(Color.GREEN);
では簡単なサンプルを作成して試してみます。
サンプルプログラム
下記のサンプルを実行してみよう。
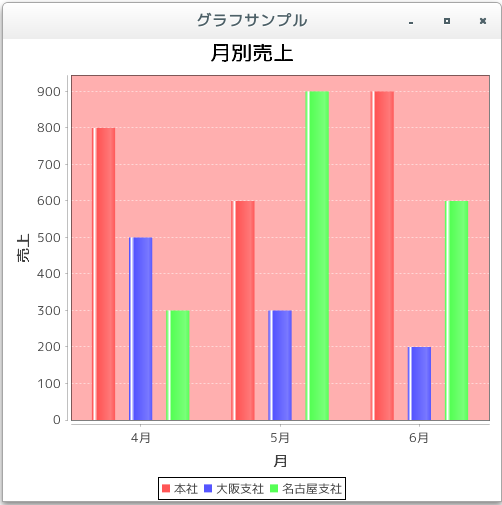
/**
 * 背景の色の設定(setBackgroundPaint)
 */
import org.jfree.chart.JFreeChart;
import org.jfree.chart.ChartFactory;
import org.jfree.data.category.DefaultCategoryDataset;
import org.jfree.chart.plot.PlotOrientation;

import javax.swing.JFrame;
import java.awt.BorderLayout;
import org.jfree.chart.ChartPanel;

import org.jfree.chart.plot.Plot;
import java.awt.Color;

public class Test5_1 extends JFrame{
  public static void main(String[] args) {
    Test5_1 frame = new Test5_1();

    frame.setDefaultCloseOperation(JFrame.EXIT_ON_CLOSE);
    frame.setBounds(10, 10, 500, 500);
    frame.setTitle("グラフサンプル");
    frame.setVisible(true);
  }

  Test5_1(){
    JFreeChart chart =
      ChartFactory.createBarChart("月別売上",
                                  "月",
                                  "売上",
                                  createData(),
                                  PlotOrientation.VERTICAL,
                                  true,
                                  false,
                                  false);

    Plot plot = chart.getPlot();
    plot.setBackgroundPaint(Color.PINK);

    ChartPanel cpanel = new ChartPanel(chart);
    getContentPane().add(cpanel, BorderLayout.CENTER);
  }

  private DefaultCategoryDataset createData(){
    DefaultCategoryDataset data = new DefaultCategoryDataset();
    String[] series = {"本社", "大阪支社", "名古屋支社"};
    String[] category = {"4月", "5月", "6月"};

    data.addValue(800, series[0], category[0]);
    data.addValue(600, series[0], category[1]);
    data.addValue(900, series[0], category[2]);
    data.addValue(500, series[1], category[0]);
    data.addValue(300, series[1], category[1]);
    data.addValue(200, series[1], category[2]);
    data.addValue(300, series[2], category[0]);
    data.addValue(900, series[2], category[1]);
    data.addValue(600, series[2], category[2]);

    return data;
  }
}
上記をコンパイルした後で実行すると次のように表示されます。
- 背景にグラデーションを設定
[ 目次 ]
描画領域の背景に単純色ではなくグラデーションを設定します。
グラデーションの設定は様々な方法があります。詳しくは「色属性の設定」を確認して下さい。今回は例としてPaintインターフェースを実装したRadialGradientPaintクラスを使ってみます。
例えば次のように記述します。
JFreeChart chart = ChartFactory.createPieChart(...);      /* 引数は省略 */

Plot plot = chart.getPlot();

float[] dist = {0.0f, 0.4f, 1.0f};
Color[] colors = {Color.RED, Color.WHITE, Color.BLUE};

RadialGradientPaint gradient = new RadialGradientPaint(
  100.0f, 80.0f,
  60.0f,
  dist,
  colors,
  MultipleGradientPaint.CycleMethod.REPEAT
);

plot.setBackgroundPaint(gradient);
では簡単なサンプルを作成して試してみます。
サンプルプログラム
下記のサンプルを実行してみよう。
/**
 * 背景にグラデーションを設定
 */
import org.jfree.chart.JFreeChart;
import org.jfree.chart.ChartFactory;
import org.jfree.data.category.DefaultCategoryDataset;
import org.jfree.chart.plot.PlotOrientation;

import javax.swing.JFrame;
import java.awt.BorderLayout;
import org.jfree.chart.ChartPanel;

import org.jfree.chart.plot.Plot;
import java.awt.Color;
import java.awt.RadialGradientPaint;
import java.awt.MultipleGradientPaint;

public class Test6_1 extends JFrame{
  public static void main(String[] args) {
    Test6_1 frame = new Test6_1();

    frame.setDefaultCloseOperation(JFrame.EXIT_ON_CLOSE);
    frame.setBounds(10, 10, 500, 500);
    frame.setTitle("グラフサンプル");
    frame.setVisible(true);
  }

  Test6_1(){
    JFreeChart chart =
      ChartFactory.createBarChart("月別売上",
                                  "月",
                                  "売上",
                                  createData(),
                                  PlotOrientation.VERTICAL,
                                  true,
                                  false,
                                  false);

    Plot plot = chart.getPlot();

    float[] dist = {0.0f, 0.4f, 1.0f};
    Color[] colors = {new Color(250, 250, 210),
                      new Color(238, 232, 170),
                      new Color(240, 230, 140)};

    RadialGradientPaint gradient = new RadialGradientPaint(
      100.0f, 80.0f,
      60.0f,
      dist,
      colors,
      MultipleGradientPaint.CycleMethod.REPEAT
    );
    plot.setBackgroundPaint(gradient);

    ChartPanel cpanel = new ChartPanel(chart);
    getContentPane().add(cpanel, BorderLayout.CENTER);
  }

  private DefaultCategoryDataset createData(){
    DefaultCategoryDataset data = new DefaultCategoryDataset();
    String[] series = {"本社", "大阪支社", "名古屋支社"};
    String[] category = {"4月", "5月", "6月"};

    data.addValue(800, series[0], category[0]);
    data.addValue(600, series[0], category[1]);
    data.addValue(900, series[0], category[2]);
    data.addValue(500, series[1], category[0]);
    data.addValue(300, series[1], category[1]);
    data.addValue(200, series[1], category[2]);
    data.addValue(300, series[2], category[0]);
    data.addValue(900, series[2], category[1]);
    data.addValue(600, series[2], category[2]);

    return data;
  }
}
上記をコンパイルした後で実行すると次のように表示されます。
- 背景にテクスチャーを設定
[ 目次 ]
描画領域の背景をテクスチャーを使って塗りつぶします。
テクスチャーによる塗りつぶしについてはTexturePaintクラスを使用します。詳しくは「色属性の設定」を確認して下さい。
例えば次のように記述します。
JFreeChart chart = ChartFactory.createPieChart(...);      /* 引数は省略 */

Plot plot = chart.getPlot();

BufferedImage img =
  new BufferedImage(100, 100, BufferedImage.TYPE_INT_RGB);

File f = new File("./ball.png");
try {
  img = ImageIO.read(f);
}catch (IOException ex){
  ex.printStackTrace();
}

Rectangle2D.Double rec =
  new Rectangle2D.Double(0, 0, img.getWidth(), img.getHeight());

plot.setBackgroundPaint(new TexturePaint(img, rec));
では簡単なサンプルを作成して試してみます。
サンプルプログラム
下記のサンプルを実行してみよう。
/**
 * 背景にテクスチャーを設定
 */
import org.jfree.chart.JFreeChart;
import org.jfree.chart.ChartFactory;
import org.jfree.data.category.DefaultCategoryDataset;
import org.jfree.chart.plot.PlotOrientation;

import javax.swing.JFrame;
import java.awt.BorderLayout;
import org.jfree.chart.ChartPanel;

import org.jfree.chart.plot.Plot;
import java.awt.TexturePaint;
import java.awt.image.BufferedImage;
import java.io.File;
import javax.imageio.ImageIO;
import java.io.IOException;
import java.awt.geom.Rectangle2D;

public class Test7_1 extends JFrame{
  public static void main(String[] args) {
    Test7_1 frame = new Test7_1();

    frame.setDefaultCloseOperation(JFrame.EXIT_ON_CLOSE);
    frame.setBounds(10, 10, 500, 500);
    frame.setTitle("グラフサンプル");
    frame.setVisible(true);
  }

  Test7_1(){
    JFreeChart chart =
      ChartFactory.createBarChart("月別売上",
                                  "月",
                                  "売上",
                                  createData(),
                                  PlotOrientation.VERTICAL,
                                  true,
                                  false,
                                  false);

    Plot plot = chart.getPlot();

    BufferedImage img =
      new BufferedImage(100, 100, BufferedImage.TYPE_INT_RGB);

    File f = new File("./ball.png");
    try {
      img = ImageIO.read(f);
    }catch (IOException ex){
      ex.printStackTrace();
    }

    Rectangle2D.Double rec =
      new Rectangle2D.Double(0, 0, img.getWidth(), img.getHeight());

    plot.setBackgroundPaint(new TexturePaint(img, rec));

    ChartPanel cpanel = new ChartPanel(chart);
    getContentPane().add(cpanel, BorderLayout.CENTER);
  }

  private DefaultCategoryDataset createData(){
    DefaultCategoryDataset data = new DefaultCategoryDataset();
    String[] series = {"本社", "大阪支社", "名古屋支社"};
    String[] category = {"4月", "5月", "6月"};

    data.addValue(800, series[0], category[0]);
    data.addValue(600, series[0], category[1]);
    data.addValue(900, series[0], category[2]);
    data.addValue(500, series[1], category[0]);
    data.addValue(300, series[1], category[1]);
    data.addValue(200, series[1], category[2]);
    data.addValue(300, series[2], category[0]);
    data.addValue(900, series[2], category[1]);
    data.addValue(600, series[2], category[2]);

    return data;
  }
}
上記をコンパイルした後で実行すると次のように表示されます。
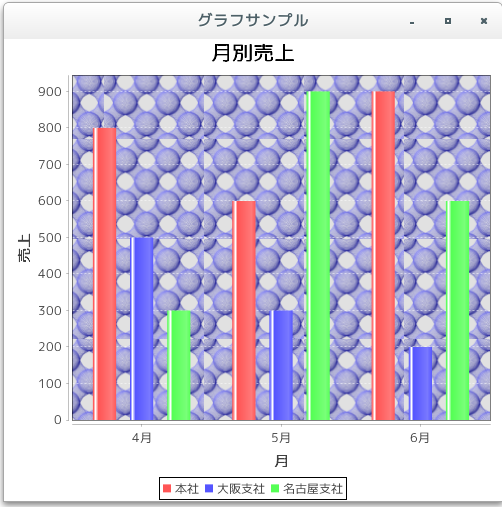
今回読み込んだ画像は次のような画像です。
- 背景の透明度を設定(setBackgroundAlpha)
[ 目次 ]
描画領域の背景は透明度を設定することが出来ます。Plotクラスで用意されている「setBackgroundAlpha」メソッドを使います。
setBackgroundAlpha
public void setBackgroundAlpha(float alpha)
Sets the alpha transparency of the plot area background, and notifies registered listeners that the plot has been modified.
Parameters:
alpha - the new alpha value (in the range 0.0f to 1.0f).
引数には透明度を表すfloat型の数値を指定します。数値は0.0fから1.0fの間で指定し、0.0fを指定すると完全な透明となり1.0fを指定すると非透明となります。デフォルトでは1.0fが設定されています。
例えば次のように記述します。
JFreeChart chart = ChartFactory.createPieChart(...);      /* 引数は省略 */

Plot plot = chart.getPlot();
plot.setBackgroundPaint(Color.GREEN);

plot.setBackgroundAlpha(0.5f);
では簡単なサンプルを作成して試してみます。
サンプルプログラム
下記のサンプルを実行してみよう。
/**
 * 背景の透明度を設定(setBackgroundAlpha)
 * 0.5f
 */
import org.jfree.chart.JFreeChart;
import org.jfree.chart.ChartFactory;
import org.jfree.data.category.DefaultCategoryDataset;
import org.jfree.chart.plot.PlotOrientation;

import javax.swing.JFrame;
import java.awt.BorderLayout;
import org.jfree.chart.ChartPanel;

import org.jfree.chart.plot.Plot;
import java.awt.Color;
import java.awt.RadialGradientPaint;
import java.awt.MultipleGradientPaint;

public class Test8_1 extends JFrame{
  public static void main(String[] args) {
    Test8_1 frame = new Test8_1();

    frame.setDefaultCloseOperation(JFrame.EXIT_ON_CLOSE);
    frame.setBounds(10, 10, 500, 500);
    frame.setTitle("グラフサンプル");
    frame.setVisible(true);
  }

  Test8_1(){
    JFreeChart chart =
      ChartFactory.createBarChart("月別売上",
                                  "月",
                                  "売上",
                                  createData(),
                                  PlotOrientation.VERTICAL,
                                  true,
                                  false,
                                  false);

    Plot plot = chart.getPlot();

    float[] dist = {0.0f, 0.4f, 1.0f};
    Color[] colors = {new Color(250, 250, 210),
                      new Color(238, 232, 170),
                      new Color(240, 230, 140)};

    RadialGradientPaint gradient = new RadialGradientPaint(
      100.0f, 80.0f,
      60.0f,
      dist,
      colors,
      MultipleGradientPaint.CycleMethod.REPEAT
    );
    plot.setBackgroundPaint(gradient);
    plot.setBackgroundAlpha(0.5f);

    ChartPanel cpanel = new ChartPanel(chart);
    getContentPane().add(cpanel, BorderLayout.CENTER);
  }

  private DefaultCategoryDataset createData(){
    DefaultCategoryDataset data = new DefaultCategoryDataset();
    String[] series = {"本社", "大阪支社", "名古屋支社"};
    String[] category = {"4月", "5月", "6月"};

    data.addValue(800, series[0], category[0]);
    data.addValue(600, series[0], category[1]);
    data.addValue(900, series[0], category[2]);
    data.addValue(500, series[1], category[0]);
    data.addValue(300, series[1], category[1]);
    data.addValue(200, series[1], category[2]);
    data.addValue(300, series[2], category[0]);
    data.addValue(900, series[2], category[1]);
    data.addValue(600, series[2], category[2]);

    return data;
  }
}
上記をコンパイルした後で実行すると次のように表示されます。
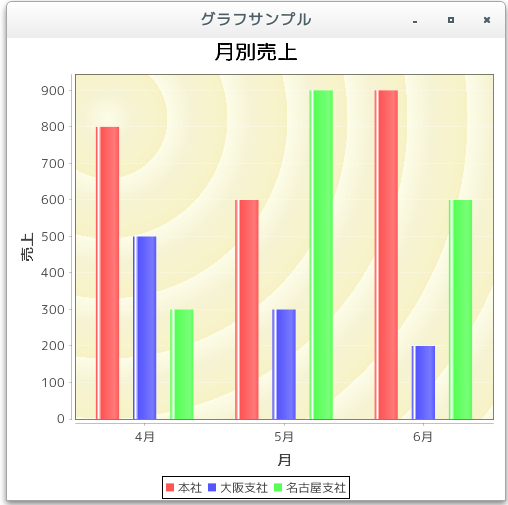
上記は透明度に0.5fを設定した場合です。いくつか他の値を指定した場合の実行結果を下記に表示します。
plot.setBackgroundAlpha(1.0f);

plot.setBackgroundAlpha(0.3f);
- 背景画像を設定(setBackgroundImage, setBackgroundImageAlignment)
[ 目次 ]
描画領域の背景の上に背景画像を設定することが出来ます。Plotクラスで用意されている「setBackgroundImage」メソッドを使います。
setBackgroundImage
public void setBackgroundImage(java.awt.Image image)
Sets the background image for the plot and sends a PlotChangeEvent to all registered listeners.
Parameters:
image - the image (null permitted).
引数にはjava.awt.Imageクラスのオブジェクトを指定します。今回はImageクラスのサブクラスであるjava.awt.image.BufferedImageクラスのオブジェクトを利用します。(BufferedImageクラスについては「BufferedImageの使い方色々」を参照して下さい)。
例えば次のように記述します。
JFreeChart chart = ChartFactory.createPieChart(...);      /* 引数は省略 */

Plot plot = chart.getPlot();
BufferedImage image = null;
try {
  image = ImageIO.read(new File("./hana.png"));
} catch (Exception e) {
  e.printStackTrace();
  image = null;
}
plot.setBackgroundImage(image);
背景画像を使用した場合、描画領域内ではグラフ、背景画像、背景、の順に表示されます。
なお描画領域と貼り付ける画像の大きさが異なる場合、デフォルトの設定では画像を描画領域の大きさに合わせて拡大縮小して貼り付けられます。
画像の貼り付け方式を設定
描画領域の中で画像がどのように貼り付けられるのかを指定することが可能です。Plotクラスで用意されている「setBackgroundImageAlignment」メソッドを使います。
setBackgroundImageAlignment
public void setBackgroundImageAlignment(int alignment)
Sets the alignment for the background image and sends a PlotChangeEvent to all registered listeners. Alignment options are defined by the Align class in the JCommon class library.
Parameters:
alignment - the alignment.
引数には「org.jfree.ui.Align」クラスで定義されているstaticフィールドを使って指定します。(Alignクラスについては「Alignクラス」を参照して下さい)。
例えば次のように記述します。
JFreeChart chart = ChartFactory.createPieChart(...);      /* 引数は省略 */

Plot plot = chart.getPlot();
BufferedImage image = null;
try {
  image = ImageIO.read(new File("./hana.png"));
} catch (Exception e) {
  e.printStackTrace();
  image = null;
}
plot.setBackgroundImage(image);
plot.setBackgroundImageAlignment(Align.LEFT);
デフォルトの値は「Align.FIT」です。
では簡単なサンプルを作成して試してみます。
サンプルプログラム
下記のサンプルを実行してみよう。
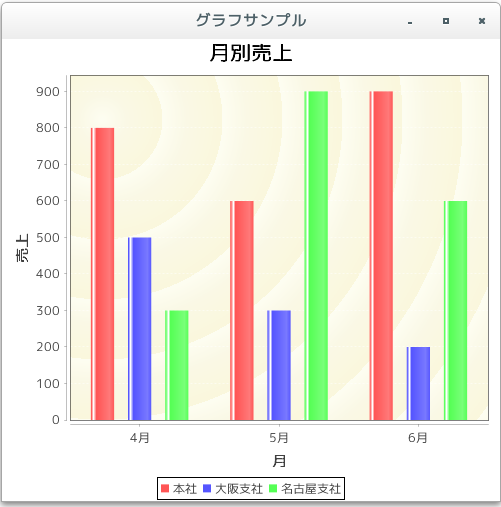
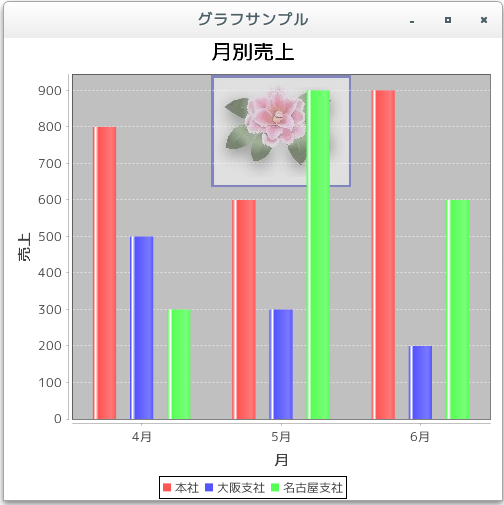
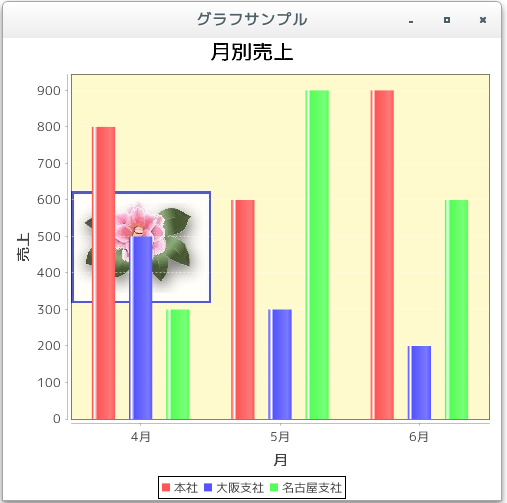
/**
 * 背景画像を設定(setBackgroundImage, setBackgroundImageAlignment)
 */
import org.jfree.chart.JFreeChart;
import org.jfree.chart.ChartFactory;
import org.jfree.data.category.DefaultCategoryDataset;
import org.jfree.chart.plot.PlotOrientation;

import javax.swing.JFrame;
import java.awt.BorderLayout;
import org.jfree.chart.ChartPanel;

import org.jfree.chart.plot.Plot;
import java.awt.image.BufferedImage;
import java.io.File;
import javax.imageio.ImageIO;
import java.io.IOException;
import org.jfree.ui.Align;

public class Test9_1 extends JFrame{
  public static void main(String[] args) {
    Test9_1 frame = new Test9_1();

    frame.setDefaultCloseOperation(JFrame.EXIT_ON_CLOSE);
    frame.setBounds(10, 10, 500, 500);
    frame.setTitle("グラフサンプル");
    frame.setVisible(true);
  }

  Test9_1(){
    JFreeChart chart =
      ChartFactory.createBarChart("月別売上",
                                  "月",
                                  "売上",
                                  createData(),
                                  PlotOrientation.VERTICAL,
                                  true,
                                  false,
                                  false);

    Plot plot = chart.getPlot();

    BufferedImage image = null;
    try {
        image = ImageIO.read(new File("./tb7.jpg"));
    } catch (Exception e) {
        e.printStackTrace();
        image = null;
    }
    plot.setBackgroundImage(image);
    plot.setBackgroundImageAlignment(Align.LEFT);

    ChartPanel cpanel = new ChartPanel(chart);
    getContentPane().add(cpanel, BorderLayout.CENTER);
  }

  private DefaultCategoryDataset createData(){
    DefaultCategoryDataset data = new DefaultCategoryDataset();
    String[] series = {"本社", "大阪支社", "名古屋支社"};
    String[] category = {"4月", "5月", "6月"};

    data.addValue(800, series[0], category[0]);
    data.addValue(600, series[0], category[1]);
    data.addValue(900, series[0], category[2]);
    data.addValue(500, series[1], category[0]);
    data.addValue(300, series[1], category[1]);
    data.addValue(200, series[1], category[2]);
    data.addValue(300, series[2], category[0]);
    data.addValue(900, series[2], category[1]);
    data.addValue(600, series[2], category[2]);

    return data;
  }
}
上記をコンパイルした後で実行すると次のように表示されます。
上記はAlign.LEFTを設定した場合です。いくつか他の値を指定した場合の実行結果を下記に表示します。
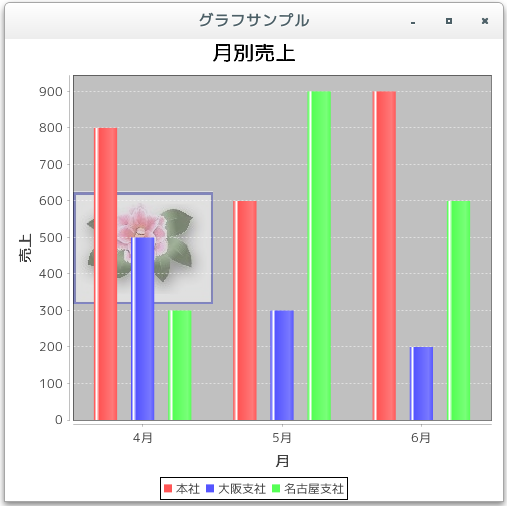
Align.FIT : (デフォルト)
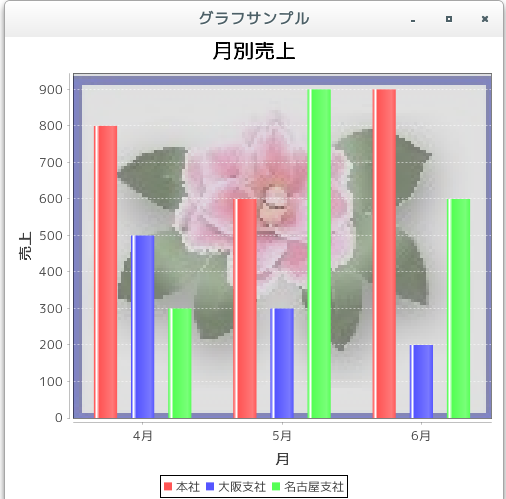
Align.RIGHT :
Align.TOP :
Align.BOTTOM :

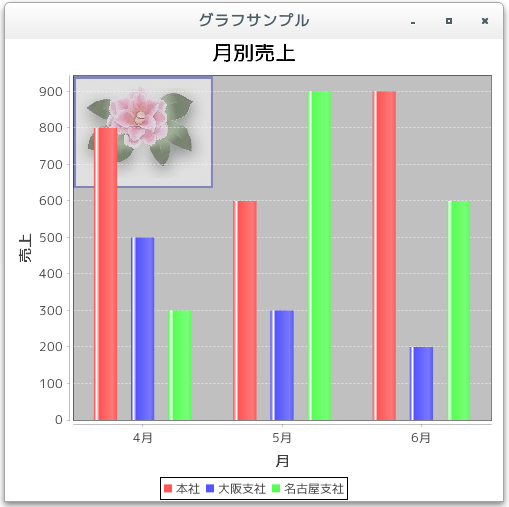
Align.TOP_LEFT :
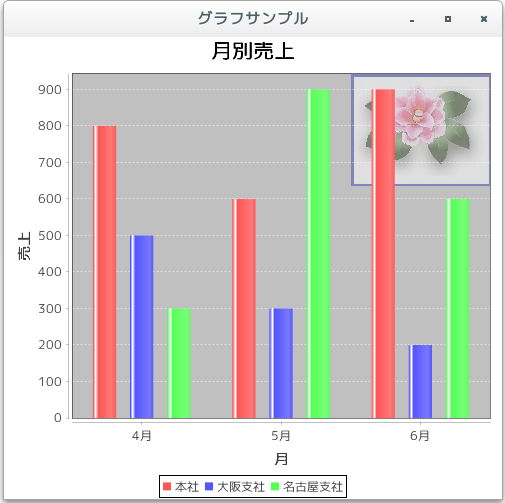
Align.TOP_RIGHT :
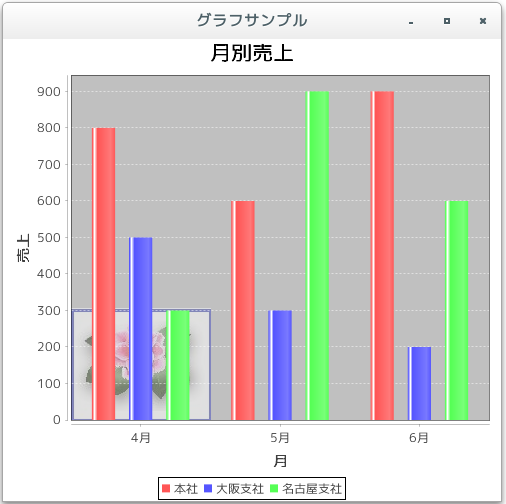
Align.BOTTOM_LEFT :
Align.BOTTOM_RIGHT :
- 背景画像の透明度を設定(setBackgroundImageAlpha)
[ 目次 ]
背景画像の透明度を設定する方法を確認します。Plotクラスで用意されている「setBackgroundImageAlpha」メソッドを使います。
setBackgroundImageAlpha
public void setBackgroundImageAlpha(float alpha)
Sets the alpha transparency used when drawing the background image.
Parameters:
alpha - the alpha transparency (in the range 0.0f to 1.0f, where 0.0f
is fully transparent, and 1.0f is fully opaque).
Throws:
java.lang.IllegalArgumentException - if alpha is not within the
specified range.
引数には透明度を表すfloat型の数値を指定します。数値は0.0fから1.0fの間で指定し、0.0fを指定すると完全な透明となり1.0fを指定すると非透明となります。デフォルトでは0.5fが設定されています。
例えば次のように記述します。
JFreeChart chart = ChartFactory.createPieChart(...);      /* 引数は省略 */

Plot plot = chart.getPlot();
BufferedImage image = null;
try {
  image = ImageIO.read(new File("./hana.png"));
} catch (Exception e) {
  e.printStackTrace();
  image = null;
}
plot.setBackgroundImage(image);
plot.setBackgroundImageAlpha(0.8f);
では簡単なサンプルを作成して試してみます。
サンプルプログラム
下記のサンプルを実行してみよう。
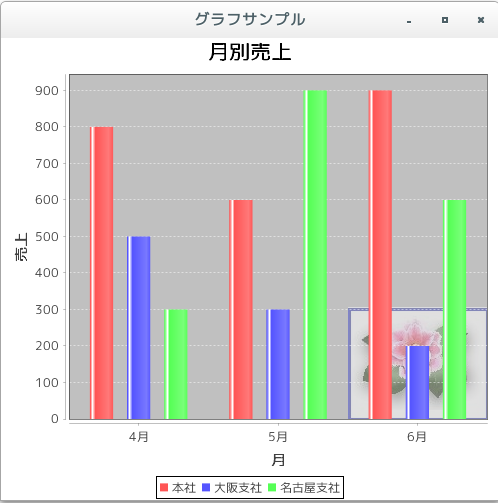
/**
 * 背景画像の透明度を設定(setBackgroundImageAlpha)
 */
import org.jfree.chart.JFreeChart;
import org.jfree.chart.ChartFactory;
import org.jfree.data.category.DefaultCategoryDataset;
import org.jfree.chart.plot.PlotOrientation;

import javax.swing.JFrame;
import java.awt.BorderLayout;
import org.jfree.chart.ChartPanel;

import org.jfree.chart.plot.Plot;
import java.awt.Color;
import java.awt.image.BufferedImage;
import java.io.File;
import javax.imageio.ImageIO;
import java.io.IOException;
import org.jfree.ui.Align;

public class Test10_1 extends JFrame{
  public static void main(String[] args) {
    Test10_1 frame = new Test10_1();

    frame.setDefaultCloseOperation(JFrame.EXIT_ON_CLOSE);
    frame.setBounds(10, 10, 500, 500);
    frame.setTitle("グラフサンプル");
    frame.setVisible(true);
  }

  Test10_1(){
    JFreeChart chart =
      ChartFactory.createBarChart("月別売上",
                                  "月",
                                  "売上",
                                  createData(),
                                  PlotOrientation.VERTICAL,
                                  true,
                                  false,
                                  false);

    Plot plot = chart.getPlot();

    BufferedImage image = null;
    try {
        image = ImageIO.read(new File("./tb7.jpg"));
    } catch (Exception e) {
        e.printStackTrace();
        image = null;
    }
    plot.setBackgroundPaint(new Color(255, 250, 205));
    plot.setBackgroundImage(image);
    plot.setBackgroundImageAlignment(Align.LEFT);
    plot.setBackgroundImageAlpha(0.9f);
//    plot.setBackgroundImageAlpha(0.5f);
//    plot.setBackgroundImageAlpha(0.1f);

    ChartPanel cpanel = new ChartPanel(chart);
    getContentPane().add(cpanel, BorderLayout.CENTER);
  }

  private DefaultCategoryDataset createData(){
    DefaultCategoryDataset data = new DefaultCategoryDataset();
    String[] series = {"本社", "大阪支社", "名古屋支社"};
    String[] category = {"4月", "5月", "6月"};

    data.addValue(800, series[0], category[0]);
    data.addValue(600, series[0], category[1]);
    data.addValue(900, series[0], category[2]);
    data.addValue(500, series[1], category[0]);
    data.addValue(300, series[1], category[1]);
    data.addValue(200, series[1], category[2]);
    data.addValue(300, series[2], category[0]);
    data.addValue(900, series[2], category[1]);
    data.addValue(600, series[2], category[2]);

    return data;
  }
}
上記をコンパイルした後で実行すると次のように表示されます。
上記は 0.9f を設定した場合です。いくつか他の値を指定した場合の実行結果を下記に表示します。
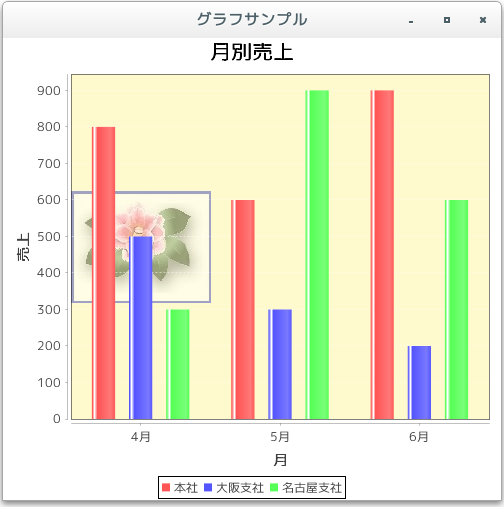
0.5f : (デフォルト)
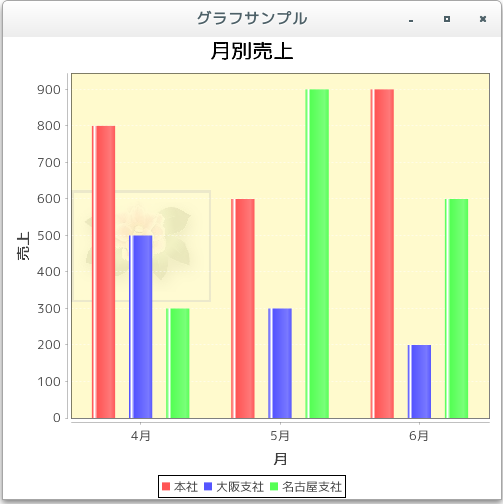
0.1f :
- グラフ部分の透明度を設定(setForegroundAlpha)
[ 目次 ]
グラフ描画領域の中のグラフの部分の透明度を設定する方法を確認します。Plotクラスで用意されている「setForegroundAlpha」メソッドを使います。
setForegroundAlpha
public void setForegroundAlpha(float alpha)
Sets the alpha-transparency for the plot and sends a PlotChangeEvent to all registered listeners.
Parameters:
alpha - the new alpha transparency.
引数には透明度を表すfloat型の数値を指定します。数値は0.0fから1.0fの間で指定し、0.0fを指定すると完全な透明となり1.0fを指定すると非透明となります。デフォルトでは1.0fが設定されています。
例えば次のように記述します。
JFreeChart chart = ChartFactory.createPieChart(...);      /* 引数は省略 */

Plot plot = chart.getPlot();
plot.setForegroundAlpha(0.5f);
では簡単なサンプルを作成して試してみます。
サンプルプログラム
下記のサンプルを実行してみよう。
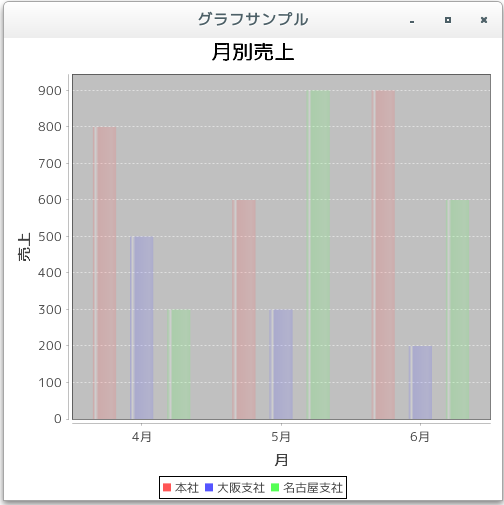
/**
 * グラフ部分の透明度を設定(setForegroundAlpha)
 */
import org.jfree.chart.JFreeChart;
import org.jfree.chart.ChartFactory;
import org.jfree.data.category.DefaultCategoryDataset;
import org.jfree.chart.plot.PlotOrientation;

import javax.swing.JFrame;
import java.awt.BorderLayout;
import org.jfree.chart.ChartPanel;

import org.jfree.chart.plot.Plot;

public class Test11_1 extends JFrame{
  public static void main(String[] args) {
    Test11_1 frame = new Test11_1();

    frame.setDefaultCloseOperation(JFrame.EXIT_ON_CLOSE);
    frame.setBounds(10, 10, 500, 500);
    frame.setTitle("グラフサンプル");
    frame.setVisible(true);
  }

  Test11_1(){
    JFreeChart chart =
      ChartFactory.createBarChart("月別売上",
                                  "月",
                                  "売上",
                                  createData(),
                                  PlotOrientation.VERTICAL,
                                  true,
                                  false,
                                  false);

    Plot plot = chart.getPlot();
    plot.setForegroundAlpha(0.5f);
//    plot.setForegroundAlpha(1.0f);
//    plot.setForegroundAlpha(0.2f);

    ChartPanel cpanel = new ChartPanel(chart);
    getContentPane().add(cpanel, BorderLayout.CENTER);
  }

  private DefaultCategoryDataset createData(){
    DefaultCategoryDataset data = new DefaultCategoryDataset();
    String[] series = {"本社", "大阪支社", "名古屋支社"};
    String[] category = {"4月", "5月", "6月"};

    data.addValue(800, series[0], category[0]);
    data.addValue(600, series[0], category[1]);
    data.addValue(900, series[0], category[2]);
    data.addValue(500, series[1], category[0]);
    data.addValue(300, series[1], category[1]);
    data.addValue(200, series[1], category[2]);
    data.addValue(300, series[2], category[0]);
    data.addValue(900, series[2], category[1]);
    data.addValue(600, series[2], category[2]);

    return data;
  }
}
上記をコンパイルした後で実行すると次のように表示されます。
上記は 0.5f を設定した場合です。いくつか他の値を指定した場合の実行結果を下記に表示します。
1.0f : (デフォルト)

0.2f :
- グラフの描画領域のパディングの設定(setInsets)
[ 目次 ]
グラフ描画領域とタイトルなどが表示される外側の部分のパディングの設定方法を確認します。Plotクラスで用意されている「setInsets」メソッドを使います。
setInsets
public void setInsets(org.jfree.ui.RectangleInsets insets)
Sets the insets for the plot and sends a PlotChangeEvent to all registered listeners.
Parameters:
insets - the new insets (null not permitted).
引数にはRectangleInsetsクラスのオブジェクトを使って上左下右のパディングの量を指定します。RectangleInsetsクラスについては「RectangleInsetsクラス」を参照して下さい。
例えば次のように記述します。
JFreeChart chart = ChartFactory.createPieChart(...);      /* 引数は省略 */

Plot plot = chart.getPlot();
RectangleInsets insets = new RectangleInsets(3d, 3d, 3d, 3d);
plot.setInsets(insets);
では簡単なサンプルを作成して試してみます。
サンプルプログラム
下記のサンプルを実行してみよう。
/**
 * グラフの描画領域のパディングの設定(setInsets)
 */
import org.jfree.chart.JFreeChart;
import org.jfree.chart.ChartFactory;
import org.jfree.data.category.DefaultCategoryDataset;
import org.jfree.chart.plot.PlotOrientation;

import javax.swing.JFrame;
import java.awt.BorderLayout;
import org.jfree.chart.ChartPanel;

import org.jfree.chart.plot.Plot;
import org.jfree.ui.RectangleInsets;

public class Test12_1 extends JFrame{
  public static void main(String[] args) {
    Test12_1 frame = new Test12_1();

    frame.setDefaultCloseOperation(JFrame.EXIT_ON_CLOSE);
    frame.setBounds(10, 10, 500, 500);
    frame.setTitle("グラフサンプル");
    frame.setVisible(true);
  }

  Test12_1(){
    JFreeChart chart =
      ChartFactory.createBarChart("月別売上",
                                  "月",
                                  "売上",
                                  createData(),
                                  PlotOrientation.VERTICAL,
                                  true,
                                  false,
                                  false);

    Plot plot = chart.getPlot();
    RectangleInsets insets = new RectangleInsets(25d, 25d, 25d, 25d);
//    RectangleInsets insets = new RectangleInsets(55d, 55d, 55d, 55d);
    plot.setInsets(insets);

    ChartPanel cpanel = new ChartPanel(chart);
    getContentPane().add(cpanel, BorderLayout.CENTER);
  }

  private DefaultCategoryDataset createData(){
    DefaultCategoryDataset data = new DefaultCategoryDataset();
    String[] series = {"本社", "大阪支社", "名古屋支社"};
    String[] category = {"4月", "5月", "6月"};

    data.addValue(800, series[0], category[0]);
    data.addValue(600, series[0], category[1]);
    data.addValue(900, series[0], category[2]);
    data.addValue(500, series[1], category[0]);
    data.addValue(300, series[1], category[1]);
    data.addValue(200, series[1], category[2]);
    data.addValue(300, series[2], category[0]);
    data.addValue(900, series[2], category[1]);
    data.addValue(600, series[2], category[2]);

    return data;
  }
}
上記をコンパイルした後で実行すると次のように表示されます。
比較の為、パディングを0に設定した場合の実行結果だけ表示しておきます。
- データが無い時の表示文字列(setNoDataMessage)
[ 目次 ]
グラフのデータが存在しない時にグラフに文字列を設定することが出来ます。データが無いときの表示文字列を設定するにはPlotクラスで用意されている「setNoDataMessage」メソッドを使います。
setNoDataMessage
public void setNoDataMessage(java.lang.String message)
Sets the message that is displayed when the dataset is empty or null, and sends a PlotChangeEvent to all registered listeners.
Parameters:
message - the message (null permitted).
引数には表示する文字列を指定して下さい。
例えば次のように記述します。
JFreeChart chart = ChartFactory.createPieChart(...);      /* 引数は省略 */

Plot plot = chart.getPlot();
plot.setNoDataMessage("データがありません");
では簡単なサンプルを作成して試してみます。
サンプルプログラム
下記のサンプルを実行してみよう。
/**
 * データが無い時の表示文字列(setNoDataMessage)
 */
import org.jfree.chart.JFreeChart;
import org.jfree.chart.ChartFactory;
import org.jfree.data.category.DefaultCategoryDataset;
import org.jfree.chart.plot.PlotOrientation;

import javax.swing.JFrame;
import java.awt.BorderLayout;
import org.jfree.chart.ChartPanel;

import org.jfree.chart.plot.Plot;

public class Test13_1 extends JFrame{
  public static void main(String[] args) {
    Test13_1 frame = new Test13_1();

    frame.setDefaultCloseOperation(JFrame.EXIT_ON_CLOSE);
    frame.setBounds(10, 10, 500, 500);
    frame.setTitle("グラフサンプル");
    frame.setVisible(true);
  }

  Test13_1(){
    JFreeChart chart =
      ChartFactory.createBarChart("月別売上",
                                  "月",
                                  "売上",
                                  createData(),
                                  PlotOrientation.VERTICAL,
                                  true,
                                  false,
                                  false);

    Plot plot = chart.getPlot();
    plot.setNoDataMessage("データがありません");

    ChartPanel cpanel = new ChartPanel(chart);
    getContentPane().add(cpanel, BorderLayout.CENTER);
  }

  private DefaultCategoryDataset createData(){
    DefaultCategoryDataset data = new DefaultCategoryDataset();

    return data;
  }
}
上記をコンパイルした後で実行すると次のように表示されます。
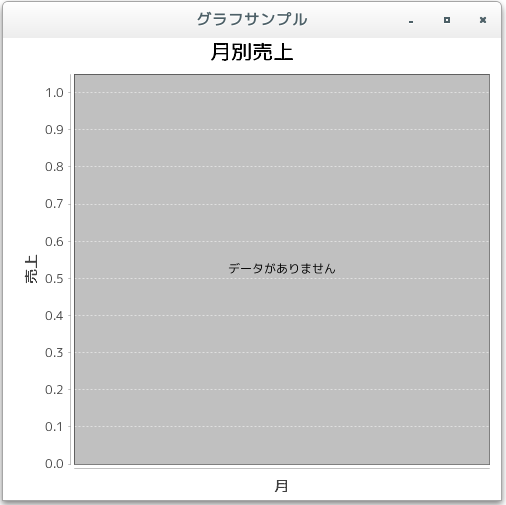
- データが無い時の文字色の指定(setNoDataMessagePaint)
[ 目次 ]
データが設定されていない時に表示される文字列の色の指定方法を確認します。Plotクラスで用意されている「setNoDataMessagePaint」メソッドを使います。
setNoDataMessagePaint
public void setNoDataMessagePaint(java.awt.Paint paint)
Sets the paint used to display the 'no data' message and sends a PlotChangeEvent to all registered listeners.
Parameters:
paint - the paint (null not permitted).
引数にはPaintインターフェースを実装したクラスのオブジェクトを指定します。
Paintインターフェースを実装したクラスとしてはColorクラスやGradientPaintクラスがあります。(詳細は「色属性の設定」などを参照して下さい)。
今回は単に色を指定してみます。色指定の場合は「java.awt.Color」クラスのオブジェクトを使います。(Colorクラスについては「Colorクラス」を参照して下さい)。
例えば次のように記述します。
JFreeChart chart = ChartFactory.createPieChart(...);      /* 引数は省略 */

Plot plot = chart.getPlot();
plot.setNoDataMessage("データがありません");
plot.setNoDataMessagePaint(Color.RED);
では簡単なサンプルを作成して試してみます。
サンプルプログラム
下記のサンプルを実行してみよう。
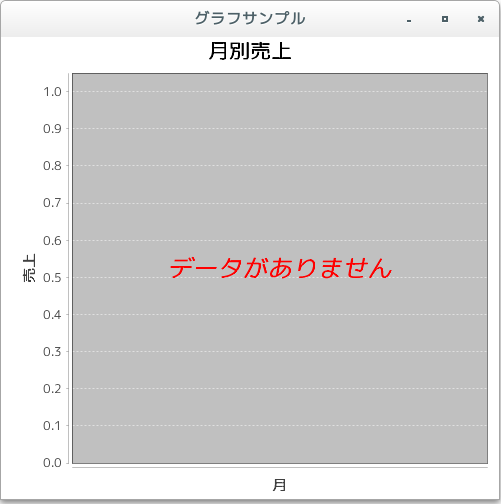
/**
 * データが無い時の文字色の指定(setNoDataMessagePaint)
 */
import org.jfree.chart.JFreeChart;
import org.jfree.chart.ChartFactory;
import org.jfree.data.category.DefaultCategoryDataset;
import org.jfree.chart.plot.PlotOrientation;

import javax.swing.JFrame;
import java.awt.BorderLayout;
import org.jfree.chart.ChartPanel;

import org.jfree.chart.plot.Plot;
import java.awt.Color;

public class Test14_1 extends JFrame{
  public static void main(String[] args) {
    Test14_1 frame = new Test14_1();

    frame.setDefaultCloseOperation(JFrame.EXIT_ON_CLOSE);
    frame.setBounds(10, 10, 500, 500);
    frame.setTitle("グラフサンプル");
    frame.setVisible(true);
  }

  Test14_1(){
    JFreeChart chart =
      ChartFactory.createBarChart("月別売上",
                                  "月",
                                  "売上",
                                  createData(),
                                  PlotOrientation.VERTICAL,
                                  true,
                                  false,
                                  false);

    Plot plot = chart.getPlot();
    plot.setNoDataMessage("データがありません");
    plot.setNoDataMessagePaint(Color.RED);

    ChartPanel cpanel = new ChartPanel(chart);
    getContentPane().add(cpanel, BorderLayout.CENTER);
  }

  private DefaultCategoryDataset createData(){
    DefaultCategoryDataset data = new DefaultCategoryDataset();

    return data;
  }
}
上記をコンパイルした後で実行すると次のように表示されます。

- データが無い時の文字フォントの指定(setNoDataMessageFont)
[ 目次 ]
データが設定されていない時に表示される文字列のフォントの指定方法を確認します。Plotクラスで用意されている「setNoDataMessageFont」メソッドを使います。
setNoDataMessageFont
public void setNoDataMessageFont(java.awt.Font font)
Sets the font used to display the 'no data' message and sends a PlotChangeEvent to all registered listeners.
Parameters:
font - the font (null not permitted).
引数にはFontクラスのオブジェクトを指定します。Fontクラスの詳細な使い方については「Fontクラス」を参照して下さい。
例えば次のように記述します。
JFreeChart chart = ChartFactory.createPieChart(...);      /* 引数は省略 */

Plot plot = chart.getPlot();
plot.setNoDataMessage("データがありません");
plot.setNoDataMessageFont(new Font("MS 明朝", Font.BOLD | Font.ITALIC, 24));
では簡単なサンプルを作成して試してみます。
サンプルプログラム
下記のサンプルを実行してみよう。
/**
 * データが無い時の文字フォントの指定(setNoDataMessageFont)
 */
import org.jfree.chart.JFreeChart;
import org.jfree.chart.ChartFactory;
import org.jfree.data.category.DefaultCategoryDataset;
import org.jfree.chart.plot.PlotOrientation;

import javax.swing.JFrame;
import java.awt.BorderLayout;
import org.jfree.chart.ChartPanel;

import org.jfree.chart.plot.Plot;
import java.awt.Color;
import java.awt.Font;

public class Test15_1 extends JFrame{
  public static void main(String[] args) {
    Test15_1 frame = new Test15_1();

    frame.setDefaultCloseOperation(JFrame.EXIT_ON_CLOSE);
    frame.setBounds(10, 10, 500, 500);
    frame.setTitle("グラフサンプル");
    frame.setVisible(true);
  }

  Test15_1(){
    JFreeChart chart =
      ChartFactory.createBarChart("月別売上",
                                  "月",
                                  "売上",
                                  createData(),
                                  PlotOrientation.VERTICAL,
                                  true,
                                  false,
                                  false);

    Plot plot = chart.getPlot();
    plot.setNoDataMessage("データがありません");
    plot.setNoDataMessagePaint(Color.RED);
    plot.setNoDataMessageFont(new Font("MS 明朝", Font.BOLD | Font.ITALIC, 24));

    ChartPanel cpanel = new ChartPanel(chart);
    getContentPane().add(cpanel, BorderLayout.CENTER);
  }

  private DefaultCategoryDataset createData(){
    DefaultCategoryDataset data = new DefaultCategoryDataset();

    return data;
  }
}
上記をコンパイルした後で実行すると次のように表示されます。
- リリースノート
[ 目次 ]- 2024/10/20 Ver=2.05 JDK_23 + jfreechart-1.0.19 で確認
- 2023/04/25 Ver=2.03 JDK_20 で確認
- 2021/08/08 Ver=1.03 JDK_16 で確認
- 2020/10/24 Ver=1.02 JDK_15 で確認
- 2017/02/11 Ver=1.01 初版リリース
- 関連ページ
[ 目次 ]