|
|
JFreeChart を使ったグラフ作成 バブルチャート(BubbleChart) |
H.Kamifuji . |
- はじめに
バブルチャート(BubbleChart)の作成に関して確認します。バブルチャートは二次元のグラフで3つの要素からなるデータを表現するために使用されるもので、3つ目の要素はグラフ上で表されるデータの大きさで表現します。
当ページでは、Linux CentOS7 の Gnome で動作テストしています。
現在(2021/08)では、JDK-16.0.2 にアップされています。一部、上位互換について、見直しを行っていきます。
現在(2023/04)では、JDK-20.0.1 にアップされています。一部、上位互換について、見直しを行っていきます。
現在(2024/10)では、JDK-23 に、アップされています。JDK-23 + jfreechart-1.0.19 で、上位互換について、見直しを行っていきます。
- 目 次
- バブルチャートの作成(createBubbleChartメソッド)
[ 目次 ]
バブルチャートの基本的な作成方法を確認します。
まずChartFactoryクラスの「createBubbleChart」メソッドを使ってバブルチャートを扱うJFreeChartクラスのオブジェクトを作成します。
createBubbleChart
public static JFreeChart createBubbleChart(java.lang.String title,
                                           java.lang.String xAxisLabel,
                                           java.lang.String yAxisLabel,
                                           XYZDataset dataset,
                                           PlotOrientation orientation,
                                           boolean legend,
                                           boolean tooltips,
                                           boolean urls)
Creates a bubble chart with default settings. The chart is composed of an XYPlot, with a NumberAxis for the domain axis, a NumberAxis for the range axis, and an XYBubbleRenderer to draw the data items.
Parameters:
title - the chart title (null permitted).
xAxisLabel - a label for the X-axis (null permitted).
yAxisLabel - a label for the Y-axis (null permitted).
dataset - the dataset for the chart (null permitted).
orientation - the orientation (horizontal or vertical) (null NOT permitted).
legend - a flag specifying whether or not a legend is required.
tooltips - configure chart to generate tool tips?
urls - configure chart to generate URLs?
Returns:
A bubble chart.
1番目の引数にグラフのタイトルを文字列で指定します。
2番目の引数にはX軸のラベルを文字列で指定します。3番目の引数にはY軸のラベルを文字列で指定します。
4番目の引数にはグラフのデータをXYZDatasetインターフェースを実装したクラスのオブジェクトで指定します。今回はMatrixSeriesCollectionクラスを使います。詳細は次のページで確認します。
5番目の引数にはグラフの向きを指定します。指定可能な値はorg.jfree.chart.plot.PlotOrientationクラスで定義されており、次のどちらかとなります。
PlotOrientation.VERTICAL    デフォルト
PlotOrientation.HORIZONTAL  X軸とY軸が反転
6番目の引数には凡例を表示するかどうかを「true」か「false」で指定します。
7番目の引数にはツールチップを作成するかどうかを「true」か「false」で指定します。
8番目の引数にはURLを作成するかどうかを「true」か「false」で指定します。
実際の使い方は次のようになります。
MatrixSeriesCollection data = new MatrixSeriesCollection();
JFreeChart chart = ChartFactory.createBubbleChart("収益分析",
                                                  "ページ数",
                                                  "更新頻度",
                                                  data,
                                                  PlotOrientation.VERTICAL,
                                                  true,
                                                  false,
                                                  false);
実際のデータの追加方法は次のページで確認します。
では簡単なサンプルを作成して試してみます。
サンプルプログラム
下記のサンプルを実行してみよう。
/**
 * バブルチャートの作成(createBubbleChartメソッド)
 */
import org.jfree.chart.JFreeChart;
import org.jfree.chart.ChartFactory;
import org.jfree.data.xy.MatrixSeriesCollection;
import org.jfree.chart.plot.PlotOrientation;

import javax.swing.JFrame;
import java.awt.BorderLayout;
import org.jfree.chart.ChartPanel;

public class Test1_1 extends JFrame{
  public static void main(String[] args) {
    Test1_1 frame = new Test1_1();

    frame.setDefaultCloseOperation(JFrame.EXIT_ON_CLOSE);
    frame.setBounds(10, 10, 500, 500);
    frame.setTitle("グラフサンプル");
    frame.setVisible(true);
  }

  Test1_1(){
    MatrixSeriesCollection data = new MatrixSeriesCollection();
    JFreeChart chart = ChartFactory.createBubbleChart("収益分析",
                                                 "ページ数",
                                                 "更新頻度",
                                                 data,
                                                 PlotOrientation.VERTICAL,
                                                 true,
                                                 false,
                                                 false);

    ChartPanel cpanel = new ChartPanel(chart);
    getContentPane().add(cpanel, BorderLayout.CENTER);
  }
}
上記をコンパイルした後で実行すると次のように表示されます。

- バブルチャートのデータ(MatrixSeriesCollectionクラス)
[ 目次 ]
バブルチャートでは系列を作成し個々のデータを系列に登録していきます。そして全ての系列を系列コレクションに追加します。
まずは系列コレクションを表すMatrixSeriesCollectionクラスのオブジェクトを作成します。
MatrixSeriesCollectionクラスのクラス図は次のようになっています。
java.lang.Object
 |
 +- org.jfree.data.general.AbstractDataset
     |
     +- org.jfree.data.general.AbstractSeriesDataset
         |
         +- org.jfree.data.xy.AbstractXYDataset
             |
             +- org.jfree.data.xy.AbstractXYZDataset
                 |
                 +- org.jfree.data.xy.MatrixSeriesCollection

public class MatrixSeriesCollection extends AbstractXYZDataset implements XYZDataset,
                                  org.jfree.util.PublicCloneable, java.io.Serializable
コンストラクタは2つ用意されています。デフォルトのコンストラクタは次のようになっています。
MatrixSeriesCollection
public MatrixSeriesCollection()
Constructs an empty dataset.
次のようにオブジェクトを作成します。
MatrixSeriesCollection data = new MatrixSeriesCollection();
これで系列を管理するオブジェクトが作成できました。次に系列を作成します。
系列の登録
系列はMatrixSeriesクラスを使います。クラス図は次のようになっています。
java.lang.Object
 |
 +- org.jfree.data.general.Series
     |
     +- org.jfree.data.xy.MatrixSeries

public class MatrixSeries extends Series implements java.io.Serializable
MatrixSeriesクラスのコンストラクタは1つ用意されています。
MatrixSeries
public MatrixSeries(java.lang.String name,
                    int rows,
                    int columns)
Constructs a new matrix series.
By default, all matrix items are initialzed to 0.
Parameters:
name - series name (null not permitted).
rows - the number of rows.
columns - the number of columns.
1番目の引数に系列の名前を指定します。バブルチャートでは全体を行と列で格子状の領域として扱います。2番目の引数で領域の行数を指定し、3番目の引数で領域の列数を指定します。バブルチャートでは行がY軸、列がX軸に該当します。
MatrixSeriesクラスのオブジェクトを作成したら、MatrixSeriesCollectionクラスで用意されている「addSeries」メソッドを使って系列を追加していきます。
addSeries
public void addSeries(MatrixSeries series)
Adds a series to the collection.
Notifies all registered listeners that the dataset has changed.
Parameters:
series - the series.
Throws:
java.lang.IllegalArgumentException
実際には次のように記述します。
MatrixSeriesCollection data = new MatrixSeriesCollection();

MatrixSeries series = new MatrixSeries("物販", 20, 20);
data.addSeries(series);
これで系列が出来ました。最後に系列に個々のデータを登録していきます。
データの登録
最後に系列に対してデータを登録していきます。MatrixSeriesクラスで用意されている「update」メソッドを使います。
update
public void update(int i,
                   int j,
                   double mij)
Updates the value of the specified item in this matrix series.
Parameters:
i - the row of the item.
j - the column of the item.
mij - the new value for the item.
1番目と2番目の引数で値を設定したい行と列を指定し、3番目の引数で値の大きさを設定します。値の大きさはグラフ上を行列の領域として見たときの直径となります。10×10の領域とした場合には値に10dを指定すると領域全体を埋め尽くす大きな円が描かれます(中心が領域の中心の場合)。
実際には次のように記述します。
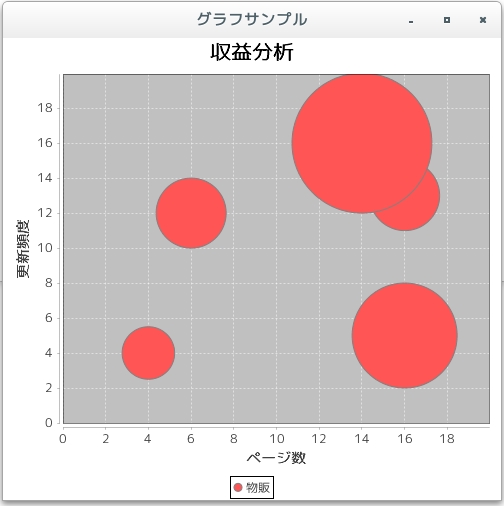
MatrixSeriesCollection data = new MatrixSeriesCollection();

MatrixSeries series = new MatrixSeries("物販", 20, 20);
series.update(5, 7, 10d);
series.update(10, 3, 3d);

data.addSeries(series);
では実際のデータを使って登録してみます。今回は次のようなデータを使用します。
行(更新頻度) 列(ページ数) 値 16 14 8 13 16 4 4 4 3 5 16 6 12 6 4
実際には次のように記述します。
MatrixSeriesCollection data = new MatrixSeriesCollection();

MatrixSeries series = new MatrixSeries("物販", 20, 20);
series.update(16, 14, 8d);
series.update(13, 16, 4d);
series.update(4, 4, 3d);
series.update(5, 16, 6d);
series.update(12, 6, 4d);

data.addSeries(series);
では簡単なサンプルを作成して試してみます。
サンプルプログラム
下記のサンプルを実行してみよう。
/**
 * バブルチャートのデータ(MatrixSeriesCollectionクラス)
 */
import org.jfree.chart.JFreeChart;
import org.jfree.chart.ChartFactory;
import org.jfree.data.xy.MatrixSeriesCollection;
import org.jfree.data.xy.MatrixSeries;
import org.jfree.chart.plot.PlotOrientation;

import javax.swing.JFrame;
import java.awt.BorderLayout;
import org.jfree.chart.ChartPanel;

public class Test2_1 extends JFrame{
  public static void main(String[] args) {
    Test2_1 frame = new Test2_1();

    frame.setDefaultCloseOperation(JFrame.EXIT_ON_CLOSE);
    frame.setBounds(10, 10, 500, 500);
    frame.setTitle("グラフサンプル");
    frame.setVisible(true);
  }

  Test2_1(){
    MatrixSeriesCollection data = new MatrixSeriesCollection();
    JFreeChart chart = ChartFactory.createBubbleChart("収益分析",
                                                 "ページ数",
                                                 "更新頻度",
                                                 createData(),
                                                 PlotOrientation.VERTICAL,
                                                 true,
                                                 false,
                                                 false);

    ChartPanel cpanel = new ChartPanel(chart);
    getContentPane().add(cpanel, BorderLayout.CENTER);
  }

  private MatrixSeriesCollection createData(){
    MatrixSeriesCollection data = new MatrixSeriesCollection();

    MatrixSeries series = new MatrixSeries("物販", 20, 20);
    series.update(16, 14, 8d);
    series.update(13, 16, 4d);
    series.update(4, 4, 3d);
    series.update(5, 16, 6d);
    series.update(12, 6, 4d);

    data.addSeries(series);

    return data;
  }
}
上記をコンパイルした後で実行すると次のように表示されます。
- 複数の系列のデータ
[ 目次 ]
バブルチャートの場合は複数の系列のデータを取り扱う事が可能です。
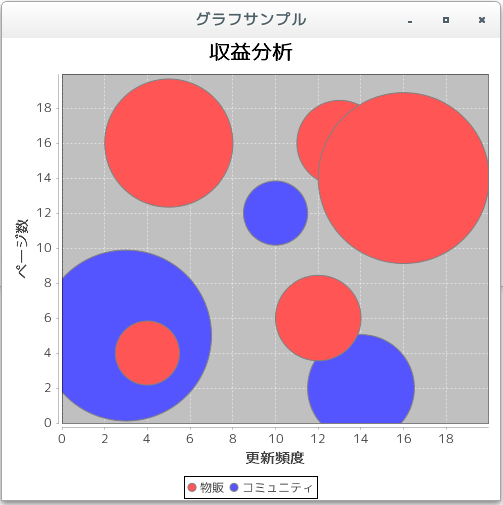
ここでは例として次のようなデータを元にグラフを作成します。
系列:物販
行(更新頻度) 列(ページ数) 値 16 14 8 13 16 4 4 4 3 5 16 6 12 6 4
系列:コミュニティ
行(更新頻度) 列(ページ数) 値 3 5 8 14 2 5 10 12 3
系列を表すMatrixSeriesクラスのオブジェクトを作成し、それぞれの系列にデータを登録していきます。
MatrixSeriesクラスのコンストラクタでは行と列の数を指定します。複数の系列を使用する時にそれぞれの系列で行と列の値が異なる場合は、全ての系列の中で最大の行数と最大の列数が使用されます。
実際には次のように記述します。
MatrixSeriesCollection data = new MatrixSeriesCollection();

MatrixSeries series1 = new MatrixSeries("物販", 20, 20);
series1.update(16, 14, 8d);
series1.update(13, 16, 4d);
series1.update(4, 4, 3d);
series1.update(5, 16, 6d);
series1.update(12, 6, 4d);

MatrixSeries series2 = new MatrixSeries("コミュニティ", 20, 20);
series2.update(3, 5, 8d);
series2.update(14, 2, 5d);
series2.update(10, 12, 3d);

data.addSeries(series1);
data.addSeries(series2);
では簡単なサンプルを作成して試してみます。
サンプルプログラム
下記のサンプルを実行してみよう。
/**
 * 複数の系列のデータ
 */
import org.jfree.chart.JFreeChart;
import org.jfree.chart.ChartFactory;
import org.jfree.data.xy.MatrixSeriesCollection;
import org.jfree.data.xy.MatrixSeries;
import org.jfree.chart.plot.PlotOrientation;

import javax.swing.JFrame;
import java.awt.BorderLayout;
import org.jfree.chart.ChartPanel;

public class Test3_1 extends JFrame{
  public static void main(String[] args) {
    Test3_1 frame = new Test3_1();

    frame.setDefaultCloseOperation(JFrame.EXIT_ON_CLOSE);
    frame.setBounds(10, 10, 500, 500);
    frame.setTitle("グラフサンプル");
    frame.setVisible(true);
  }

  Test3_1(){
    MatrixSeriesCollection data = new MatrixSeriesCollection();
    JFreeChart chart = ChartFactory.createBubbleChart("収益分析",
                                                 "ページ数",
                                                 "更新頻度",
                                                 createData(),
                                                 PlotOrientation.VERTICAL,
                                                 true,
                                                 false,
                                                 false);

    ChartPanel cpanel = new ChartPanel(chart);
    getContentPane().add(cpanel, BorderLayout.CENTER);
  }

  private MatrixSeriesCollection createData(){
    MatrixSeriesCollection data = new MatrixSeriesCollection();

    MatrixSeries series1 = new MatrixSeries("物販", 20, 20);
    series1.update(16, 14, 8d);
    series1.update(13, 16, 4d);
    series1.update(4, 4, 3d);
    series1.update(5, 16, 6d);
    series1.update(12, 6, 4d);

    MatrixSeries series2 = new MatrixSeries("コミュニティ", 20, 20);
    series2.update(3, 5, 8d);
    series2.update(14, 2, 5d);
    series2.update(10, 12, 3d);

    data.addSeries(series1);
    data.addSeries(series2);

    return data;
  }
}
上記をコンパイルした後で実行すると次のように表示されます。

- グラフの向きを変更
[ 目次 ]
バブルチャートではX軸とY軸の表示する位置を入れ替えて表示することが可能です。
「createBubbleChart」メソッドを使ってオブジェクトを作成する時の5番目の引数で指定します。指定できる値は次のいずれかです。
PlotOrientation.VERTICAL
PlotOrientation.HORIZONTAL
PlotOrientation.VERTICALとPlotOrientation.HORIZONTALを指定した場合ではX軸とY軸の位置関係が入れ替わるだけです。
実際には次のように記述します。
MatrixSeriesCollection data = new MatrixSeriesCollection();
JFreeChart chart = ChartFactory.createBubbleChart("収益分析",
                                                  "ページ数",
                                                  "更新頻度",
                                                  data,
                                                  PlotOrientation.HORIZONTAL,
                                                  true,
                                                  false,
                                                  false);
では簡単なサンプルを作成して試してみます。
サンプルプログラム
下記のサンプルを実行してみよう。
/**
 * グラフの向きを変更
 */
import org.jfree.chart.JFreeChart;
import org.jfree.chart.ChartFactory;
import org.jfree.data.xy.MatrixSeriesCollection;
import org.jfree.data.xy.MatrixSeries;
import org.jfree.chart.plot.PlotOrientation;

import javax.swing.JFrame;
import java.awt.BorderLayout;
import org.jfree.chart.ChartPanel;

public class Test4_1 extends JFrame{
  public static void main(String[] args) {
    Test4_1 frame = new Test4_1();

    frame.setDefaultCloseOperation(JFrame.EXIT_ON_CLOSE);
    frame.setBounds(10, 10, 500, 500);
    frame.setTitle("グラフサンプル");
    frame.setVisible(true);
  }

  Test4_1(){
    MatrixSeriesCollection data = new MatrixSeriesCollection();
    JFreeChart chart = ChartFactory.createBubbleChart("収益分析",
                                                 "ページ数",
                                                 "更新頻度",
                                                 createData(),
                                                 PlotOrientation.HORIZONTAL,
                                                 true,
                                                 false,
                                                 false);

    ChartPanel cpanel = new ChartPanel(chart);
    getContentPane().add(cpanel, BorderLayout.CENTER);
  }

  private MatrixSeriesCollection createData(){
    MatrixSeriesCollection data = new MatrixSeriesCollection();

    MatrixSeries series1 = new MatrixSeries("物販", 20, 20);
    series1.update(16, 14, 8d);
    series1.update(13, 16, 4d);
    series1.update(4, 4, 3d);
    series1.update(5, 16, 6d);
    series1.update(12, 6, 4d);

    MatrixSeries series2 = new MatrixSeries("コミュニティ", 20, 20);
    series2.update(3, 5, 8d);
    series2.update(14, 2, 5d);
    series2.update(10, 12, 3d);

    data.addSeries(series1);
    data.addSeries(series2);

    return data;
  }
}
上記をコンパイルした後で実行すると次のように表示されます。
- バブルチャートの描画領域(XYPlotクラス)
[ 目次 ]
グラフの描画領域を取得し、描画領域に対する設定を行っていきます。ファクトリメソッドを使ってJFreeChartクラスのオブジェクトを作成した場合は、JFreeChartクラスで用意されている「getPlot」メソッドを使ってPlotクラスのオブジェクトを取得します。
バブルチャートの場合には、取得したPlotクラスのオブジェクトを、PlotクラスのサブクラスであるXYPlotクラスにキャストして取得して使います。時系列グラフの場合と同じですので、詳しくは「時系列グラフの描画領域(XYPlotクラス)」を参照して下さい。
例えば次のように記述します。
JFreeChart chart = ChartFactory.createBubbleChart(...);      /* 引数は省略 */

XYPlot plot = (XYPlot)chart.getPlot();
では簡単なサンプルを作成して試してみます。
サンプルプログラム
下記のサンプルを実行してみよう。
/**
 * バブルチャートの描画領域(XYPlotクラス)
 */
import org.jfree.chart.JFreeChart;
import org.jfree.chart.ChartFactory;
import org.jfree.data.xy.MatrixSeriesCollection;
import org.jfree.data.xy.MatrixSeries;
import org.jfree.chart.plot.PlotOrientation;

import javax.swing.JFrame;
import java.awt.BorderLayout;
import org.jfree.chart.ChartPanel;

import org.jfree.chart.plot.XYPlot;
import java.awt.Color;

public class Test5_1 extends JFrame{
  public static void main(String[] args) {
    Test5_1 frame = new Test5_1();

    frame.setDefaultCloseOperation(JFrame.EXIT_ON_CLOSE);
    frame.setBounds(10, 10, 500, 500);
    frame.setTitle("グラフサンプル");
    frame.setVisible(true);
  }

  Test5_1(){
    MatrixSeriesCollection data = new MatrixSeriesCollection();
    JFreeChart chart = ChartFactory.createBubbleChart("収益分析",
                                                 "ページ数",
                                                 "更新頻度",
                                                 createData(),
                                                 PlotOrientation.VERTICAL,
                                                 true,
                                                 false,
                                                 false);

    XYPlot plot = (XYPlot)chart.getPlot();
    plot.setBackgroundPaint(Color.ORANGE);

    ChartPanel cpanel = new ChartPanel(chart);
    getContentPane().add(cpanel, BorderLayout.CENTER);
  }

  private MatrixSeriesCollection createData(){
    MatrixSeriesCollection data = new MatrixSeriesCollection();

    MatrixSeries series1 = new MatrixSeries("物販", 20, 20);
    series1.update(16, 14, 8d);
    series1.update(13, 16, 4d);
    series1.update(4, 4, 3d);
    series1.update(5, 16, 6d);
    series1.update(12, 6, 4d);

    MatrixSeries series2 = new MatrixSeries("コミュニティ", 20, 20);
    series2.update(3, 5, 8d);
    series2.update(14, 2, 5d);
    series2.update(10, 12, 3d);

    data.addSeries(series1);
    data.addSeries(series2);

    return data;
  }
}
上記をコンパイルした後で実行すると次のように表示されます。
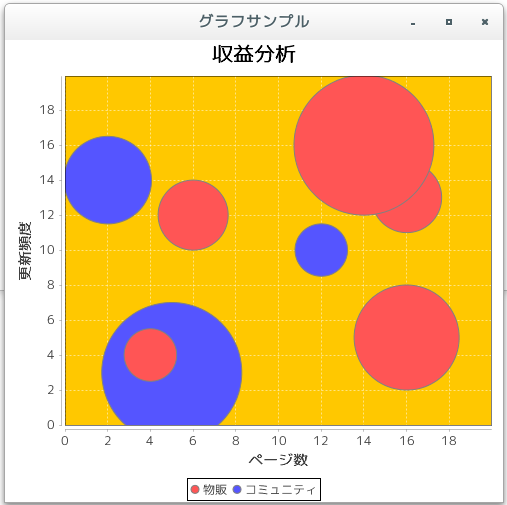
今回は例として描画領域の背景色をオレンジに変更しました。また上記のオレンジの箇所がグラフの描画領域となります。
- リリースノート
[ 目次 ]- 2024/10/20 Ver=2.05 JDK_23 + jfreechart-1.0.19 で確認
- 2023/04/25 Ver=2.03 JDK_20 で確認
- 2021/08/08 Ver=1.03 JDK_16 で確認
- 2020/10/25 Ver=1.02 JDK_15 で確認
- 2017/02/17 Ver=1.01 初版リリース
- 関連ページ
[ 目次 ]