|
|
matplotlib widgets_Examples 37_rectangle_selector. |
H.Kamifuji . |
- rectangle_selector.py
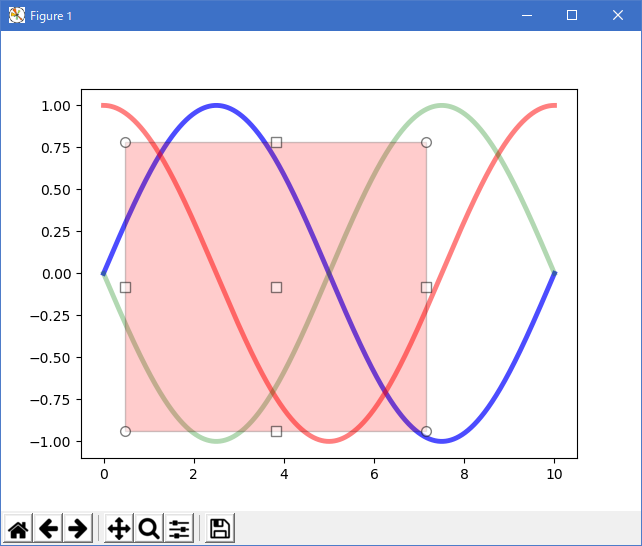
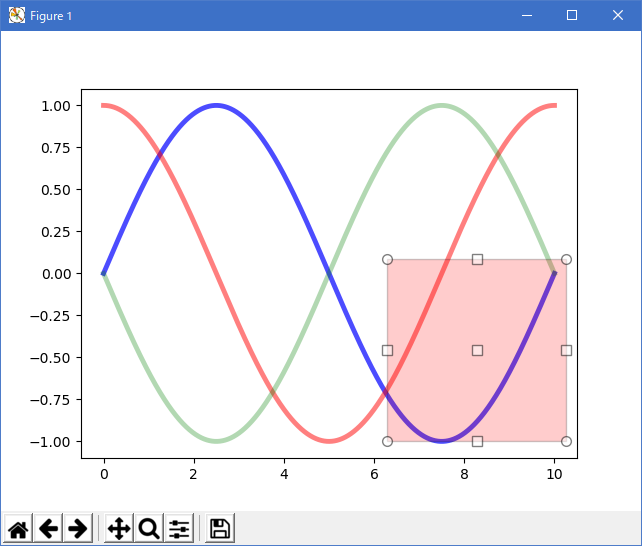
from __future__ import print_function
"""
Do a mouseclick somewhere, move the mouse to some destination, release
the button.  This class gives click- and release-events and also draws
a line or a box from the click-point to the actual mouseposition
(within the same axes) until the button is released.  Within the
method 'self.ignore()' it is checked whether the button from eventpress
and eventrelease are the same.

"""
from matplotlib.widgets import RectangleSelector
import numpy as np
import matplotlib.pyplot as plt


def line_select_callback(eclick, erelease):
    'eclick and erelease are the press and release events'
    x1, y1 = eclick.xdata, eclick.ydata
    x2, y2 = erelease.xdata, erelease.ydata
    print("(%3.2f, %3.2f) --> (%3.2f, %3.2f)" % (x1, y1, x2, y2))
    print(" The button you used were: %s %s" % (eclick.button, erelease.button))


def toggle_selector(event):
    print(' Key pressed.')
    if event.key in ['Q', 'q'] and toggle_selector.RS.active:
        print(' RectangleSelector deactivated.')
        toggle_selector.RS.set_active(False)
    if event.key in ['A', 'a'] and not toggle_selector.RS.active:
        print(' RectangleSelector activated.')
        toggle_selector.RS.set_active(True)


fig, current_ax = plt.subplots()                 # make a new plotting range
N = 100000                                       # If N is large one can see
x = np.linspace(0.0, 10.0, N)                    # improvement by use blitting!

plt.plot(x, +np.sin(.2*np.pi*x), lw=3.5, c='b', alpha=.7)  # plot something
plt.plot(x, +np.cos(.2*np.pi*x), lw=3.5, c='r', alpha=.5)
plt.plot(x, -np.sin(.2*np.pi*x), lw=3.5, c='g', alpha=.3)

print("\n      click  -->  release")

# drawtype is 'box' or 'line' or 'none'
toggle_selector.RS = RectangleSelector(current_ax, line_select_callback,
                                       drawtype='box', useblit=True,
                                       button=[1, 3],  # don't use middle button
                                       minspanx=5, minspany=5,
                                       spancoords='pixels',
                                       interactive=True)
plt.connect('key_press_event', toggle_selector)
plt.show()
- 実行結果( rectangle_selector.png )
Python 3.11.2 見直しました。上記のコードでは、下記のエラーが発生します。
rectangle_selector.txt
matplotlib 内部のエラーのようです。matplotlib の改修(先祖帰りバグの改修)を待つしかない。
Python 3.11.6 (matplotlib 3.7.1) では、下記のようなエラーがあり、実行できない。
click --> release Traceback (most recent call last): File "M:\______\rectangle_selector.py", line 45, inPython 3.12.0 (matplotlib 3.8.1) では、下記のようなエラーがあり、実行できない。toggle_selector.RS = RectangleSelector(current_ax, line_select_callback, ^^^^^^^^^^^^^^^^^^^^^^^^^^^^^^^^^^^^^^^^^^^^^^^^^^^ TypeError: RectangleSelector.__init__() got an unexpected keyword argument 'drawtype'
click --> release Traceback (most recent call last): File "E:\______\rectangle_selector.py", line 45, inPython 3.11.6 (matplotlib 3.7.1) 及び Python 3.12.0 (matplotlib 3.8.1) で、見直し中、新しいサンプル(widgets-rectangle-selector-py) を見つけ、下記のコードで、正常に実行できました。toggle_selector.RS = RectangleSelector(current_ax, line_select_callback, ^^^^^^^^^^^^^^^^^^^^^^^^^^^^^^^^^^^^^^^^^^^^^^^^^^^ TypeError: RectangleSelector.__init__() got an unexpected keyword argument 'drawtype'
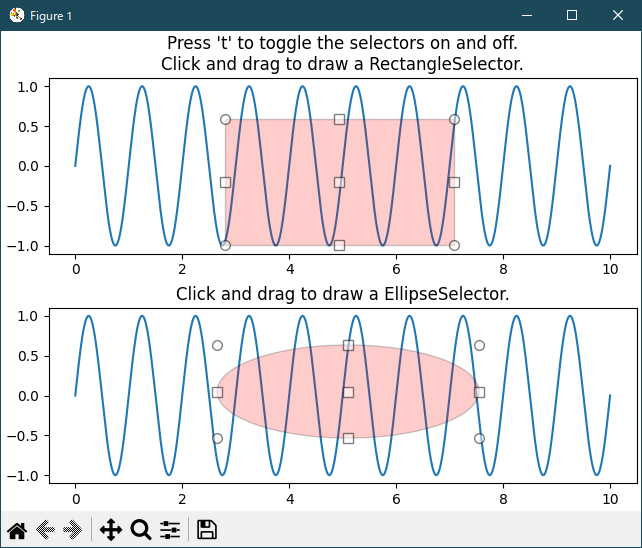
"""
===============================
Rectangle and ellipse selectors
===============================

Click somewhere, move the mouse, and release the mouse button.
`.RectangleSelector` and `.EllipseSelector` draw a rectangle or an ellipse
from the initial click position to the current mouse position (within the same
axes) until the button is released.  A connected callback receives the click-
and release-events.
"""

import matplotlib.pyplot as plt
import numpy as np

from matplotlib.widgets import EllipseSelector, RectangleSelector


def select_callback(eclick, erelease):
    """
    Callback for line selection.

    *eclick* and *erelease* are the press and release events.
    """
    x1, y1 = eclick.xdata, eclick.ydata
    x2, y2 = erelease.xdata, erelease.ydata
    print(f"({x1:3.2f}, {y1:3.2f}) --> ({x2:3.2f}, {y2:3.2f})")
    print(f"The buttons you used were: {eclick.button} {erelease.button}")


def toggle_selector(event):
    print('Key pressed.')
    if event.key == 't':
        for selector in selectors:
            name = type(selector).__name__
            if selector.active:
                print(f'{name} deactivated.')
                selector.set_active(False)
            else:
                print(f'{name} activated.')
                selector.set_active(True)


fig = plt.figure(layout='constrained')
axs = fig.subplots(2)

N = 100000  # If N is large one can see improvement by using blitting.
x = np.linspace(0, 10, N)

selectors = []
for ax, selector_class in zip(axs, [RectangleSelector, EllipseSelector]):
    ax.plot(x, np.sin(2*np.pi*x))  # plot something
    ax.set_title(f"Click and drag to draw a {selector_class.__name__}.")
    selectors.append(selector_class(
        ax, select_callback,
        useblit=True,
        button=[1, 3],  # disable middle button
        minspanx=5, minspany=5,
        spancoords='pixels',
        interactive=True))
    fig.canvas.mpl_connect('key_press_event', toggle_selector)
axs[0].set_title("Press 't' to toggle the selectors on and off.\n"
                 + axs[0].get_title())
plt.show()

# %%
#
# .. admonition:: References
#
#    The use of the following functions, methods, classes and modules is shown
#    in this example:
#
#    - `matplotlib.widgets.RectangleSelector`
#    - `matplotlib.widgets.EllipseSelector`
Python 3.11.6 (matplotlib 3.7.1) 及び Python 3.12.0 (matplotlib 3.8.1) 共に、正常実行です。
- 参照ページ
widgets_Examples code: rectangle_selector.py
widgets-rectangle-selector-py
- リリースノート
- 2023/12/13 Ver=1.04 Python 3.12.0 (matplotlib 3.8.1)で確認
- 2023/12/13 Ver=1.04 Python 3.11.6 (matplotlib 3.7.1)で確認
- 2023/04/06 Ver=1.03 Python 3.11.2 で確認
- 2020/11/03 Ver=1.01 Python 3.7.8 で確認
- 2018/12/08 Ver=1.01 初版リリース
- 関連ページ