|
|
matplotlib widgets_Examples 36_radio_buttons. |
H.Kamifuji . |
- radio_buttons.py
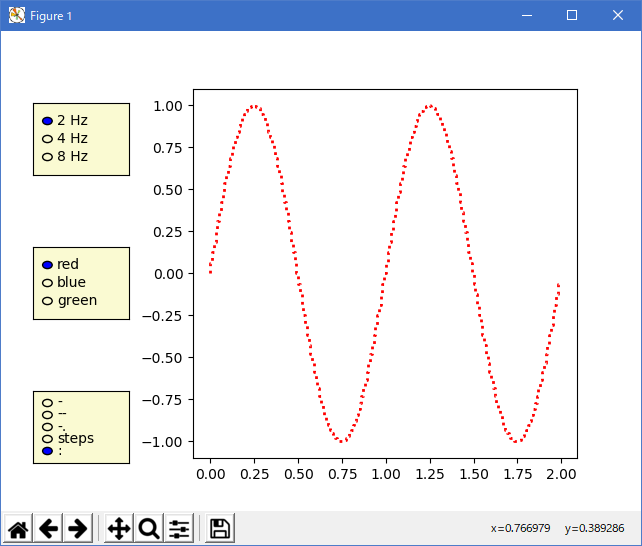
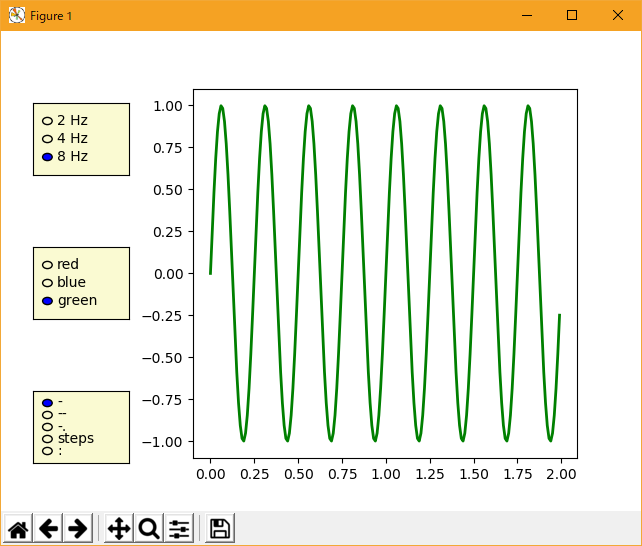
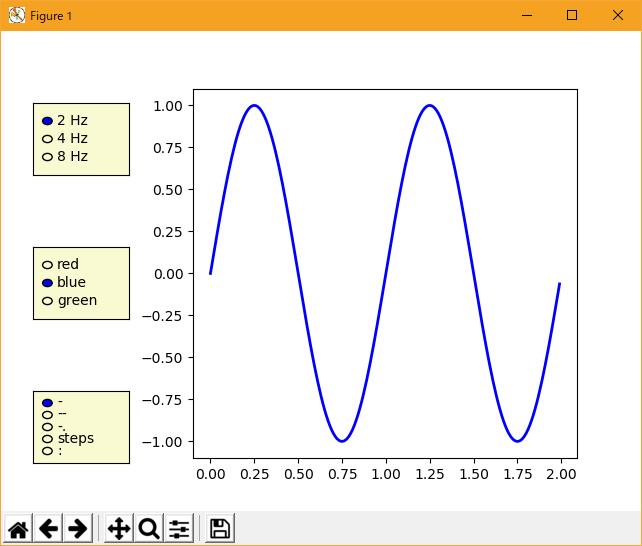
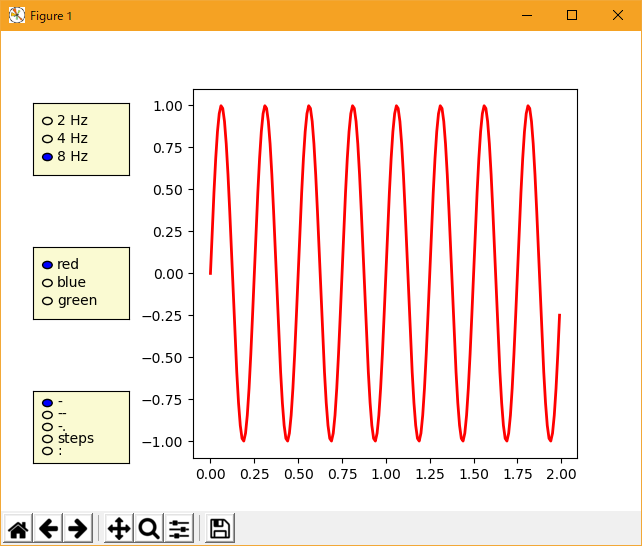
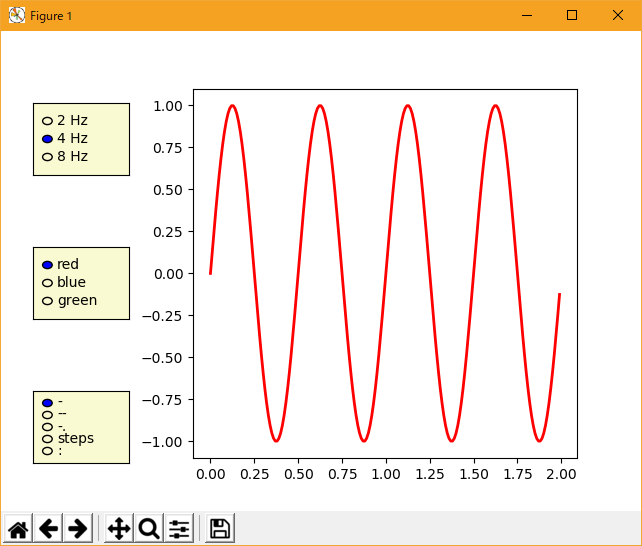
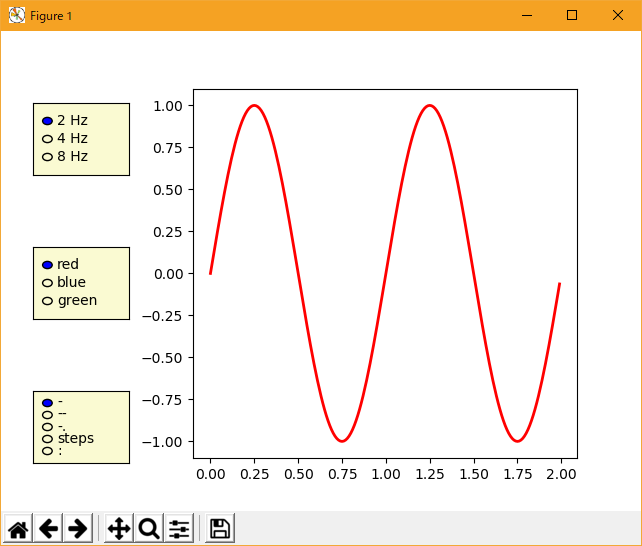
import numpy as np
import matplotlib.pyplot as plt
from matplotlib.widgets import RadioButtons

t = np.arange(0.0, 2.0, 0.01)
s0 = np.sin(2*np.pi*t)
s1 = np.sin(4*np.pi*t)
s2 = np.sin(8*np.pi*t)

fig, ax = plt.subplots()
l, = ax.plot(t, s0, lw=2, color='red')
plt.subplots_adjust(left=0.3)

axcolor = 'lightgoldenrodyellow'
rax = plt.axes([0.05, 0.7, 0.15, 0.15], facecolor=axcolor)
radio = RadioButtons(rax, ('2 Hz', '4 Hz', '8 Hz'))


def hzfunc(label):
    hzdict = {'2 Hz': s0, '4 Hz': s1, '8 Hz': s2}
    ydata = hzdict[label]
    l.set_ydata(ydata)
    plt.draw()
radio.on_clicked(hzfunc)

rax = plt.axes([0.05, 0.4, 0.15, 0.15], facecolor=axcolor)
radio2 = RadioButtons(rax, ('red', 'blue', 'green'))


def colorfunc(label):
    l.set_color(label)
    plt.draw()
radio2.on_clicked(colorfunc)

rax = plt.axes([0.05, 0.1, 0.15, 0.15], facecolor=axcolor)
radio3 = RadioButtons(rax, ('-', '--', '-.', 'steps', ':'))


def stylefunc(label):
    l.set_linestyle(label)
    plt.draw()
radio3.on_clicked(stylefunc)

plt.show()
- 実行結果( radio_buttons.png )
Python 3.11.6 (matplotlib 3.7.1) では、下記のような実行時エラーがある。
Traceback (most recent call last):
  File "C:\Users\______\AppData\Local\Programs\Python\Python311\Lib
    \site-packages\matplotlib\cbook\__init__.py", line 304, in process
    func(*args, **kwargs)
  File "M:\______\radio_buttons.py", line 40, in stylefunc
    l.set_linestyle(label)
  File "C:\Users\______\AppData\Local\Programs\Python\Python311\Lib
    \site-packages\matplotlib\lines.py", line 1171, in set_linestyle
    _api.check_in_list([*self._lineStyles, *ls_mapper_r], ls=ls)
  File "C:\Users\______\AppData\Local\Programs\Python\Python311\Lib
    \site-packages\matplotlib\_api\__init__.py", line 131, in check_in_list
    raise ValueError(msg)
ValueError: 'steps' is not a valid value for ls;
supported values are '-', '--', '-.', ':', 'None', ' ', '', 'solid', 'dashed', 'dashdot', 'dotted'
Python 3.12.0 (matplotlib 3.8.1) では、下記のような実行時エラーがある。
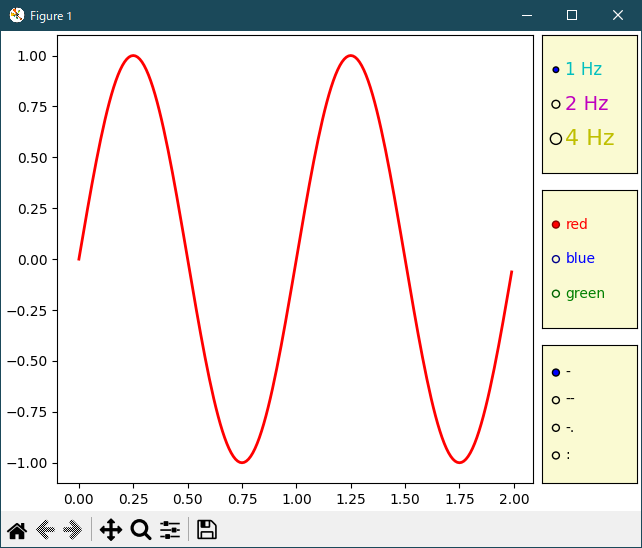
Traceback (most recent call last):
  File "C:\Program Files\Python312\Lib\site-packages\matplotlib\cbook.py",
    line 298, in process
    func(*args, **kwargs)
  File "E:\______\radio_buttons.py", line 40, in stylefunc
    l.set_linestyle(label)
  File "C:\Program Files\Python312\Lib\site-packages\matplotlib\lines.py",
    line 1172, in set_linestyle
    _api.check_in_list([*self._lineStyles, *ls_mapper_r], ls=ls)
  File "C:\Program Files\Python312\Lib\site-packages\matplotlib\_api\__init__.py",
    line 129, in check_in_list
    raise ValueError(msg)
ValueError: 'steps' is not a valid value for ls;
supported values are '-', '--', '-.', ':', 'None', ' ', '', 'solid', 'dashed', 'dashdot', 'dotted'
Python 3.11.6 (matplotlib 3.7.1) 及び Python 3.12.0 (matplotlib 3.8.1) で、見直し中、新しいサンプル(widgets-radio-buttons-py) を見つけ、下記のコードで、正常に実行できました。
"""
=============
Radio Buttons
=============

Using radio buttons to choose properties of your plot.

Radio buttons let you choose between multiple options in a visualization.
In this case, the buttons let the user choose one of the three different sine
waves to be shown in the plot.

Radio buttons may be styled using the *label_props* and *radio_props* parameters, which
each take a dictionary with keys of artist property names and values of lists of
settings with length matching the number of buttons.
"""

import matplotlib.pyplot as plt
import numpy as np

from matplotlib.widgets import RadioButtons

t = np.arange(0.0, 2.0, 0.01)
s0 = np.sin(2*np.pi*t)
s1 = np.sin(4*np.pi*t)
s2 = np.sin(8*np.pi*t)

fig, ax = plt.subplot_mosaic(
    [
        ['main', 'freq'],
        ['main', 'color'],
        ['main', 'linestyle'],
    ],
    width_ratios=[5, 1],
    layout='constrained',
)
l, = ax['main'].plot(t, s0, lw=2, color='red')

radio_background = 'lightgoldenrodyellow'

ax['freq'].set_facecolor(radio_background)
radio = RadioButtons(ax['freq'], ('1 Hz', '2 Hz', '4 Hz'),
                     label_props={'color': 'cmy', 'fontsize': [12, 14, 16]},
                     radio_props={'s': [16, 32, 64]})


def hzfunc(label):
    hzdict = {'1 Hz': s0, '2 Hz': s1, '4 Hz': s2}
    ydata = hzdict[label]
    l.set_ydata(ydata)
    fig.canvas.draw()
radio.on_clicked(hzfunc)

ax['color'].set_facecolor(radio_background)
radio2 = RadioButtons(
    ax['color'], ('red', 'blue', 'green'),
    label_props={'color': ['red', 'blue', 'green']},
    radio_props={
        'facecolor': ['red', 'blue', 'green'],
        'edgecolor': ['darkred', 'darkblue', 'darkgreen'],
    })


def colorfunc(label):
    l.set_color(label)
    fig.canvas.draw()
radio2.on_clicked(colorfunc)

ax['linestyle'].set_facecolor(radio_background)
radio3 = RadioButtons(ax['linestyle'], ('-', '--', '-.', ':'))


def stylefunc(label):
    l.set_linestyle(label)
    fig.canvas.draw()
radio3.on_clicked(stylefunc)

plt.show()

# %%
#
# .. admonition:: References
#
#    The use of the following functions, methods, classes and modules is shown
#    in this example:
#
#    - `matplotlib.widgets.RadioButtons`
Python 3.11.6 (matplotlib 3.7.1) 及び Python 3.12.0 (matplotlib 3.8.1) 共に、正常実行です。
ここで、一言。
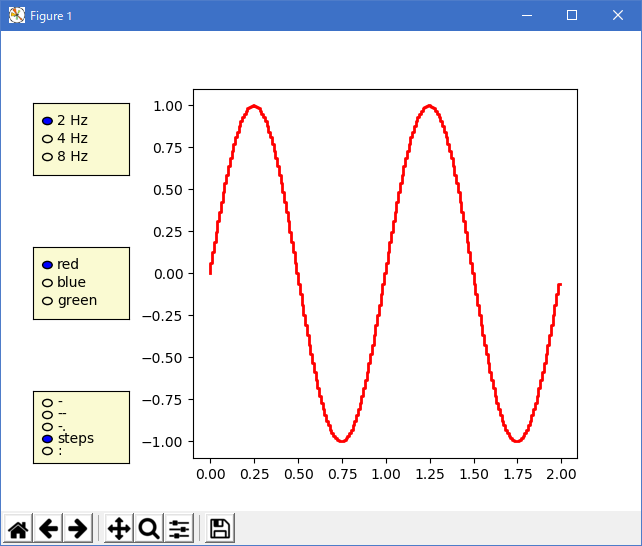
組込系の電子制御では、step 描画が重要です。
組込系でない方は、以下不問です。
タイミングが違う測定データを使用する場合、補間されたデータを使用すると、実態との相違がみき分けられない。
- 参照ページ
widgets_Examples code: radio_buttons.py
widgets-radio-buttons-py
- リリースノート
- 2023/12/13 Ver=1.04 Python 3.12.0 (matplotlib 3.8.1)で確認
- 2023/12/13 Ver=1.04 Python 3.11.6 (matplotlib 3.7.1)で確認
- 2023/04/06 Ver=1.03 Python 3.11.2 で確認
- 2020/11/03 Ver=1.01 Python 3.7.8 で確認
- 2018/12/08 Ver=1.01 初版リリース
- 関連ページ