|
|
matplotlib units_Examples 95_evans_test. |
H.Kamifuji . |
- evans_test.py
"単位"に応じて変換と異なるティックフォーマットをサポートするモックアップ "Foo" ユニットクラス。 ここでは、 "単位"はスカラ変換係数ですが、この例は、クライアントパッケージがどのような単位のパッケージを使用するかに完全に無関心であることを示しています。
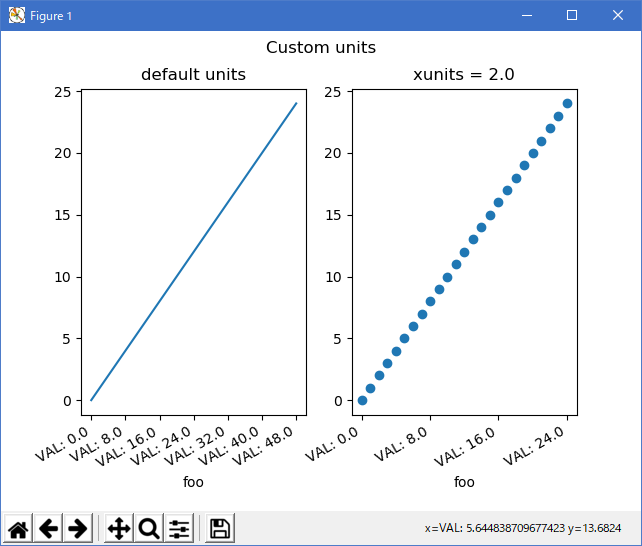
"""
==========
Evans test
==========

A mockup "Foo" units class which supports
conversion and different tick formatting depending on the "unit".
Here the "unit" is just a scalar conversion factor, but this example shows mpl
is entirely agnostic to what kind of units client packages use.

"""
from matplotlib.cbook import iterable
import matplotlib.units as units
import matplotlib.ticker as ticker
import matplotlib.pyplot as plt


class Foo(object):
    def __init__(self, val, unit=1.0):
        self.unit = unit
        self._val = val * unit

    def value(self, unit):
        if unit is None:
            unit = self.unit
        return self._val / unit


class FooConverter(object):
    @staticmethod
    def axisinfo(unit, axis):
        'return the Foo AxisInfo'
        if unit == 1.0 or unit == 2.0:
            return units.AxisInfo(
                majloc=ticker.IndexLocator(8, 0),
                majfmt=ticker.FormatStrFormatter("VAL: %s"),
                label='foo',
                )

        else:
            return None

    @staticmethod
    def convert(obj, unit, axis):
        """
        convert obj using unit.  If obj is a sequence, return the
        converted sequence
        """
        if units.ConversionInterface.is_numlike(obj):
            return obj

        if iterable(obj):
            return [o.value(unit) for o in obj]
        else:
            return obj.value(unit)

    @staticmethod
    def default_units(x, axis):
        'return the default unit for x or None'
        if iterable(x):
            for thisx in x:
                return thisx.unit
        else:
            return x.unit


units.registry[Foo] = FooConverter()

# create some Foos
x = []
for val in range(0, 50, 2):
    x.append(Foo(val, 1.0))

# and some arbitrary y data
y = [i for i in range(len(x))]


# plot specifying units
fig = plt.figure()
fig.suptitle("Custom units")
fig.subplots_adjust(bottom=0.2)
ax = fig.add_subplot(1, 2, 2)
ax.plot(x, y, 'o', xunits=2.0)
for label in ax.get_xticklabels():
    label.set_rotation(30)
    label.set_ha('right')
ax.set_title("xunits = 2.0")


# plot without specifying units; will use the None branch for axisinfo
ax = fig.add_subplot(1, 2, 1)
ax.plot(x, y)  # uses default units
ax.set_title('default units')
for label in ax.get_xticklabels():
    label.set_rotation(30)
    label.set_ha('right')

plt.show()
- 実行結果( evans_test.png )
Python 3.11.2 見直しました。上記のコードでは、下記のエラーが発生します。
evans_test.txt
matplotlib 内部のエラーのようです。matplotlib の改修(先祖帰りバグの改修)を待つしかない。
Python 3.11.6 (matplotlib 3.7.1) では、下記のようなエラーがあり、実行できない。
Traceback (most recent call last): File "M:\______\evans_test.py", line 12, in
Python 3.12.0 (matplotlib 3.8.1) では、下記のようなエラーがあり、実行できない。from matplotlib.cbook import iterable ImportError: cannot import name 'iterable' from 'matplotlib.cbook' (C:\Users\______\AppData\Local\Programs\Python\Python311\Lib \site-packages\matplotlib\cbook\__init__.py)
Traceback (most recent call last): File "E:\______\evans_test.py", line 12, in
Python 3.11.6 (matplotlib 3.7.1) 及び Python 3.12.0 (matplotlib 3.8.1) で、見直し中、新しいサンプル( units-evans-test-py ) を見つけ、下記のコードで、正常に実行できました。from matplotlib.cbook import iterable ImportError: cannot import name 'iterable' from 'matplotlib.cbook' (C:\Program Files\Python312\Lib\site-packages\matplotlib\cbook.py)
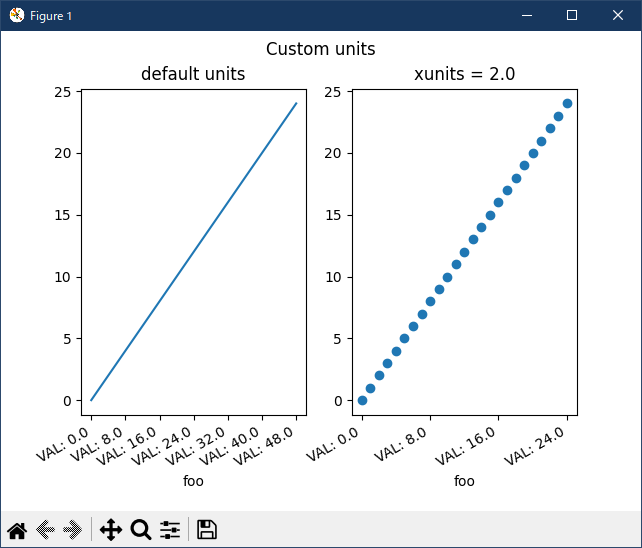
"""
==========
Evans test
==========

A mockup "Foo" units class which supports conversion and different tick
formatting depending on the "unit".  Here the "unit" is just a scalar
conversion factor, but this example shows that Matplotlib is entirely agnostic
to what kind of units client packages use.
"""

import matplotlib.pyplot as plt
import numpy as np

import matplotlib.ticker as ticker
import matplotlib.units as units


class Foo:
    def __init__(self, val, unit=1.0):
        self.unit = unit
        self._val = val * unit

    def value(self, unit):
        if unit is None:
            unit = self.unit
        return self._val / unit


class FooConverter(units.ConversionInterface):
    @staticmethod
    def axisinfo(unit, axis):
        """Return the Foo AxisInfo."""
        if unit == 1.0 or unit == 2.0:
            return units.AxisInfo(
                majloc=ticker.IndexLocator(8, 0),
                majfmt=ticker.FormatStrFormatter("VAL: %s"),
                label='foo',
                )

        else:
            return None

    @staticmethod
    def convert(obj, unit, axis):
        """
        Convert *obj* using *unit*.

        If *obj* is a sequence, return the converted sequence.
        """
        if np.iterable(obj):
            return [o.value(unit) for o in obj]
        else:
            return obj.value(unit)

    @staticmethod
    def default_units(x, axis):
        """Return the default unit for *x* or None."""
        if np.iterable(x):
            for thisx in x:
                return thisx.unit
        else:
            return x.unit


units.registry[Foo] = FooConverter()

# create some Foos
x = [Foo(val, 1.0) for val in range(0, 50, 2)]
# and some arbitrary y data
y = [i for i in range(len(x))]

fig, (ax1, ax2) = plt.subplots(1, 2)
fig.suptitle("Custom units")
fig.subplots_adjust(bottom=0.2)

# plot specifying units
ax2.plot(x, y, 'o', xunits=2.0)
ax2.set_title("xunits = 2.0")
plt.setp(ax2.get_xticklabels(), rotation=30, ha='right')

# plot without specifying units; will use the None branch for axisinfo
ax1.plot(x, y)  # uses default units
ax1.set_title('default units')
plt.setp(ax1.get_xticklabels(), rotation=30, ha='right')

plt.show()
Python 3.11.6 (matplotlib 3.7.1) 及び Python 3.12.0 (matplotlib 3.8.1) 共に、正常実行です。
- 参照ページ
units_Examples code: evans_test.py
units-evans-test-py
- リリースノート
- 2023/12/12 Ver=1.04 Python 3.12.0 (matplotlib 3.8.1)で確認
- 2023/12/12 Ver=1.04 Python 3.11.6 (matplotlib 3.7.1)で確認
- 2023/04/06 Ver=1.03 Python 3.11.2 で確認
- 2020/11/03 Ver=1.01 Python 3.7.8 で確認
- 2018/12/08 Ver=1.01 初版リリース
- 関連ページ