|
|
ticks_and_spines_Examples 87_tick_labels_from_values. |
H.Kamifuji . |
- tick_labels_from_values.py
ティックラベルを値のリストから設定する
ax.set_xticks を使用すると、現在選択されているティックに目盛りラベルが設定されます。 しかし、matplotlib にティック数とその間隔を動的に選択させることができます。
この場合、目盛りの値から目盛りのラベルを決定する方が良いかもしれません。 次の例は、これを行う方法を示しています。
注:ここで MaxNLocator を使用して、ティック値が整数値を取るようにします。
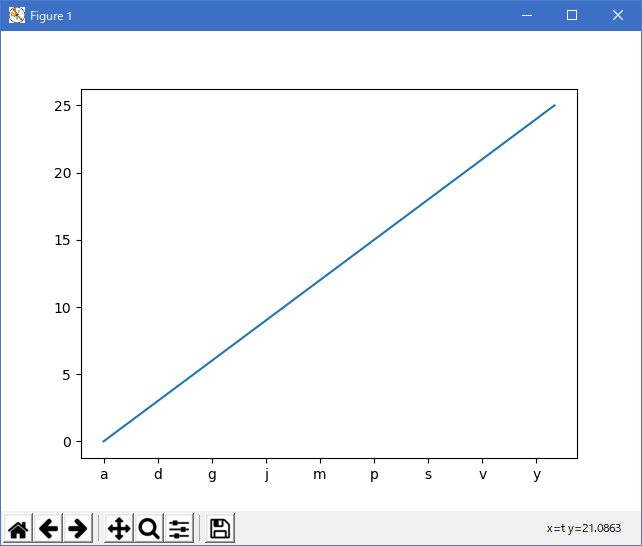
"""
=========================================
Setting tick labels from a list of values
=========================================

Using ax.set_xticks causes the tick labels to be set on the currently
chosen ticks. However, you may want to allow matplotlib to dynamically
choose the number of ticks and their spacing.

In this case it may be better to determine the tick label from the
value at the tick. The following example shows how to do this.

NB: The MaxNLocator is used here to ensure that the tick values
take integer values.

"""

import matplotlib.pyplot as plt
from matplotlib.ticker import FuncFormatter, MaxNLocator
fig = plt.figure()
ax = fig.add_subplot(111)
xs = range(26)
ys = range(26)
labels = list('abcdefghijklmnopqrstuvwxyz')


def format_fn(tick_val, tick_pos):
    if int(tick_val) in xs:
        return labels[int(tick_val)]
    else:
        return ''


ax.xaxis.set_major_formatter(FuncFormatter(format_fn))
ax.xaxis.set_major_locator(MaxNLocator(integer=True))
ax.plot(xs, ys)
plt.show()
- 実行結果( tick_labels_from_values.png )
- 参照ページ
ticks_and_spines_Examples code: tick_labels_from_values.py
- リリースノート
- 2023/04/06 Ver=1.03 Python 3.11.2 で確認
- 2020/11/03 Ver=1.01 Python 3.7.8 で確認
- 2018/12/07 Ver=1.01 初版リリース
- 関連ページ