|
|
matplotlib style_sheets_Examples 73_plot_grayscale. |
H.Kamifuji . |
- plot_grayscale.py
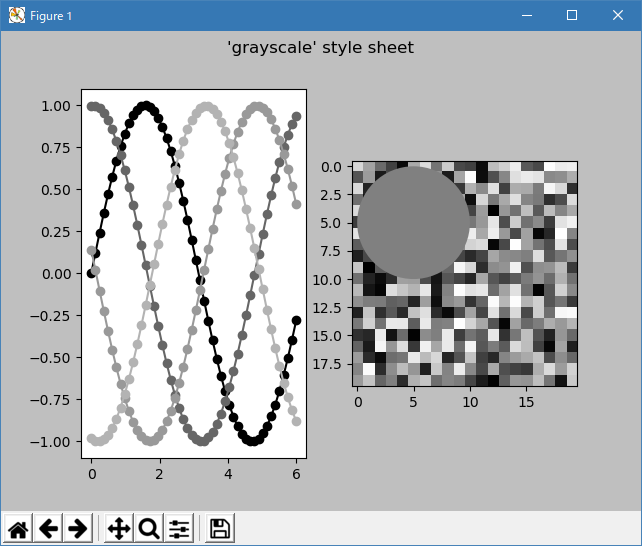
グレースケールスタイルシート
この例では、rc パラメータとして定義されているすべての色をグレースケールに変更する "グレースケール"スタイルシートを示します。 ただし、すべてのプロット要素がデフォルトで rc パラメータで定義された色になるわけではありません。
"""
=====================
Grayscale style sheet
=====================

This example demonstrates the "grayscale" style sheet, which changes all colors
that are defined as rc parameters to grayscale. Note, however, that not all
plot elements default to colors defined by an rc parameter.

"""
import numpy as np
import matplotlib.pyplot as plt


def color_cycle_example(ax):
    L = 6
    x = np.linspace(0, L)
    ncolors = len(plt.rcParams['axes.prop_cycle'])
    shift = np.linspace(0, L, ncolors, endpoint=False)
    for s in shift:
        ax.plot(x, np.sin(x + s), 'o-')


def image_and_patch_example(ax):
    ax.imshow(np.random.random(size=(20, 20)), interpolation='none')
    c = plt.Circle((5, 5), radius=5, label='patch')
    ax.add_patch(c)


plt.style.use('grayscale')

fig, (ax1, ax2) = plt.subplots(ncols=2)
fig.suptitle("'grayscale' style sheet")

color_cycle_example(ax1)
image_and_patch_example(ax2)

plt.show()
- 実行結果( plot_grayscale.png )
- 参照ページ
style_sheets_Examples code: plot_grayscale.py
- リリースノート
- 2023/04/05 Ver=1.03 Python 3.11.2 で確認
- 2020/11/02 Ver=1.01 Python 3.7.8 で確認
- 2018/12/07 Ver=1.01 初版リリース
- 関連ページ