|
|
matplotlib statistics_Examples 66_histogram_demo_multihist. |
H.Kamifuji . |
- histogram_demo_multihist.py
複数のデータセットを使用したヒストグラム(hist)関数のデモ
複数のサンプルセットを用いてヒストグラムをプロットし、
- *複数のサンプルセットでの凡例の使用
- *スタックバー
- *充填なしのステップカーブ
- *異なるサンプルサイズのデータセット
異なるビンの数とサイズを選択すると、ヒストグラムの形に大きく影響する場合があります。 Astropy のドキュメントには、これらのパラメータの選択方法に関する素晴らしいセクションがあります。http://docs.astropy.org/en/stable/visualization/histogram.html
この事例は、Windows10_1909 で Python 3.9.0 環境では、動作しません。( ax0.hist(x, n_bins, normed=1, histtype='bar', color=colors, label=colors) がデグレートしたのか? )
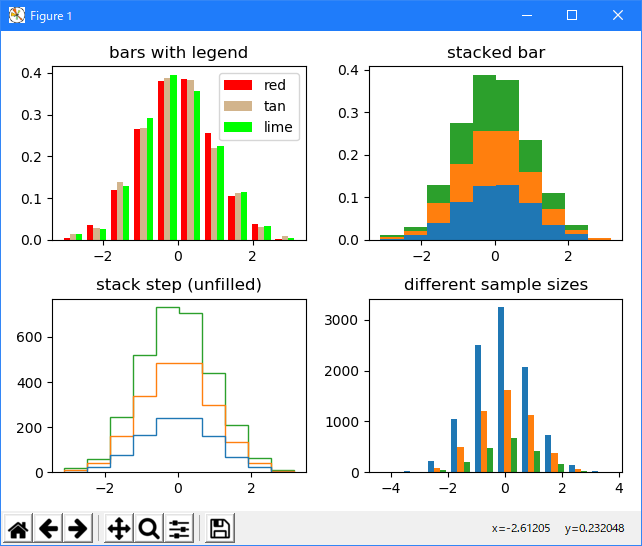
"""
=============================================================
Demo of the histogram (hist) function with multiple data sets
=============================================================

Plot histogram with multiple sample sets and demonstrate:

    * Use of legend with multiple sample sets
    * Stacked bars
    * Step curve with no fill
    * Data sets of different sample sizes

Selecting different bin counts and sizes can significantly affect the
shape of a histogram. The Astropy docs have a great section on how to
select these parameters:
http://docs.astropy.org/en/stable/visualization/histogram.html
"""

import numpy as np
import matplotlib.pyplot as plt

np.random.seed(0)

n_bins = 10
x = np.random.randn(1000, 3)

fig, axes = plt.subplots(nrows=2, ncols=2)
ax0, ax1, ax2, ax3 = axes.flatten()

colors = ['red', 'tan', 'lime']
ax0.hist(x, n_bins, normed=1, histtype='bar', color=colors, label=colors)
ax0.legend(prop={'size': 10})
ax0.set_title('bars with legend')

ax1.hist(x, n_bins, normed=1, histtype='bar', stacked=True)
ax1.set_title('stacked bar')

ax2.hist(x, n_bins, histtype='step', stacked=True, fill=False)
ax2.set_title('stack step (unfilled)')

# Make a multiple-histogram of data-sets with different length.
x_multi = [np.random.randn(n) for n in [10000, 5000, 2000]]
ax3.hist(x_multi, n_bins, histtype='bar')
ax3.set_title('different sample sizes')

fig.tight_layout()
plt.show()
- 実行結果( histogram_demo_multihist.png )
Python 3.11.2 見直しました。上記のコードでは、下記のエラーが発生します。
histogram_demo_multihist.txt
matplotlib 内部のエラーのようです。matplotlib の改修(先祖帰りバグの改修)を待つしかない。
Python 3.11.6 (matplotlib 3.7.1) では、下記のようなエラーがあり、実行できない。
Traceback (most recent call last): File "M:\______\histogram_demo_multihist.py", line 31, in
Python 3.12.0 (matplotlib 3.8.1) では、下記のようなエラーがあり、実行できない。ax0.hist(x, n_bins, normed=1, histtype='bar', color=colors, label=colors) File "C:\Users\______\AppData\Local\Programs\Python\Python311\Lib \site-packages\matplotlib\__init__.py", line 1459, in inner return func(ax, *map(sanitize_sequence, args), **kwargs) ^^^^^^^^^^^^^^^^^^^^^^^^^^^^^^^^^^^^^^^^^^^^^^^^^ File "C:\Users\______\AppData\Local\Programs\Python\Python311\Lib \site-packages\matplotlib\axes\_axes.py", line 6943, in hist p._internal_update(kwargs) File "C:\Users\______\AppData\Local\Programs\Python\Python311\Lib \site-packages\matplotlib\artist.py", line 1223, in _internal_update return self._update_props( ^^^^^^^^^^^^^^^^^^^ File "C:\Users\______\AppData\Local\Programs\Python\Python311\Lib \site-packages\matplotlib\artist.py", line 1197, in _update_props raise AttributeError( AttributeError: Rectangle.set() got an unexpected keyword argument 'normed'
Traceback (most recent call last): File "E:\______\histogram_demo_multihist.py", line 31, in
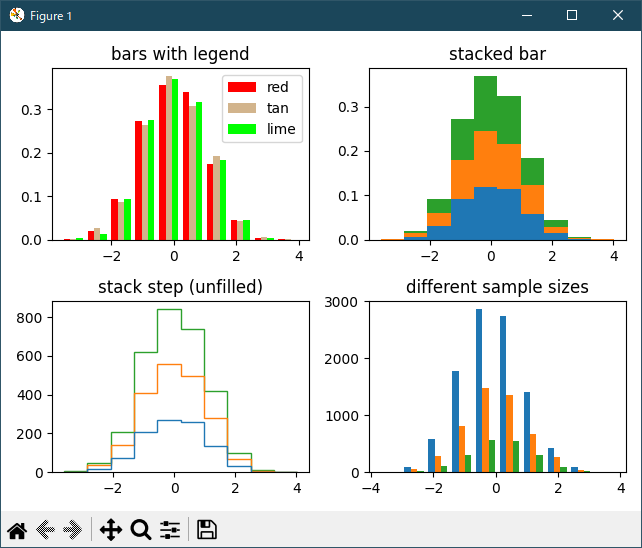
Python 3.11.6 (matplotlib 3.7.1) 及び Python 3.12.0 (matplotlib 3.8.1) で、見直し中、新しいサンプル(statistics-histogram-multihist-py) を見つけ、下記のコードで、正常に実行できました。ax0.hist(x, n_bins, normed=1, histtype='bar', color=colors, label=colors) File "C:\Program Files\Python312\Lib\site-packages\matplotlib\__init__.py", line 1478, in inner return func(ax, *map(sanitize_sequence, args), **kwargs) ^^^^^^^^^^^^^^^^^^^^^^^^^^^^^^^^^^^^^^^^^^^^^^^^^ File "C:\Program Files\Python312\Lib\site-packages\matplotlib\axes\_axes.py", line 7012, in hist p._internal_update(kwargs) File "C:\Program Files\Python312\Lib\site-packages\matplotlib\artist.py", line 1219, in _internal_update return self._update_props( ^^^^^^^^^^^^^^^^^^^ File "C:\Program Files\Python312\Lib\site-packages\matplotlib\artist.py", line 1193, in _update_props raise AttributeError( AttributeError: Rectangle.set() got an unexpected keyword argument 'normed'
"""
=====================================================
The histogram (hist) function with multiple data sets
=====================================================

Plot histogram with multiple sample sets and demonstrate:

* Use of legend with multiple sample sets
* Stacked bars
* Step curve with no fill
* Data sets of different sample sizes

Selecting different bin counts and sizes can significantly affect the
shape of a histogram. The Astropy docs have a great section on how to
select these parameters:
http://docs.astropy.org/en/stable/visualization/histogram.html
"""

import matplotlib.pyplot as plt
import numpy as np

np.random.seed(19680801)

n_bins = 10
x = np.random.randn(1000, 3)

fig, ((ax0, ax1), (ax2, ax3)) = plt.subplots(nrows=2, ncols=2)

colors = ['red', 'tan', 'lime']
ax0.hist(x, n_bins, density=True, histtype='bar', color=colors, label=colors)
ax0.legend(prop={'size': 10})
ax0.set_title('bars with legend')

ax1.hist(x, n_bins, density=True, histtype='bar', stacked=True)
ax1.set_title('stacked bar')

ax2.hist(x, n_bins, histtype='step', stacked=True, fill=False)
ax2.set_title('stack step (unfilled)')

# Make a multiple-histogram of data-sets with different length.
x_multi = [np.random.randn(n) for n in [10000, 5000, 2000]]
ax3.hist(x_multi, n_bins, histtype='bar')
ax3.set_title('different sample sizes')

fig.tight_layout()
plt.show()

# %%
#
# .. admonition:: References
#
#    The use of the following functions, methods, classes and modules is shown
#    in this example:
#
#    - `matplotlib.axes.Axes.hist` / `matplotlib.pyplot.hist`
Python 3.11.6 (matplotlib 3.7.1) 及び Python 3.12.0 (matplotlib 3.8.1) 共に、正常実行です。
- 参照ページ
statistics_Examples code: histogram_demo_multihist.py
statistics-histogram-multihist-py
- リリースノート
- 2023/12/10 Ver=1.04 Python 3.12.0 (matplotlib 3.8.1)で確認
- 2023/12/10 Ver=1.04 Python 3.11.6 (matplotlib 3.7.1)で確認
- 2023/04/05 Ver=1.03 Python 3.11.2 で確認
- 2020/11/02 Ver=1.01 Python 3.7.8 で確認
- 2018/12/06 Ver=1.01 初版リリース
- 関連ページ