|
|
matplotlib statistics_Examples 65_histogram_demo_histtypes. |
H.Kamifuji . |
- histogram_demo_histtypes.py
ヒストグラム関数の異なる "histtype" 設定のデモ
異なるビンの数とサイズを選択すると、ヒストグラムの形に大きく影響する場合があります。 Astropy のドキュメントには、これらのパラメータの選択方法に関する素晴らしいセクションがあります。http://docs.astropy.org/en/stable/visualization/histogram.html
この事例は、Windows10_1909 で Python 3.9.0 環境では、動作しません。( ax0.hist(x, 20, normed=1, histtype='stepfilled', facecolor='g', alpha=0.75) がデグレートしたのか? )
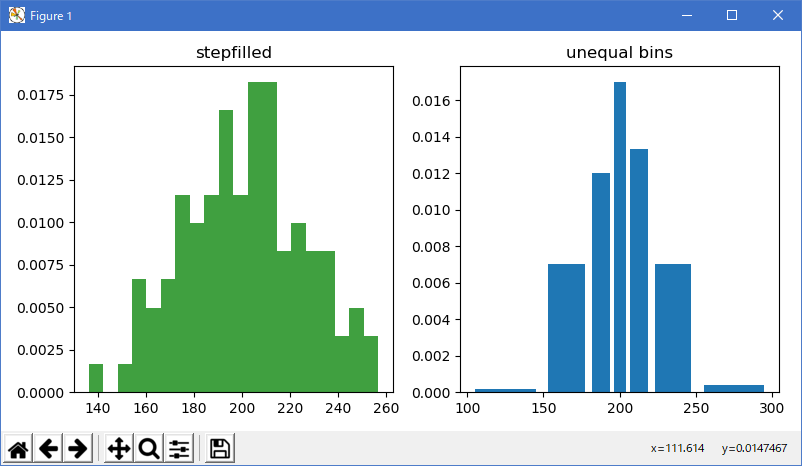
"""
================================================================
Demo of the histogram function's different ``histtype`` settings
================================================================

* Histogram with step curve that has a color fill.
* Histogram with custom and unequal bin widths.

Selecting different bin counts and sizes can significantly affect the
shape of a histogram. The Astropy docs have a great section on how to
select these parameters:
http://docs.astropy.org/en/stable/visualization/histogram.html
"""

import numpy as np
import matplotlib.pyplot as plt

np.random.seed(0)

mu = 200
sigma = 25
x = np.random.normal(mu, sigma, size=100)

fig, (ax0, ax1) = plt.subplots(ncols=2, figsize=(8, 4))

ax0.hist(x, 20, normed=1, histtype='stepfilled', facecolor='g', alpha=0.75)
ax0.set_title('stepfilled')

# Create a histogram by providing the bin edges (unequally spaced).
bins = [100, 150, 180, 195, 205, 220, 250, 300]
ax1.hist(x, bins, normed=1, histtype='bar', rwidth=0.8)
ax1.set_title('unequal bins')

fig.tight_layout()
plt.show()
- 実行結果( histogram_demo_histtypes.png )
Python 3.11.2 見直しました。上記のコードでは、下記のエラーが発生します。
histogram_demo_histtypes.txt
matplotlib 内部のエラーのようです。matplotlib の改修(先祖帰りバグの改修)を待つしかない。
Python 3.11.6 (matplotlib 3.7.1) では、下記のようなエラーがあり、実行できない。
Traceback (most recent call last): File "M:\______\histogram_demo_histtypes.py", line 26, in
Python 3.11.6 (matplotlib 3.7.1) では、下記のようなエラーがあり、実行できない。ax0.hist(x, 20, normed=1, histtype='stepfilled', facecolor='g', alpha=0.75) File "C:\Users\______\AppData\Local\Programs\Python\Python311\Lib \site-packages\matplotlib\__init__.py", line 1459, in inner return func(ax, *map(sanitize_sequence, args), **kwargs) ^^^^^^^^^^^^^^^^^^^^^^^^^^^^^^^^^^^^^^^^^^^^^^^^^ File "C:\Users\______\AppData\Local\Programs\Python\Python311\Lib \site-packages\matplotlib\axes\_axes.py", line 6943, in hist p._internal_update(kwargs) File "C:\Users\______\AppData\Local\Programs\Python\Python311\Lib \site-packages\matplotlib\artist.py", line 1223, in _internal_update return self._update_props( ^^^^^^^^^^^^^^^^^^^ File "C:\Users\____\AppData\Local\Programs\Python\Python311\Lib \site-packages\matplotlib\artist.py", line 1197, in _update_props raise AttributeError( AttributeError: Polygon.set() got an unexpected keyword argument 'normed'
Traceback (most recent call last): File "E:\______\histogram_demo_histtypes.py", line 26, in
Python 3.11.6 (matplotlib 3.7.1) 及び Python 3.12.0 (matplotlib 3.8.1) で、見直し中、新しいサンプル(statistics-histogram-histtypes-py) を見つけ、下記のコードで、正常に実行できました。ax0.hist(x, 20, normed=1, histtype='stepfilled', facecolor='g', alpha=0.75) File "C:\Program Files\Python312\Lib\site-packages\matplotlib\__init__.py", line 1478, in inner return func(ax, *map(sanitize_sequence, args), **kwargs) ^^^^^^^^^^^^^^^^^^^^^^^^^^^^^^^^^^^^^^^^^^^^^^^^^ File "C:\Program Files\Python312\Lib\site-packages\matplotlib\axes\_axes.py", line 7012, in hist p._internal_update(kwargs) File "C:\Program Files\Python312\Lib\site-packages\matplotlib\artist.py", line 1219, in _internal_update return self._update_props( ^^^^^^^^^^^^^^^^^^^ File "C:\Program Files\Python312\Lib\site-packages\matplotlib\artist.py", line 1193, in _update_props raise AttributeError( AttributeError: Polygon.set() got an unexpected keyword argument 'normed'
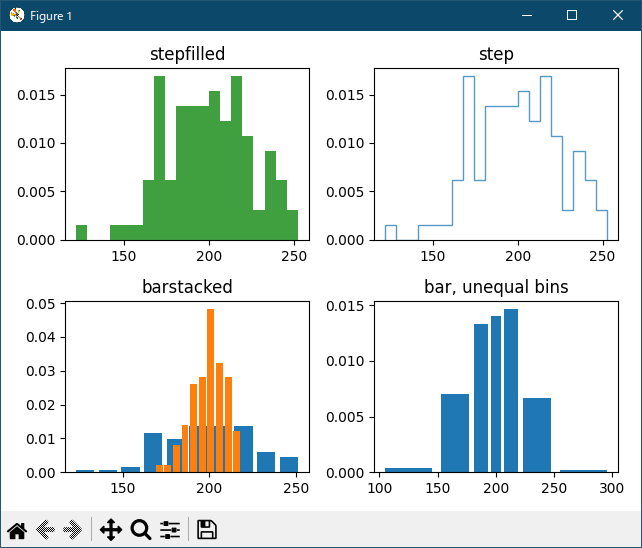
"""
================================================================
Demo of the histogram function's different ``histtype`` settings
================================================================

* Histogram with step curve that has a color fill.
* Histogram with step curve with no fill.
* Histogram with custom and unequal bin widths.
* Two histograms with stacked bars.

Selecting different bin counts and sizes can significantly affect the
shape of a histogram. The Astropy docs have a great section on how to
select these parameters:
http://docs.astropy.org/en/stable/visualization/histogram.html
"""

import matplotlib.pyplot as plt
import numpy as np

np.random.seed(19680801)

mu_x = 200
sigma_x = 25
x = np.random.normal(mu_x, sigma_x, size=100)

mu_w = 200
sigma_w = 10
w = np.random.normal(mu_w, sigma_w, size=100)

fig, axs = plt.subplots(nrows=2, ncols=2)

axs[0, 0].hist(x, 20, density=True, histtype='stepfilled', facecolor='g',
               alpha=0.75)
axs[0, 0].set_title('stepfilled')

axs[0, 1].hist(x, 20, density=True, histtype='step', facecolor='g',
               alpha=0.75)
axs[0, 1].set_title('step')

axs[1, 0].hist(x, density=True, histtype='barstacked', rwidth=0.8)
axs[1, 0].hist(w, density=True, histtype='barstacked', rwidth=0.8)
axs[1, 0].set_title('barstacked')

# Create a histogram by providing the bin edges (unequally spaced).
bins = [100, 150, 180, 195, 205, 220, 250, 300]
axs[1, 1].hist(x, bins, density=True, histtype='bar', rwidth=0.8)
axs[1, 1].set_title('bar, unequal bins')

fig.tight_layout()
plt.show()

# %%
#
# .. admonition:: References
#
#    The use of the following functions, methods, classes and modules is shown
#    in this example:
#
#    - `matplotlib.axes.Axes.hist` / `matplotlib.pyplot.hist`
Python 3.11.6 (matplotlib 3.7.1) 及び Python 3.12.0 (matplotlib 3.8.1) 共に、正常実行です。
- 参照ページ
statistics_Examples code: histogram_demo_histtypes.py
statistics-histogram-histtypes-py
- リリースノート
- 2023/12/10 Ver=1.04 Python 3.12.0 (matplotlib 3.8.1)で確認
- 2023/12/10 Ver=1.04 Python 3.11.6 (matplotlib 3.7.1)で確認
- 2023/04/05 Ver=1.03 Python 3.11.2 で確認
- 2020/11/02 Ver=1.01 Python 3.7.8 で確認
- 2018/12/06 Ver=1.01 初版リリース
- 関連ページ