|
|
matplotlib statistics_Examples 64_histogram_demo_features. |
H.Kamifuji . |
- histogram_demo_features.py
いくつかの機能を備えたヒストグラム(ヒストリー)関数のデモ
基本的なヒストグラムに加えて、このデモではいくつかのオプション機能を示します。
異なるビンの数とサイズを選択すると、ヒストグラムの形に大きく影響する場合があります。 Astropy のドキュメントには、これらのパラメータの選択方法に関する素晴らしいセクションがあります。http://docs.astropy.org/en/stable/visualization/histogram.htm
この事例は、Windows10_1909 で Python 3.9.0 環境では、動作しません。( n, bins, patches = ax.hist(x, num_bins, normed=1) がデグレートしたのか? )
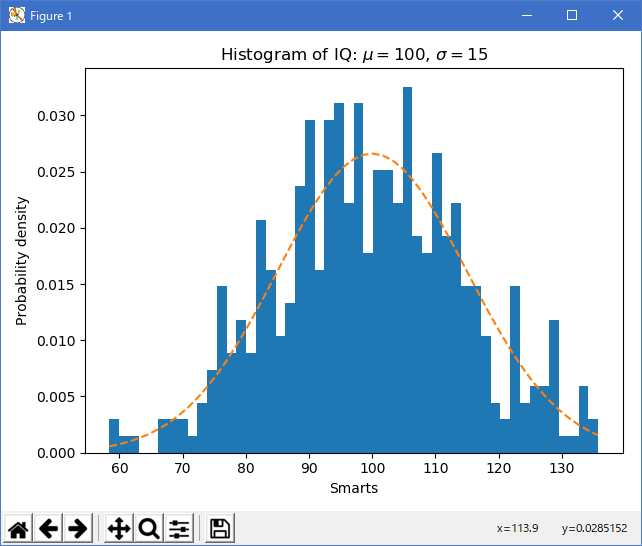
"""
=========================================================
Demo of the histogram (hist) function with a few features
=========================================================

In addition to the basic histogram, this demo shows a few optional
features:

    * Setting the number of data bins
    * The ``normed`` flag, which normalizes bin heights so that the
      integral of the histogram is 1. The resulting histogram is an
      approximation of the probability density function.
    * Setting the face color of the bars
    * Setting the opacity (alpha value).

Selecting different bin counts and sizes can significantly affect the
shape of a histogram. The Astropy docs have a great section on how to
select these parameters:
http://docs.astropy.org/en/stable/visualization/histogram.html
"""

import numpy as np
import matplotlib.mlab as mlab
import matplotlib.pyplot as plt

np.random.seed(0)

# example data
mu = 100  # mean of distribution
sigma = 15  # standard deviation of distribution
x = mu + sigma * np.random.randn(437)

num_bins = 50

fig, ax = plt.subplots()

# the histogram of the data
n, bins, patches = ax.hist(x, num_bins, normed=1)

# add a 'best fit' line
y = mlab.normpdf(bins, mu, sigma)
ax.plot(bins, y, '--')
ax.set_xlabel('Smarts')
ax.set_ylabel('Probability density')
ax.set_title(r'Histogram of IQ: $\mu=100$, $\sigma=15$')

# Tweak spacing to prevent clipping of ylabel
fig.tight_layout()
plt.show()
- 実行結果( histogram_demo_features.png )
Python 3.11.2 見直しました。上記のコードでは、下記のエラーが発生します。
histogram_demo_features.txt
matplotlib 内部のエラーのようです。matplotlib の改修(先祖帰りバグの改修)を待つしかない。
Python 3.11.6 (matplotlib 3.7.1) では、下記のようなエラーがあり、実行できない。
Traceback (most recent call last): File "M:\______\histogram_demo_features.py", line 38, in
Python 3.12.0 (matplotlib 3.8.1) では、下記のようなエラーがあり、実行できない。n, bins, patches = ax.hist(x, num_bins, normed=1) ^^^^^^^^^^^^^^^^^^^^^^^^^^^^^^ File "C:\Users\______\AppData\Local\Programs\Python\Python311\Lib \site-packages\matplotlib\__init__.py", line 1459, in inner return func(ax, *map(sanitize_sequence, args), **kwargs) ^^^^^^^^^^^^^^^^^^^^^^^^^^^^^^^^^^^^^^^^^^^^^^^^^ File "C:\Users\______\AppData\Local\Programs\Python\Python311\Lib \site-packages\matplotlib\axes\_axes.py", line 6943, in hist p._internal_update(kwargs) File "C:\Users\______\AppData\Local\Programs\Python\Python311\Lib \site-packages\matplotlib\artist.py", line 1223, in _internal_update return self._update_props( ^^^^^^^^^^^^^^^^^^^ File "C:\Users\______\AppData\Local\Programs\Python\Python311\Lib \site-packages\matplotlib\artist.py", line 1197, in _update_props raise AttributeError( AttributeError: Rectangle.set() got an unexpected keyword argument 'normed'
Traceback (most recent call last): File "E:\______\histogram_demo_features.py", line 38, in
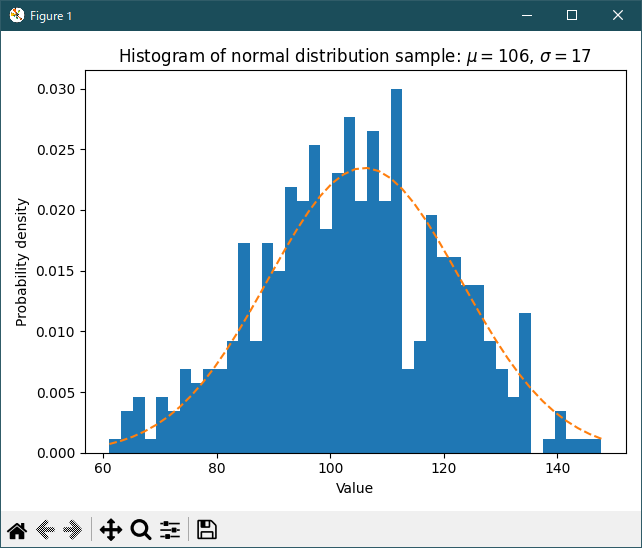
Python 3.11.6 (matplotlib 3.7.1) 及び Python 3.12.0 (matplotlib 3.8.1) で、見直し中、新しいサンプル( statistics-histogram-features-py ) を見つけ、下記のコードで、正常に実行できました。n, bins, patches = ax.hist(x, num_bins, normed=1) ^^^^^^^^^^^^^^^^^^^^^^^^^^^^^^ File "C:\Program Files\Python312\Lib\site-packages\matplotlib\__init__.py", line 1478, in inner return func(ax, *map(sanitize_sequence, args), **kwargs) ^^^^^^^^^^^^^^^^^^^^^^^^^^^^^^^^^^^^^^^^^^^^^^^^^ File "C:\Program Files\Python312\Lib\site-packages\matplotlib\axes\_axes.py", line 7012, in hist p._internal_update(kwargs) File "C:\Program Files\Python312\Lib\site-packages\matplotlib\artist.py", line 1219, in _internal_update return self._update_props( ^^^^^^^^^^^^^^^^^^^ File "C:\Program Files\Python312\Lib\site-packages\matplotlib\artist.py", line 1193, in _update_props raise AttributeError( AttributeError: Rectangle.set() got an unexpected keyword argument 'normed'
"""
==============================================
Some features of the histogram (hist) function
==============================================

In addition to the basic histogram, this demo shows a few optional features:

* Setting the number of data bins.
* The *density* parameter, which normalizes bin heights so that the integral of
  the histogram is 1. The resulting histogram is an approximation of the
  probability density function.

Selecting different bin counts and sizes can significantly affect the shape
of a histogram. The Astropy docs have a great section_ on how to select these
parameters.

.. _section: http://docs.astropy.org/en/stable/visualization/histogram.html
"""

import matplotlib.pyplot as plt
import numpy as np

rng = np.random.default_rng(19680801)

# example data
mu = 106  # mean of distribution
sigma = 17  # standard deviation of distribution
x = rng.normal(loc=mu, scale=sigma, size=420)

num_bins = 42

fig, ax = plt.subplots()

# the histogram of the data
n, bins, patches = ax.hist(x, num_bins, density=True)

# add a 'best fit' line
y = ((1 / (np.sqrt(2 * np.pi) * sigma)) *
     np.exp(-0.5 * (1 / sigma * (bins - mu))**2))
ax.plot(bins, y, '--')
ax.set_xlabel('Value')
ax.set_ylabel('Probability density')
ax.set_title('Histogram of normal distribution sample: '
             fr'$\mu={mu:.0f}$, $\sigma={sigma:.0f}$')

# Tweak spacing to prevent clipping of ylabel
fig.tight_layout()
plt.show()

# %%
#
# .. admonition:: References
#
#    The use of the following functions, methods, classes and modules is shown
#    in this example:
#
#    - `matplotlib.axes.Axes.hist` / `matplotlib.pyplot.hist`
#    - `matplotlib.axes.Axes.set_title`
#    - `matplotlib.axes.Axes.set_xlabel`
#    - `matplotlib.axes.Axes.set_ylabel`
Python 3.11.6 (matplotlib 3.7.1) 及び Python 3.12.0 (matplotlib 3.8.1) 共に、正常実行です。
- 参照ページ
statistics_Examples code: histogram_demo_features.py
statistics-histogram-features-py
- リリースノート
- 2023/12/10 Ver=1.04 Python 3.12.0 (matplotlib 3.8.1)で確認
- 2023/12/10 Ver=1.04 Python 3.11.6 (matplotlib 3.7.1)で確認
- 2023/04/05 Ver=1.03 Python 3.11.2 で確認
- 2020/11/02 Ver=1.01 Python 3.7.8 で確認
- 2018/12/06 Ver=1.01 初版リリース
- 関連ページ