|
matplotlib statistics_Examples 56_boxplot_vs_violin_demo. |
H.Kamifuji . |
- boxplot_vs_violin_demo.py
ボックスプロット対バイオリンプロット比較
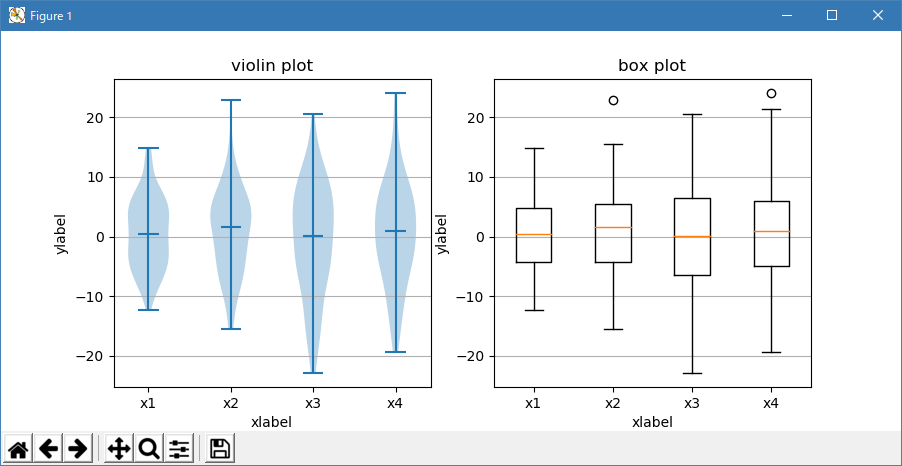
バイオリンプロットは Tukey(1977)のボックスプロットと密接に関連していますが、サンプルデータの分布(密度トレース)などの有用な情報が追加されます。
デフォルトでは、ボックス・プロットはウィスカの上下の外れ値として1.5 *四分位範囲外のデータ・ポイントを示しますが、バイオリン・プロットはデータの全範囲を示します。
ボックスプロットとその歴史に関するよくある参考資料は、http://vita.had.co.nz/papers/boxplots.pdf にあります。
バイオリンプロットには、matplotlib> = 1.4 が必要です。
バイオリンプロットの詳細については、scikit-learn ドキュメントには素晴らしいセクションがあります: http://scikit-learn.org/stable/modules/density.html
"""
===================================
Box plot vs. violin plot comparison
===================================

Note that although violin plots are closely related to Tukey's (1977)
box plots, they add useful information such as the distribution of the
sample data (density trace).

By default, box plots show data points outside 1.5 * the inter-quartile
range as outliers above or below the whiskers whereas violin plots show
the whole range of the data.

A good general reference on boxplots and their history can be found
here: http://vita.had.co.nz/papers/boxplots.pdf

Violin plots require matplotlib >= 1.4.

For more information on violin plots, the scikit-learn docs have a great
section: http://scikit-learn.org/stable/modules/density.html
"""

import matplotlib.pyplot as plt
import numpy as np

fig, axes = plt.subplots(nrows=1, ncols=2, figsize=(9, 4))

# generate some random test data
all_data = [np.random.normal(0, std, 100) for std in range(6, 10)]

# plot violin plot
axes[0].violinplot(all_data,
                   showmeans=False,
                   showmedians=True)
axes[0].set_title('violin plot')

# plot box plot
axes[1].boxplot(all_data)
axes[1].set_title('box plot')

# adding horizontal grid lines
for ax in axes:
    ax.yaxis.grid(True)
    ax.set_xticks([y+1 for y in range(len(all_data))])
    ax.set_xlabel('xlabel')
    ax.set_ylabel('ylabel')

# add x-tick labels
plt.setp(axes, xticks=[y+1 for y in range(len(all_data))],
         xticklabels=['x1', 'x2', 'x3', 'x4'])
plt.show()
- 実行結果( boxplot_vs_violin_demo.png )

- 参照ページ
statistics_Examples code: boxplot_vs_violin_demo.py
- リリースノート
- 2023/04/05 Ver=1.03 Python 3.11.2 で確認
- 2020/11/02 Ver=1.01 Python 3.7.8 で確認
- 2018/12/06 Ver=1.01 初版リリース
- 関連ページ