|
|
matplotlib statistics_Examples 55_boxplot_demo. |
H.Kamifuji . |
- boxplot_demo.py
ボックスプロットでのアーティストカスタマイズのデモ
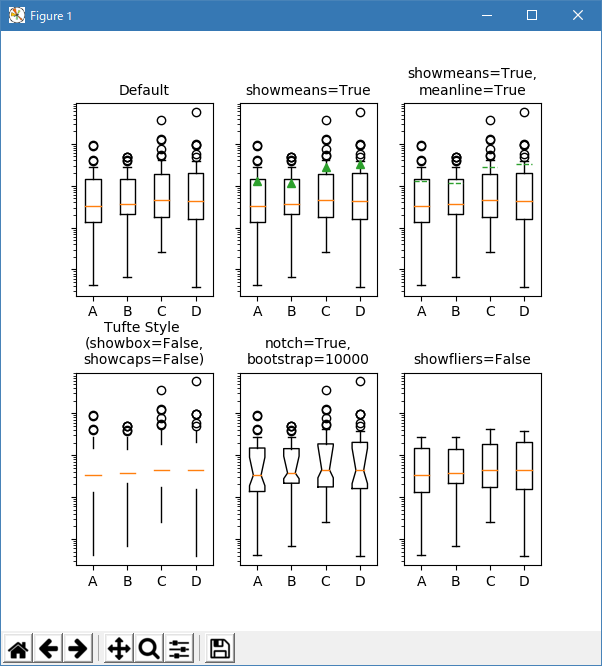
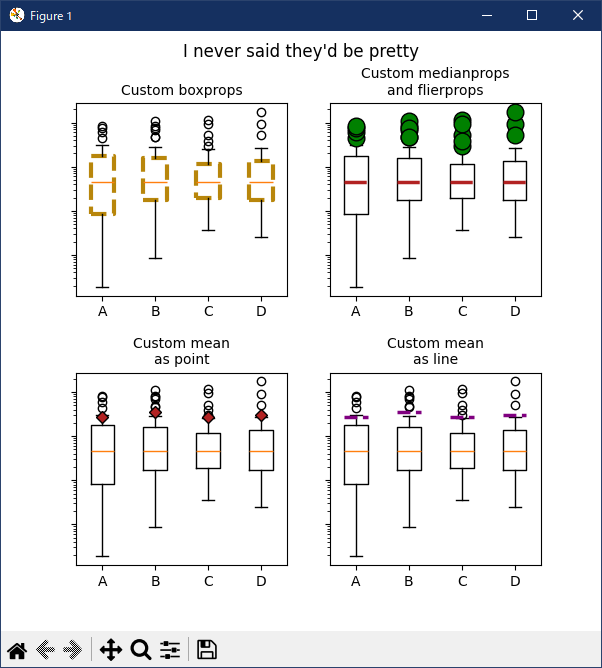
この例は、さまざまな kwarg を使ってボックスプロットを完全にカスタマイズする方法を示しています。 最初の図は、個々のコンポーネントを削除して追加する方法を示しています(デフォルトは表示されていない唯一の値です)。 2 番目の図は、アーティストのスタイルをカスタマイズする方法を示しています。 ウィスカの限界を特定のパーセンタイル(右下の軸)に設定する方法と、
ボックスプロットとその歴史に関するよくある参考資料は、http://vita.had.co.nz/papers/boxplots.pdf にあります。
"""
=========================================
Demo of artist customization in box plots
=========================================

This example demonstrates how to use the various kwargs
to fully customize box plots. The first figure demonstrates
how to remove and add individual components (note that the
mean is the only value not shown by default). The second
figure demonstrates how the styles of the artists can
be customized. It also demonstrates how to set the limit
of the whiskers to specific percentiles (lower right axes)

A good general reference on boxplots and their history can be found
here: http://vita.had.co.nz/papers/boxplots.pdf

"""

import numpy as np
import matplotlib.pyplot as plt

# fake data
np.random.seed(937)
data = np.random.lognormal(size=(37, 4), mean=1.5, sigma=1.75)
labels = list('ABCD')
fs = 10  # fontsize

# demonstrate how to toggle the display of different elements:
fig, axes = plt.subplots(nrows=2, ncols=3, figsize=(6, 6), sharey=True)
axes[0, 0].boxplot(data, labels=labels)
axes[0, 0].set_title('Default', fontsize=fs)

axes[0, 1].boxplot(data, labels=labels, showmeans=True)
axes[0, 1].set_title('showmeans=True', fontsize=fs)

axes[0, 2].boxplot(data, labels=labels, showmeans=True, meanline=True)
axes[0, 2].set_title('showmeans=True,\nmeanline=True', fontsize=fs)

axes[1, 0].boxplot(data, labels=labels, showbox=False, showcaps=False)
tufte_title = 'Tufte Style \n(showbox=False,\nshowcaps=False)'
axes[1, 0].set_title(tufte_title, fontsize=fs)

axes[1, 1].boxplot(data, labels=labels, notch=True, bootstrap=10000)
axes[1, 1].set_title('notch=True,\nbootstrap=10000', fontsize=fs)

axes[1, 2].boxplot(data, labels=labels, showfliers=False)
axes[1, 2].set_title('showfliers=False', fontsize=fs)

for ax in axes.flatten():
    ax.set_yscale('log')
    ax.set_yticklabels([])

fig.subplots_adjust(hspace=0.4)
plt.show()


# demonstrate how to customize the display different elements:
boxprops = dict(linestyle='--', linewidth=3, color='darkgoldenrod')
flierprops = dict(marker='o', markerfacecolor='green', markersize=12,
                  linestyle='none')
medianprops = dict(linestyle='-.', linewidth=2.5, color='firebrick')
meanpointprops = dict(marker='D', markeredgecolor='black',
                      markerfacecolor='firebrick')
meanlineprops = dict(linestyle='--', linewidth=2.5, color='purple')

fig, axes = plt.subplots(nrows=2, ncols=3, figsize=(6, 6), sharey=True)
axes[0, 0].boxplot(data, boxprops=boxprops)
axes[0, 0].set_title('Custom boxprops', fontsize=fs)

axes[0, 1].boxplot(data, flierprops=flierprops, medianprops=medianprops)
axes[0, 1].set_title('Custom medianprops\nand flierprops', fontsize=fs)

axes[0, 2].boxplot(data, whis='range')
axes[0, 2].set_title('whis="range"', fontsize=fs)

axes[1, 0].boxplot(data, meanprops=meanpointprops, meanline=False,
                   showmeans=True)
axes[1, 0].set_title('Custom mean\nas point', fontsize=fs)

axes[1, 1].boxplot(data, meanprops=meanlineprops, meanline=True,
                   showmeans=True)
axes[1, 1].set_title('Custom mean\nas line', fontsize=fs)

axes[1, 2].boxplot(data, whis=[15, 85])
axes[1, 2].set_title('whis=[15, 85]\n#percentiles', fontsize=fs)

for ax in axes.flatten():
    ax.set_yscale('log')
    ax.set_yticklabels([])

fig.suptitle("I never said they'd be pretty")
fig.subplots_adjust(hspace=0.4)
plt.show()
- 実行結果( boxplot_demo.png )

Python 3.11.2 見直しました。上記のコードでは、下記のエラーが発生します。
boxplot_demo.txt
matplotlib 内部のエラーのようです。matplotlib の改修(先祖帰りバグの改修)を待つしかない。
Python 3.11.6 (matplotlib 3.7.1) では、下記のようなエラーがあるが、一部分実行できる。
Traceback (most recent call last): File "M:\______\boxplot_demo.py", line 73, in
Python 3.12.0 (matplotlib 3.8.1) では、下記のようなエラーがあるが、一部分実行できる。axes[0, 2].boxplot(data, whis='range') File "C:\Users\______\AppData\Local\Programs\Python\Python311\Lib \site-packages\matplotlib\__init__.py", line 1459, in inner return func(ax, *map(sanitize_sequence, args), **kwargs) ^^^^^^^^^^^^^^^^^^^^^^^^^^^^^^^^^^^^^^^^^^^^^^^^^ File "C:\Users\______\AppData\Local\Programs\Python\Python311\Lib \site-packages\matplotlib\axes\_axes.py", line 3914, in boxplot bxpstats = cbook.boxplot_stats(x, whis=whis, bootstrap=bootstrap, ^^^^^^^^^^^^^^^^^^^^^^^^^^^^^^^^^^^^^^^^^^^^^^^^^^^^^^ File "C:\Users\______\AppData\Local\Programs\Python\Python311\Lib \site-packages\matplotlib\cbook\__init__.py", line 1254, in boxplot_stats raise ValueError('whis must be a float or list of percentiles') ValueError: whis must be a float or list of percentiles
Traceback (most recent call last): File "E:\______\boxplot_demo.py", line 73, in
Python 3.11.6 (matplotlib 3.7.1) 及び Python 3.12.0 (matplotlib 3.8.1) で、見直し中、新しいサンプル(statistics-bxp-py) を見つけ、下記のコードで、正常に実行できました。axes[0, 2].boxplot(data, whis='range') File "C:\Program Files\Python312\Lib\site-packages\matplotlib\__init__.py", line 1478, in inner return func(ax, *map(sanitize_sequence, args), **kwargs) ^^^^^^^^^^^^^^^^^^^^^^^^^^^^^^^^^^^^^^^^^^^^^^^^^ File "C:\Program Files\Python312\Lib\site-packages\matplotlib\axes\_axes.py", line 3947, in boxplot bxpstats = cbook.boxplot_stats(x, whis=whis, bootstrap=bootstrap, ^^^^^^^^^^^^^^^^^^^^^^^^^^^^^^^^^^^^^^^^^^^^^^^^^^^^^^ File "C:\Program Files\Python312\Lib\site-packages\matplotlib\cbook.py", line 1264, in boxplot_stats raise ValueError('whis must be a float or list of percentiles') ValueError: whis must be a float or list of percentiles
"""
=======================
Boxplot drawer function
=======================

This example demonstrates how to pass pre-computed box plot
statistics to the box plot drawer. The first figure demonstrates
how to remove and add individual components (note that the
mean is the only value not shown by default). The second
figure demonstrates how the styles of the artists can
be customized.

A good general reference on boxplots and their history can be found
here: http://vita.had.co.nz/papers/boxplots.pdf
"""

import matplotlib.pyplot as plt
import numpy as np

import matplotlib.cbook as cbook

# fake data
np.random.seed(19680801)
data = np.random.lognormal(size=(37, 4), mean=1.5, sigma=1.75)
labels = list('ABCD')

# compute the boxplot stats
stats = cbook.boxplot_stats(data, labels=labels, bootstrap=10000)

# %%
# After we've computed the stats, we can go through and change anything.
# Just to prove it, I'll set the median of each set to the median of all
# the data, and double the means

for n in range(len(stats)):
    stats[n]['med'] = np.median(data)
    stats[n]['mean'] *= 2

print(list(stats[0]))

fs = 10  # fontsize

# %%
# Demonstrate how to toggle the display of different elements:

fig, axs = plt.subplots(nrows=2, ncols=3, figsize=(6, 6), sharey=True)
axs[0, 0].bxp(stats)
axs[0, 0].set_title('Default', fontsize=fs)

axs[0, 1].bxp(stats, showmeans=True)
axs[0, 1].set_title('showmeans=True', fontsize=fs)

axs[0, 2].bxp(stats, showmeans=True, meanline=True)
axs[0, 2].set_title('showmeans=True,\nmeanline=True', fontsize=fs)

axs[1, 0].bxp(stats, showbox=False, showcaps=False)
tufte_title = 'Tufte Style\n(showbox=False,\nshowcaps=False)'
axs[1, 0].set_title(tufte_title, fontsize=fs)

axs[1, 1].bxp(stats, shownotches=True)
axs[1, 1].set_title('notch=True', fontsize=fs)

axs[1, 2].bxp(stats, showfliers=False)
axs[1, 2].set_title('showfliers=False', fontsize=fs)

for ax in axs.flat:
    ax.set_yscale('log')
    ax.set_yticklabels([])

fig.subplots_adjust(hspace=0.4)
plt.show()

# %%
# Demonstrate how to customize the display different elements:

boxprops = dict(linestyle='--', linewidth=3, color='darkgoldenrod')
flierprops = dict(marker='o', markerfacecolor='green', markersize=12,
                  linestyle='none')
medianprops = dict(linestyle='-.', linewidth=2.5, color='firebrick')
meanpointprops = dict(marker='D', markeredgecolor='black',
                      markerfacecolor='firebrick')
meanlineprops = dict(linestyle='--', linewidth=2.5, color='purple')

fig, axs = plt.subplots(nrows=2, ncols=2, figsize=(6, 6), sharey=True)
axs[0, 0].bxp(stats, boxprops=boxprops)
axs[0, 0].set_title('Custom boxprops', fontsize=fs)

axs[0, 1].bxp(stats, flierprops=flierprops, medianprops=medianprops)
axs[0, 1].set_title('Custom medianprops\nand flierprops', fontsize=fs)

axs[1, 0].bxp(stats, meanprops=meanpointprops, meanline=False,
              showmeans=True)
axs[1, 0].set_title('Custom mean\nas point', fontsize=fs)

axs[1, 1].bxp(stats, meanprops=meanlineprops, meanline=True,
              showmeans=True)
axs[1, 1].set_title('Custom mean\nas line', fontsize=fs)

for ax in axs.flat:
    ax.set_yscale('log')
    ax.set_yticklabels([])

fig.suptitle("I never said they'd be pretty")
fig.subplots_adjust(hspace=0.4)
plt.show()

# %%
#
# .. admonition:: References
#
#    The use of the following functions, methods, classes and modules is shown
#    in this example:
#
#    - `matplotlib.axes.Axes.bxp`
#    - `matplotlib.cbook.boxplot_stats`
Python 3.11.6 (matplotlib 3.7.1) 及び Python 3.12.0 (matplotlib 3.8.1) 共に、正常実行です。

['label', 'mean', 'iqr', 'cilo', 'cihi', 'whishi', 'whislo', 'fliers', 'q1', 'med', 'q3']
- 参照ページ
statistics_Examples code: boxplot_demo.py
statistics-bxp-py
- リリースノート
- 2023/12/10 Ver=1.04 Python 3.12.0 (matplotlib 3.8.1)で確認
- 2023/12/10 Ver=1.04 Python 3.11.6 (matplotlib 3.7.1)で確認
- 2023/04/05 Ver=1.03 Python 3.11.2 で確認
- 2020/11/02 Ver=1.01 Python 3.7.8 で確認
- 2018/12/06 Ver=1.01 初版リリース
- 関連ページ