|
|
specialty_plots_Examples 53_topographic_hillshading. |
H.Kamifuji . |
- topographic_hillshading.py
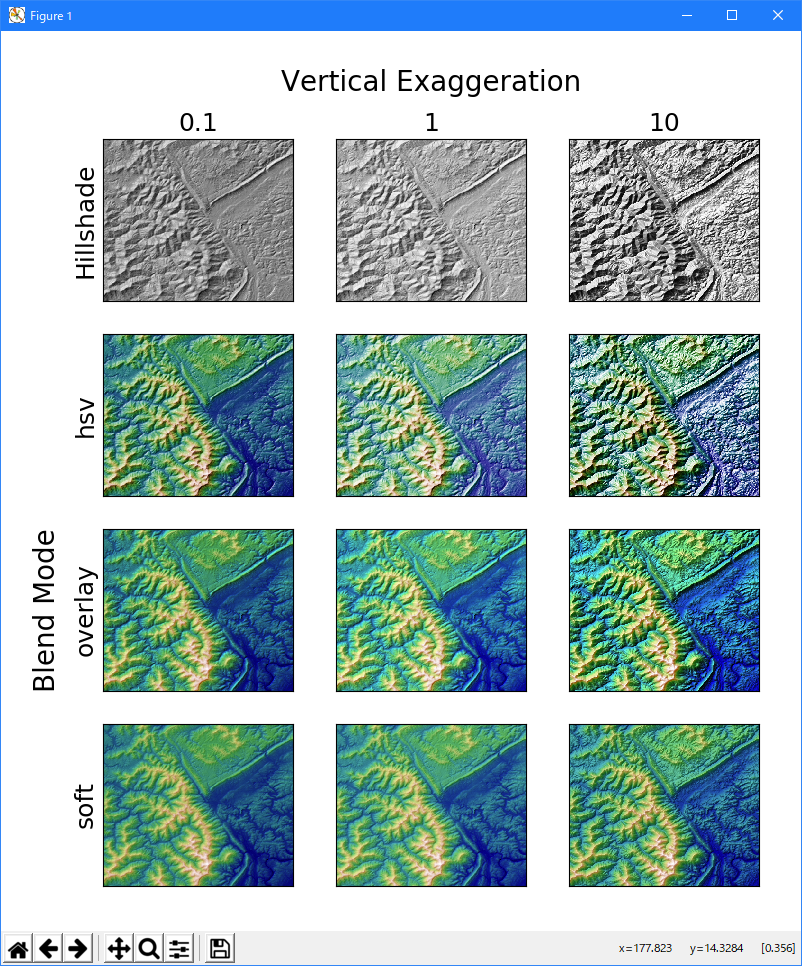
"hillshaded"プロット上のブレンドモードと垂直方向の強調の視覚的効果を示します。
この例のような複雑なサーフェスでは、 "overlay" と "soft" ブレンドモードがうまく機能しますが、デフォルトの "hsv"ブレンドモードは、多くの数学関数などの滑らかなサーフェスに最適です。
ほとんどの場合、ヒルシェーディングは単に視覚的に使用され、*dx* / *dy* は無視しても問題ありません。 その場合、*vert_exag*(縦>方向の誇張)を試行錯誤して調整して、望ましい視覚効果を与えることができます。 ただし、この例では *dx* と *dy* kwargs を使用して *vert_exag* パラメータが真の縦方向の誇張であることを確認しています。
"""
Demonstrates the visual effect of varying blend mode and vertical exaggeration
on "hillshaded" plots.

Note that the "overlay" and "soft" blend modes work well for complex surfaces
such as this example, while the default "hsv" blend mode works best for smooth
surfaces such as many mathematical functions.

In most cases, hillshading is used purely for visual purposes, and *dx*/*dy*
can be safely ignored. In that case, you can tweak *vert_exag* (vertical
exaggeration) by trial and error to give the desired visual effect. However,
this example demonstrates how to use the *dx* and *dy* kwargs to ensure that
the *vert_exag* parameter is the true vertical exaggeration.
"""
import numpy as np
import matplotlib.pyplot as plt
from matplotlib.cbook import get_sample_data
from matplotlib.colors import LightSource

dem = np.load(get_sample_data('jacksboro_fault_dem.npz'))
z = dem['elevation']

#-- Optional dx and dy for accurate vertical exaggeration --------------------
# If you need topographically accurate vertical exaggeration, or you don't want
# to guess at what *vert_exag* should be, you'll need to specify the cellsize
# of the grid (i.e. the *dx* and *dy* parameters).  Otherwise, any *vert_exag*
# value you specify will be relative to the grid spacing of your input data
# (in other words, *dx* and *dy* default to 1.0, and *vert_exag* is calculated
# relative to those parameters).  Similarly, *dx* and *dy* are assumed to be in
# the same units as your input z-values.  Therefore, we'll need to convert the
# given dx and dy from decimal degrees to meters.
dx, dy = dem['dx'], dem['dy']
dy = 111200 * dy
dx = 111200 * dx * np.cos(np.radians(dem['ymin']))
#-----------------------------------------------------------------------------

# Shade from the northwest, with the sun 45 degrees from horizontal
ls = LightSource(azdeg=315, altdeg=45)
cmap = plt.cm.gist_earth

fig, axes = plt.subplots(nrows=4, ncols=3, figsize=(8, 9))
plt.setp(axes.flat, xticks=[], yticks=[])

# Vary vertical exaggeration and blend mode and plot all combinations
for col, ve in zip(axes.T, [0.1, 1, 10]):
    # Show the hillshade intensity image in the first row
    col[0].imshow(ls.hillshade(z, vert_exag=ve, dx=dx, dy=dy), cmap='gray')

    # Place hillshaded plots with different blend modes in the rest of the rows
    for ax, mode in zip(col[1:], ['hsv', 'overlay', 'soft']):
        rgb = ls.shade(z, cmap=cmap, blend_mode=mode,
                       vert_exag=ve, dx=dx, dy=dy)
        ax.imshow(rgb)

# Label rows and columns
for ax, ve in zip(axes[0], [0.1, 1, 10]):
    ax.set_title('{0}'.format(ve), size=18)
for ax, mode in zip(axes[:, 0], ['Hillshade', 'hsv', 'overlay', 'soft']):
    ax.set_ylabel(mode, size=18)

# Group labels...
axes[0, 1].annotate('Vertical Exaggeration', (0.5, 1), xytext=(0, 30),
                    textcoords='offset points', xycoords='axes fraction',
                    ha='center', va='bottom', size=20)
axes[2, 0].annotate('Blend Mode', (0, 0.5), xytext=(-30, 0),
                    textcoords='offset points', xycoords='axes fraction',
                    ha='right', va='center', size=20, rotation=90)
fig.subplots_adjust(bottom=0.05, right=0.95)

plt.show()
- 実行結果( topographic_hillshading.png )
Python 3.11.6 (matplotlib 3.7.1) では、下記のような警告があるが、実行できる。
M:\______\topographic_hillshading.py:20: MatplotlibDeprecationWarning:
  In a future release, get_sample_data will automatically load numpy arrays.
  Set np_load to True to get the array and suppress this warning.
  Set asfileobj to False to get the path to the data file and suppress this warning.
  dem = np.load(get_sample_data('jacksboro_fault_dem.npz'))
Python 3.12.0 (matplotlib 3.8.1) では、下記のようなエラーがあり、実行できない。
Traceback (most recent call last): File "E:\______\topographic_hillshading.py", line 20, in
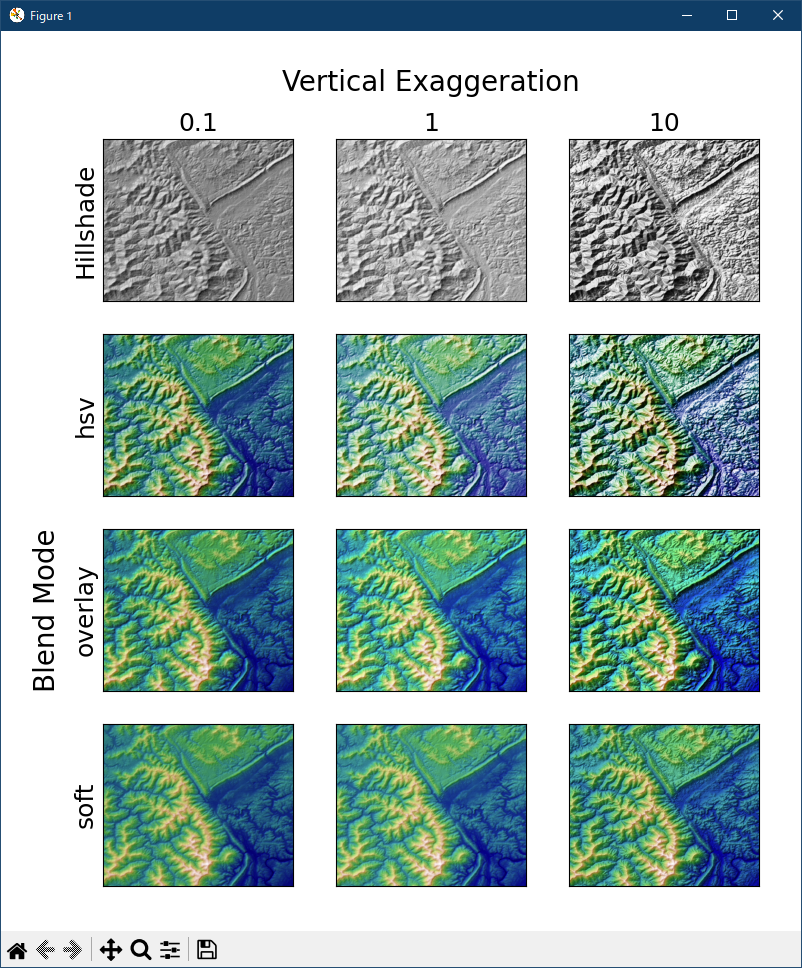
Python 3.11.6 (matplotlib 3.7.1) 及び Python 3.12.0 (matplotlib 3.8.1) で、見直し中、新しいサンプル(specialty-plots-topographic-hillshading-py) を見つけ、下記のコードで、正常に実行できました。dem = np.load(get_sample_data('jacksboro_fault_dem.npz')) ^^^^^^^^^^^^^^^^^^^^^^^^^^^^^^^^^^^^^^^^^^^^^^^^^^^ File "C:\Users\______\AppData\Roaming\Python\Python312\site-packages\numpy\lib\npyio.py", line 427, in load fid = stack.enter_context(open(os_fspath(file), "rb")) ^^^^^^^^^^^^^^^ TypeError: expected str, bytes or os.PathLike object, not NpzFile
"""
=======================
Topographic hillshading
=======================

Demonstrates the visual effect of varying blend mode and vertical exaggeration
on "hillshaded" plots.

Note that the "overlay" and "soft" blend modes work well for complex surfaces
such as this example, while the default "hsv" blend mode works best for smooth
surfaces such as many mathematical functions.

In most cases, hillshading is used purely for visual purposes, and *dx*/*dy*
can be safely ignored. In that case, you can tweak *vert_exag* (vertical
exaggeration) by trial and error to give the desired visual effect. However,
this example demonstrates how to use the *dx* and *dy* keyword arguments to
ensure that the *vert_exag* parameter is the true vertical exaggeration.
"""
import matplotlib.pyplot as plt
import numpy as np

from matplotlib.cbook import get_sample_data
from matplotlib.colors import LightSource

dem = get_sample_data('jacksboro_fault_dem.npz')
z = dem['elevation']
# -- Optional dx and dy for accurate vertical exaggeration --------------------
# If you need topographically accurate vertical exaggeration, or you don't want
# to guess at what *vert_exag* should be, you'll need to specify the cellsize
# of the grid (i.e. the *dx* and *dy* parameters).  Otherwise, any *vert_exag*
# value you specify will be relative to the grid spacing of your input data
# (in other words, *dx* and *dy* default to 1.0, and *vert_exag* is calculated
# relative to those parameters).  Similarly, *dx* and *dy* are assumed to be in
# the same units as your input z-values.  Therefore, we'll need to convert the
# given dx and dy from decimal degrees to meters.
dx, dy = dem['dx'], dem['dy']
dy = 111200 * dy
dx = 111200 * dx * np.cos(np.radians(dem['ymin']))
# -----------------------------------------------------------------------------

# Shade from the northwest, with the sun 45 degrees from horizontal
ls = LightSource(azdeg=315, altdeg=45)
cmap = plt.cm.gist_earth

fig, axs = plt.subplots(nrows=4, ncols=3, figsize=(8, 9))
plt.setp(axs.flat, xticks=[], yticks=[])

# Vary vertical exaggeration and blend mode and plot all combinations
for col, ve in zip(axs.T, [0.1, 1, 10]):
    # Show the hillshade intensity image in the first row
    col[0].imshow(ls.hillshade(z, vert_exag=ve, dx=dx, dy=dy), cmap='gray')

    # Place hillshaded plots with different blend modes in the rest of the rows
    for ax, mode in zip(col[1:], ['hsv', 'overlay', 'soft']):
        rgb = ls.shade(z, cmap=cmap, blend_mode=mode,
                       vert_exag=ve, dx=dx, dy=dy)
        ax.imshow(rgb)

# Label rows and columns
for ax, ve in zip(axs[0], [0.1, 1, 10]):
    ax.set_title(f'{ve}', size=18)
for ax, mode in zip(axs[:, 0], ['Hillshade', 'hsv', 'overlay', 'soft']):
    ax.set_ylabel(mode, size=18)

# Group labels...
axs[0, 1].annotate('Vertical Exaggeration', (0.5, 1), xytext=(0, 30),
                   textcoords='offset points', xycoords='axes fraction',
                   ha='center', va='bottom', size=20)
axs[2, 0].annotate('Blend Mode', (0, 0.5), xytext=(-30, 0),
                   textcoords='offset points', xycoords='axes fraction',
                   ha='right', va='center', size=20, rotation=90)
fig.subplots_adjust(bottom=0.05, right=0.95)

plt.show()
Python 3.11.6 (matplotlib 3.7.1) では、下記のようなエラーがあり、実行できない。
M:\______\topographic_hillshading_2.py:25: MatplotlibDeprecationWarning: In a future release, get_sample_data will automatically load numpy arrays. Set np_load to True to get the array and suppress this warning. Set asfileobj to False to get the path to the data file and suppress this warning. dem = get_sample_data('jacksboro_fault_dem.npz') Traceback (most recent call last): File "M:\______\topographic_hillshading_2.py", line 26, inPython 3.12.0 (matplotlib 3.8.1) では、正常実行です。z = dem['elevation'] ~~~^^^^^^^^^^^^^ TypeError: '_io.BufferedReader' object is not subscriptable
- 参照ページ
showcase_Examples code: topographic_hillshading.py
specialty-plots-topographic-hillshading-py
- リリースノート
- 2023/12/09 Ver=1.04 Python 3.12.0 (matplotlib 3.8.1)で確認
- 2023/12/09 Ver=1.04 Python 3.11.6 (matplotlib 3.7.1)で確認
- 2023/04/05 Ver=1.03 Python 3.11.2 で確認
- 2020/11/02 Ver=1.01 Python 3.7.8 で確認
- 2018/12/06 Ver=1.01 初版リリース
- 関連ページ