|
|
specialty_plots_Examples 51_advanced_hillshading. |
H.Kamifuji . |
- advanced_hillshading.py
陰影のあるプロットを使用して、いくつかの一般的な技を実演します。
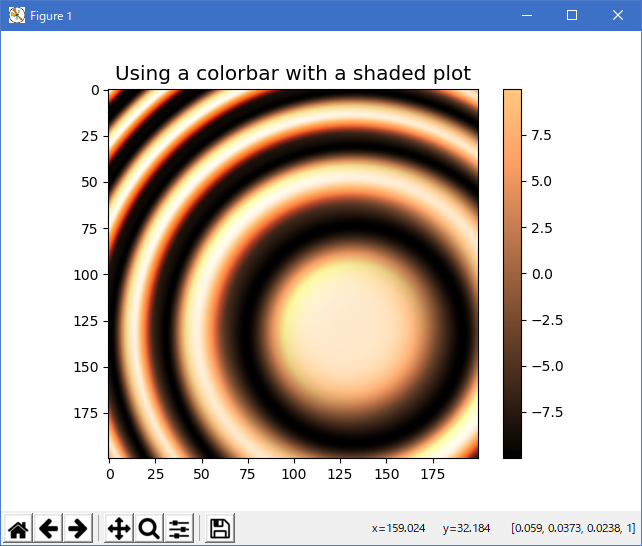
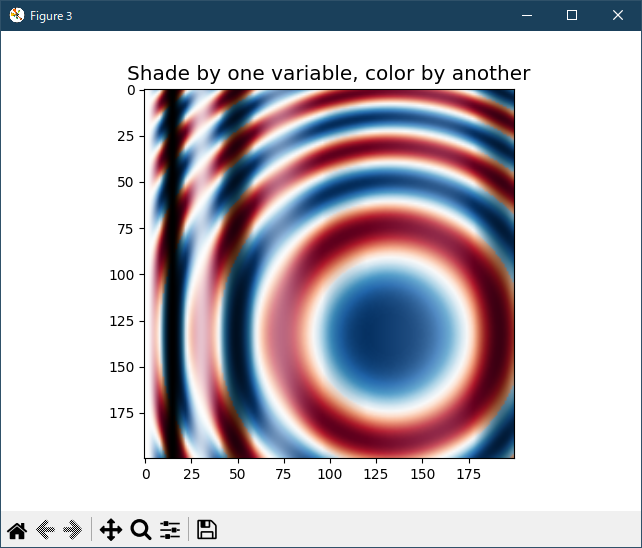
"""
Demonstrates a few common tricks with shaded plots.
"""
import numpy as np
import matplotlib.pyplot as plt
from matplotlib.colors import LightSource, Normalize


def display_colorbar():
    """Display a correct numeric colorbar for a shaded plot."""
    y, x = np.mgrid[-4:2:200j, -4:2:200j]
    z = 10 * np.cos(x**2 + y**2)

    cmap = plt.cm.copper
    ls = LightSource(315, 45)
    rgb = ls.shade(z, cmap)

    fig, ax = plt.subplots()
    ax.imshow(rgb, interpolation='bilinear')

    # Use a proxy artist for the colorbar...
    im = ax.imshow(z, cmap=cmap)
    im.remove()
    fig.colorbar(im)

    ax.set_title('Using a colorbar with a shaded plot', size='x-large')


def avoid_outliers():
    """Use a custom norm to control the displayed z-range of a shaded plot."""
    y, x = np.mgrid[-4:2:200j, -4:2:200j]
    z = 10 * np.cos(x**2 + y**2)

    # Add some outliers...
    z[100, 105] = 2000
    z[120, 110] = -9000

    ls = LightSource(315, 45)
    fig, (ax1, ax2) = plt.subplots(ncols=2, figsize=(8, 4.5))

    rgb = ls.shade(z, plt.cm.copper)
    ax1.imshow(rgb, interpolation='bilinear')
    ax1.set_title('Full range of data')

    rgb = ls.shade(z, plt.cm.copper, vmin=-10, vmax=10)
    ax2.imshow(rgb, interpolation='bilinear')
    ax2.set_title('Manually set range')

    fig.suptitle('Avoiding Outliers in Shaded Plots', size='x-large')


def shade_other_data():
    """Demonstrates displaying different variables through shade and color."""
    y, x = np.mgrid[-4:2:200j, -4:2:200j]
    z1 = np.sin(x**2)  # Data to hillshade
    z2 = np.cos(x**2 + y**2)  # Data to color

    norm = Normalize(z2.min(), z2.max())
    cmap = plt.cm.RdBu

    ls = LightSource(315, 45)
    rgb = ls.shade_rgb(cmap(norm(z2)), z1)

    fig, ax = plt.subplots()
    ax.imshow(rgb, interpolation='bilinear')
    ax.set_title('Shade by one variable, color by another', size='x-large')

display_colorbar()
avoid_outliers()
shade_other_data()
plt.show()
- 実行結果( advanced_hillshading.png )


Python 3.11.6 (matplotlib 3.7.1) では、下記のような警告があるが、実行できる。
M:\______\advanced_hillshading.py:24: MatplotlibDeprecationWarning:
  Unable to determine Axes to steal space for Colorbar.
  Using gca(), but will raise in the future.
  Either provide the *cax* argument to use as the Axes for the Colorbar,
  provide the *ax* argument to steal space from it, or add *mappable*
  to an Axes.
  fig.colorbar(im)
Python 3.12.0 (matplotlib 3.8.1) では、下記のようなera-があり、実行できない。
Traceback (most recent call last): File "E:\______\advanced_hillshading.py", line 68, in
Python 3.11.6 (matplotlib 3.7.1) 及び Python 3.12.0 (matplotlib 3.8.1) で、見直し中、新しいサンプル( specialty-plots-advanced-hillshading-py ) を見つけ、下記のコードで、正常に実行できました。display_colorbar() File "E:\______\advanced_hillshading.py", line 24, in display_colorbar fig.colorbar(im) File "C:\Program Files\Python312\Lib\site-packages\matplotlib\figure.py", line 1285, in colorbar raise ValueError( ValueError: Unable to determine Axes to steal space for Colorbar. Either provide the *cax* argument to use as the Axes for the Colorbar, provide the *ax* argument to steal space from it, or add *mappable* to an Axes.
"""
===========
Hillshading
===========

Demonstrates a few common tricks with shaded plots.
"""
import matplotlib.pyplot as plt
import numpy as np

from matplotlib.colors import LightSource, Normalize


def display_colorbar():
    """Display a correct numeric colorbar for a shaded plot."""
    y, x = np.mgrid[-4:2:200j, -4:2:200j]
    z = 10 * np.cos(x**2 + y**2)

    cmap = plt.cm.copper
    ls = LightSource(315, 45)
    rgb = ls.shade(z, cmap)

    fig, ax = plt.subplots()
    ax.imshow(rgb, interpolation='bilinear')

    # Use a proxy artist for the colorbar...
    im = ax.imshow(z, cmap=cmap)
    im.remove()
    fig.colorbar(im, ax=ax)

    ax.set_title('Using a colorbar with a shaded plot', size='x-large')


def avoid_outliers():
    """Use a custom norm to control the displayed z-range of a shaded plot."""
    y, x = np.mgrid[-4:2:200j, -4:2:200j]
    z = 10 * np.cos(x**2 + y**2)

    # Add some outliers...
    z[100, 105] = 2000
    z[120, 110] = -9000

    ls = LightSource(315, 45)
    fig, (ax1, ax2) = plt.subplots(ncols=2, figsize=(8, 4.5))

    rgb = ls.shade(z, plt.cm.copper)
    ax1.imshow(rgb, interpolation='bilinear')
    ax1.set_title('Full range of data')

    rgb = ls.shade(z, plt.cm.copper, vmin=-10, vmax=10)
    ax2.imshow(rgb, interpolation='bilinear')
    ax2.set_title('Manually set range')

    fig.suptitle('Avoiding Outliers in Shaded Plots', size='x-large')


def shade_other_data():
    """Demonstrates displaying different variables through shade and color."""
    y, x = np.mgrid[-4:2:200j, -4:2:200j]
    z1 = np.sin(x**2)  # Data to hillshade
    z2 = np.cos(x**2 + y**2)  # Data to color

    norm = Normalize(z2.min(), z2.max())
    cmap = plt.cm.RdBu

    ls = LightSource(315, 45)
    rgb = ls.shade_rgb(cmap(norm(z2)), z1)

    fig, ax = plt.subplots()
    ax.imshow(rgb, interpolation='bilinear')
    ax.set_title('Shade by one variable, color by another', size='x-large')

display_colorbar()
avoid_outliers()
shade_other_data()
plt.show()
Python 3.11.6 (matplotlib 3.7.1) 及び Python 3.12.0 (matplotlib 3.8.1) 共に、正常実行です。


- 参照ページ
specialty_plots_Examples code: advanced_hillshading.py
specialty-plots-advanced-hillshading-py
- リリースノート
- 2023/12/09 Ver=1.04 Python 3.12.0 (matplotlib 3.8.1)で確認
- 2023/12/09 Ver=1.04 Python 3.11.6 (matplotlib 3.7.1)で確認
- 2023/04/05 Ver=1.03 Python 3.11.2 で確認
- 2020/11/02 Ver=1.01 Python 3.7.8 で確認
- 2018/12/06 Ver=1.01 初版リリース
- 関連ページ