|
|
matplotlib showcase_Examples 49_mandelbrot. |
H.Kamifuji . |
- mandelbrot.py
陰影付き&パワー正規化レンダリング
マンデルブロセットレンダリングは、パワー正規化カラーマップ( gamma=0.3 )に関連付けられた正規化された再カウントを使用することによって改善することができます。 シェーディングのおかげで、レンダリングをさらに強化できます。
`maxiter` は計算の精度を与えます。 `maxiter=200` はほとんどの最新のラップトップで数秒かかるでしょう。
この事例は、Windows10_1909 で Python 3.9.0 環境では、動作しません。( X = np.linspace(xmin, xmax, xn, dtype=np.float32) がデグレートしたのか? )
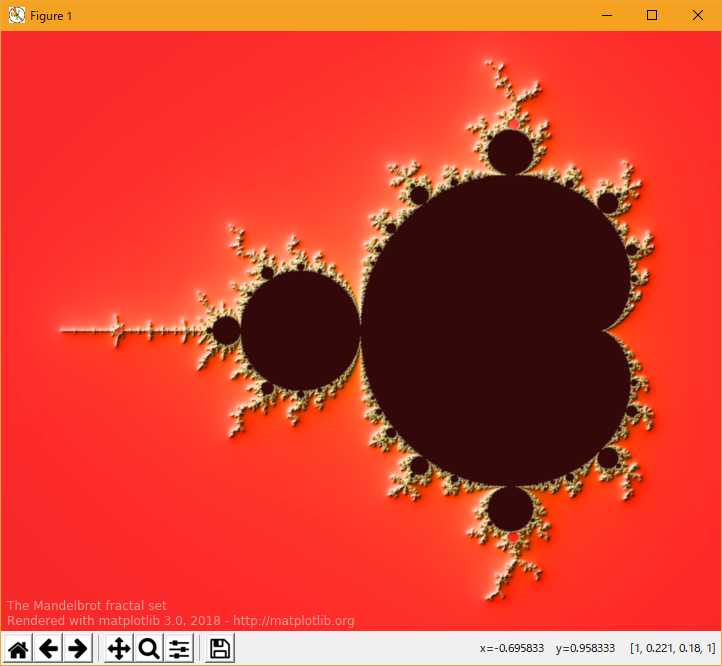
"""
===================================
Shaded & power normalized rendering
===================================

The Mandelbrot set rendering can be improved by using a normalized recount
associated with a power normalized colormap (gamma=0.3). Rendering can be
further enhanced thanks to shading.

The `maxiter` gives the precision of the computation. `maxiter=200` should
take a few seconds on most modern laptops.
"""
import numpy as np


def mandelbrot_set(xmin, xmax, ymin, ymax, xn, yn, maxiter, horizon=2.0):
    X = np.linspace(xmin, xmax, xn, dtype=np.float32)
    Y = np.linspace(ymin, ymax, yn, dtype=np.float32)
    C = X + Y[:, None]*1j
    N = np.zeros(C.shape, dtype=int)
    Z = np.zeros(C.shape, np.complex64)
    for n in range(maxiter):
        I = np.less(abs(Z), horizon)
        N[I] = n
        Z[I] = Z[I]**2 + C[I]
    N[N == maxiter-1] = 0
    return Z, N


if __name__ == '__main__':
    import time
    import matplotlib
    from matplotlib import colors
    import matplotlib.pyplot as plt

    xmin, xmax, xn = -2.25, +0.75, 3000/2
    ymin, ymax, yn = -1.25, +1.25, 2500/2
    maxiter = 200
    horizon = 2.0 ** 40
    log_horizon = np.log(np.log(horizon))/np.log(2)
    Z, N = mandelbrot_set(xmin, xmax, ymin, ymax, xn, yn, maxiter, horizon)

    # Normalized recount as explained in:
    # https://linas.org/art-gallery/escape/smooth.html
    # https://www.ibm.com/developerworks/community/blogs/jfp/entry/My_Christmas_Gift

    # This line will generate warnings for null values but it is faster to
    # process them afterwards using the nan_to_num
    with np.errstate(invalid='ignore'):
        M = np.nan_to_num(N + 1 -
                          np.log(np.log(abs(Z)))/np.log(2) +
                          log_horizon)

    dpi = 72
    width = 10
    height = 10*yn/xn
    fig = plt.figure(figsize=(width, height), dpi=dpi)
    ax = fig.add_axes([0.0, 0.0, 1.0, 1.0], frameon=False, aspect=1)

    # Shaded rendering
    light = colors.LightSource(azdeg=315, altdeg=10)
    M = light.shade(M, cmap=plt.cm.hot, vert_exag=1.5,
                    norm=colors.PowerNorm(0.3), blend_mode='hsv')
    plt.imshow(M, extent=[xmin, xmax, ymin, ymax], interpolation="bicubic")
    ax.set_xticks([])
    ax.set_yticks([])

    # Some advertisement for matplotlib
    year = time.strftime("%Y")
    major, minor, micro = matplotlib.__version__.split('.', 2)
    text = ("The Mandelbrot fractal set\n"
            "Rendered with matplotlib %s.%s, %s - http://matplotlib.org"
            % (major, minor, year))
    ax.text(xmin+.025, ymin+.025, text, color="white", fontsize=12, alpha=0.5)

    plt.show()
- 実行結果( mandelbrot.png )
Python 3.11.2 見直しました。上記のコードでは、下記のエラーが発生します。
Traceback (most recent call last):
File "_:\mandelbrot.py", line 41, in <module>
Z, N = mandelbrot_set(xmin, xmax, ymin, ymax, xn, yn, maxiter, horizon)
^^^^^^^^^^^^^^^^^^^^^^^^^^^^^^^^^^^^^^^^^^^^^^^^^^^^^^^^^^^^^^^^
File "M:\usr\rehome10\Python\Py-Support\68_showcase_Examples\49_mandelbrot\mandelbrot.py", line 17, in mandelbrot_set
X = np.linspace(xmin, xmax, xn, dtype=np.float32)
^^^^^^^^^^^^^^^^^^^^^^^^^^^^^^^^^^^^^^^^^^^^^
File "<__array_function__ internals>", line 200, in linspace
File "C:\Users\_____\AppData\Local\Programs\Python\Python311\Lib\site-packages\numpy\core\function_base.py", line 121, in linspace
num = operator.index(num)
^^^^^^^^^^^^^^^^^^^
TypeError: 'float' object cannot be interpreted as an integer
matplotlib 内部のエラーのようです。matplotlib の改修(先祖帰りバグの改修)を待つしかない。
Python 3.11.6 (matplotlib 3.7.1) では、下記のようなエラーがあり、実行できない。
Traceback (most recent call last): File "M:\______\mandelbrot.py", line 41, in
Python 3.12.0 (matplotlib 3.8.1) では、下記のようなエラーがあり、実行できない。Z, N = mandelbrot_set(xmin, xmax, ymin, ymax, xn, yn, maxiter, horizon) ^^^^^^^^^^^^^^^^^^^^^^^^^^^^^^^^^^^^^^^^^^^^^^^^^^^^^^^^^^^^^^^^ File "M:\______\mandelbrot.py", line 17, in mandelbrot_set X = np.linspace(xmin, xmax, xn, dtype=np.float32) ^^^^^^^^^^^^^^^^^^^^^^^^^^^^^^^^^^^^^^^^^^^^^ File "<__array_function__ internals>", line 200, in linspace File "C:\Users\______\AppData\Local\Programs\Python\Python311\Lib \site-packages\numpy\core\function_base.py", line 121, in linspace num = operator.index(num) ^^^^^^^^^^^^^^^^^^^ TypeError: 'float' object cannot be interpreted as an integer
Traceback (most recent call last): File "E:\______\mandelbrot.py", line 41, in
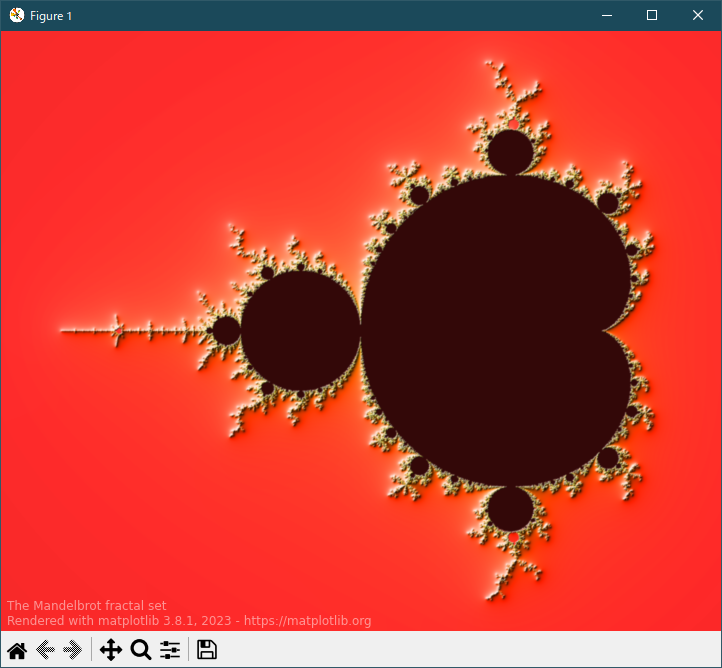
Python 3.11.6 (matplotlib 3.7.1) 及び Python 3.12.0 (matplotlib 3.8.1) で、見直し中、新しいサンプル(showcase-mandelbrot-py) を見つけ、下記のコードで、正常に実行できました。Z, N = mandelbrot_set(xmin, xmax, ymin, ymax, xn, yn, maxiter, horizon) ^^^^^^^^^^^^^^^^^^^^^^^^^^^^^^^^^^^^^^^^^^^^^^^^^^^^^^^^^^^^^^^^ File "E:\E_Home\usr\Python\Py-Support\68_showcase_Examples\49_mandelbrot\mandelbrot.py", line 17, in mandelbrot_set X = np.linspace(xmin, xmax, xn, dtype=np.float32) ^^^^^^^^^^^^^^^^^^^^^^^^^^^^^^^^^^^^^^^^^^^^^ File "C:\Users\kamif\AppData\Roaming\Python\Python312\site-packages\numpy\core\function_base.py", line 122, in linspace num = operator.index(num) ^^^^^^^^^^^^^^^^^^^ TypeError: 'float' object cannot be interpreted as an integer
"""
===================================
Shaded & power normalized rendering
===================================

The Mandelbrot set rendering can be improved by using a normalized recount
associated with a power normalized colormap (gamma=0.3). Rendering can be
further enhanced thanks to shading.

The ``maxiter`` gives the precision of the computation. ``maxiter=200`` should
take a few seconds on most modern laptops.
"""
import numpy as np


def mandelbrot_set(xmin, xmax, ymin, ymax, xn, yn, maxiter, horizon=2.0):
    X = np.linspace(xmin, xmax, xn).astype(np.float32)
    Y = np.linspace(ymin, ymax, yn).astype(np.float32)
    C = X + Y[:, None] * 1j
    N = np.zeros_like(C, dtype=int)
    Z = np.zeros_like(C)
    for n in range(maxiter):
        I = abs(Z) < horizon
        N[I] = n
        Z[I] = Z[I]**2 + C[I]
    N[N == maxiter-1] = 0
    return Z, N


if __name__ == '__main__':
    import time

    import matplotlib.pyplot as plt

    import matplotlib
    from matplotlib import colors

    xmin, xmax, xn = -2.25, +0.75, 3000 // 2
    ymin, ymax, yn = -1.25, +1.25, 2500 // 2
    maxiter = 200
    horizon = 2.0 ** 40
    log_horizon = np.log2(np.log(horizon))
    Z, N = mandelbrot_set(xmin, xmax, ymin, ymax, xn, yn, maxiter, horizon)

    # Normalized recount as explained in:
    # https://linas.org/art-gallery/escape/smooth.html
    # https://web.archive.org/web/20160331171238/https://www.ibm.com/developerworks/community/blogs/jfp/entry/My_Christmas_Gift?lang=en

    # This line will generate warnings for null values, but it is faster to
    # process them afterwards using the nan_to_num
    with np.errstate(invalid='ignore'):
        M = np.nan_to_num(N + 1 - np.log2(np.log(abs(Z))) + log_horizon)

    dpi = 72
    width = 10
    height = 10*yn/xn
    fig = plt.figure(figsize=(width, height), dpi=dpi)
    ax = fig.add_axes([0, 0, 1, 1], frameon=False, aspect=1)

    # Shaded rendering
    light = colors.LightSource(azdeg=315, altdeg=10)
    M = light.shade(M, cmap=plt.cm.hot, vert_exag=1.5,
                    norm=colors.PowerNorm(0.3), blend_mode='hsv')
    ax.imshow(M, extent=[xmin, xmax, ymin, ymax], interpolation="bicubic")
    ax.set_xticks([])
    ax.set_yticks([])

    # Some advertisement for matplotlib
    year = time.strftime("%Y")
    text = ("The Mandelbrot fractal set\n"
            "Rendered with matplotlib %s, %s - https://matplotlib.org"
            % (matplotlib.__version__, year))
    ax.text(xmin+.025, ymin+.025, text, color="white", fontsize=12, alpha=0.5)

    plt.show()
Python 3.11.6 (matplotlib 3.7.1) 及び Python 3.12.0 (matplotlib 3.8.1) 共に、正常実行です。
- 参照ページ
showcase_Examples code: mandelbrot.py
showcase-mandelbrot-py
- リリースノート
- 2023/12/09 Ver=1.04 Python 3.12.0 (matplotlib 3.8.1)で確認
- 2023/12/09 Ver=1.04 Python 3.11.6 (matplotlib 3.7.1)で確認
- 2023/04/05 Ver=1.03 Python 3.11.2 で確認
- 2020/11/02 Ver=1.01 Python 3.7.8 で確認
- 2018/12/06 Ver=1.01 初版リリース
- 関連ページ