|
|
matplotlib scales_Examples 41_scales. |
H.Kamifuji . |
- scales.py
軸に適用されたスケール変換を示します。 ログ、symlog、ロジット。
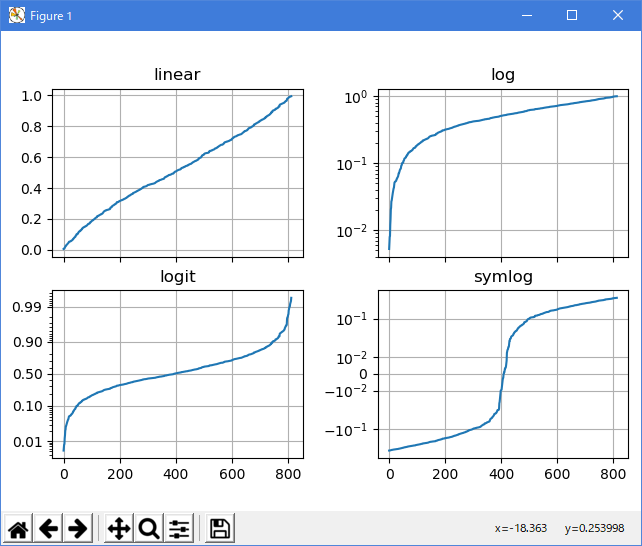
"""
Illustrate the scale transformations applied to axes, e.g. log, symlog, logit.
"""
import numpy as np
import matplotlib.pyplot as plt
from matplotlib.ticker import NullFormatter

np.random.seed(1)
# make up some data in the interval ]0, 1[
y = np.random.normal(loc=0.5, scale=0.4, size=1000)
y = y[(y > 0) & (y < 1)]
y.sort()
x = np.arange(len(y))

# plot with various axes scales
fig, axs = plt.subplots(2, 2, sharex=True)
fig.subplots_adjust(left=0.08, right=0.98, wspace=0.3)

# linear
ax = axs[0, 0]
ax.plot(x, y)
ax.set_yscale('linear')
ax.set_title('linear')
ax.grid(True)


# log
ax = axs[0, 1]
ax.plot(x, y)
ax.set_yscale('log')
ax.set_title('log')
ax.grid(True)


# symmetric log
ax = axs[1, 1]
ax.plot(x, y - y.mean())
ax.set_yscale('symlog', linthreshy=0.02)
ax.set_title('symlog')
ax.grid(True)

# logit
ax = axs[1, 0]
ax.plot(x, y)
ax.set_yscale('logit')
ax.set_title('logit')
ax.grid(True)
ax.yaxis.set_minor_formatter(NullFormatter())


plt.show()
- 実行結果( scales.png )
Python 3.11.2 見直しました。上記のコードでは、下記のエラーが発生します。
Traceback (most recent call last):
File "_:\scales.py", line 38, in <module>
ax.set_yscale('symlog', linthreshy=0.02)
File "C:\Users\_____\AppData\Local\Programs\Python\Python311\Lib\site-packages\matplotlib\axes\_base.py", line 74, in wrapper
return get_method(self)(*args, **kwargs)
^^^^^^^^^^^^^^^^^^^^^^^^^^^^^^^^^
File "C:\Users\_____\AppData\Local\Programs\Python\Python311\Lib\site-packages\matplotlib\axis.py", line 810, in _set_axes_scale
ax._axis_map[name]._set_scale(value, **kwargs)
File "C:\Users\_____\AppData\Local\Programs\Python\Python311\Lib\site-packages\matplotlib\axis.py", line 767, in _set_scale
self._scale = mscale.scale_factory(value, self, **kwargs)
^^^^^^^^^^^^^^^^^^^^^^^^^^^^^^^^^^^^^^^^^^^
File "C:\Users\_____\AppData\Local\Programs\Python\Python311\Lib\site-packages\matplotlib\scale.py", line 714, in scale_factory
return scale_cls(axis, **kwargs)
^^^^^^^^^^^^^^^^^^^^^^^^^
TypeError: SymmetricalLogScale.__init__() got an unexpected keyword argument 'linthreshy'
matplotlib 内部のエラーのようです。matplotlib の改修(先祖帰りバグの改修)を待つしかない。
Python 3.11.6 (matplotlib 3.7.1) では、下記のようなエラーがあり、実行できない。
Traceback (most recent call last): File "M:\______\scales.py", line 38, in
Python 3.12.0 (matplotlib 3.8.1) では、下記のようなエラーがあり、実行できない。ax.set_yscale('symlog', linthreshy=0.02) File "C:\Users\______\AppData\Local\Programs\Python\Python311\Lib \site-packages\matplotlib\axes\_base.py", line 74, in wrapper return get_method(self)(*args, **kwargs) ^^^^^^^^^^^^^^^^^^^^^^^^^^^^^^^^^ File "C:\Users\______\AppData\Local\Programs\Python\Python311\Lib \site-packages\matplotlib\axis.py", line 810, in _set_axes_scale ax._axis_map[name]._set_scale(value, **kwargs) File "C:\Users\______\AppData\Local\Programs\Python\Python311\Lib \site-packages\matplotlib\axis.py", line 767, in _set_scale self._scale = mscale.scale_factory(value, self, **kwargs) ^^^^^^^^^^^^^^^^^^^^^^^^^^^^^^^^^^^^^^^^^^^ File "C:\Users\______\AppData\Local\Programs\Python\Python311\Lib \site-packages\matplotlib\scale.py", line 714, in scale_factory return scale_cls(axis, **kwargs) ^^^^^^^^^^^^^^^^^^^^^^^^^ TypeError: SymmetricalLogScale.__init__() got an unexpected keyword argument 'linthreshy'
Traceback (most recent call last): File "E:\______\scales.py", line 38, in
Python 3.11.6 (matplotlib 3.7.1) 及び Python 3.12.0 (matplotlib 3.8.1) で、見直し中、新しいサンプル( scales-scales-py ) を見つけ、下記のコードで、正常に実行できました。ax.set_yscale('symlog', linthreshy=0.02) File "C:\Program Files\Python312\Lib\site-packages\matplotlib\axes\_base.py", line 73, in wrapper return get_method(self)(*args, **kwargs) ^^^^^^^^^^^^^^^^^^^^^^^^^^^^^^^^^ File "C:\Program Files\Python312\Lib\site-packages\matplotlib\axis.py", line 837, in _set_axes_scale ax._axis_map[name]._set_scale(value, **kwargs) File "C:\Program Files\Python312\Lib\site-packages\matplotlib\axis.py", line 796, in _set_scale self._scale = mscale.scale_factory(value, self, **kwargs) ^^^^^^^^^^^^^^^^^^^^^^^^^^^^^^^^^^^^^^^^^^^ File "C:\Program Files\Python312\Lib\site-packages\matplotlib\scale.py", line 717, in scale_factory return scale_cls(axis, **kwargs) ^^^^^^^^^^^^^^^^^^^^^^^^^ TypeError: SymmetricalLogScale.__init__() got an unexpected keyword argument 'linthreshy'
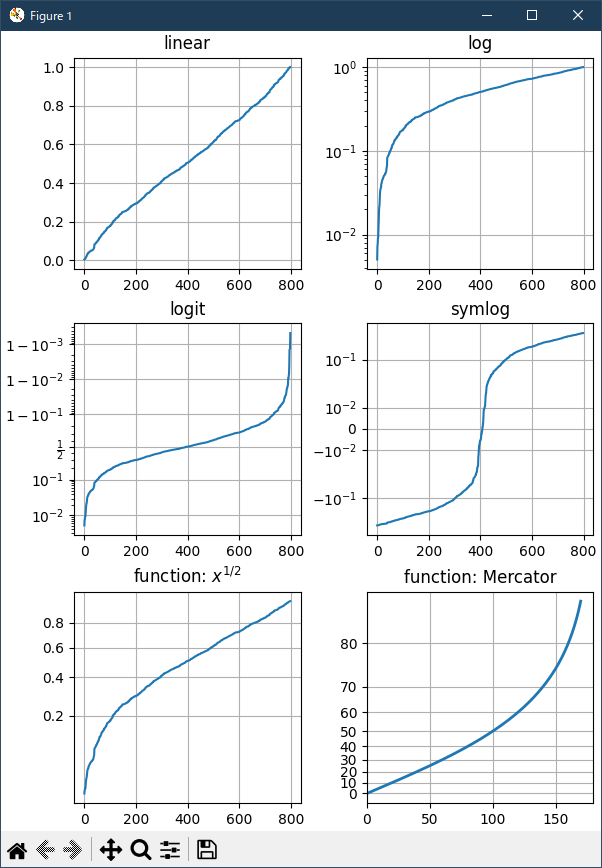
"""
======
Scales
======

Illustrate the scale transformations applied to axes, e.g. log, symlog, logit.

The last two examples are examples of using the ``'function'`` scale by
supplying forward and inverse functions for the scale transformation.
"""

import matplotlib.pyplot as plt
import numpy as np

from matplotlib.ticker import FixedLocator, NullFormatter

# Fixing random state for reproducibility
np.random.seed(19680801)

# make up some data in the interval ]0, 1[
y = np.random.normal(loc=0.5, scale=0.4, size=1000)
y = y[(y > 0) & (y < 1)]
y.sort()
x = np.arange(len(y))

# plot with various axes scales
fig, axs = plt.subplots(3, 2, figsize=(6, 8), layout='constrained')

# linear
ax = axs[0, 0]
ax.plot(x, y)
ax.set_yscale('linear')
ax.set_title('linear')
ax.grid(True)


# log
ax = axs[0, 1]
ax.plot(x, y)
ax.set_yscale('log')
ax.set_title('log')
ax.grid(True)


# symmetric log
ax = axs[1, 1]
ax.plot(x, y - y.mean())
ax.set_yscale('symlog', linthresh=0.02)
ax.set_title('symlog')
ax.grid(True)

# logit
ax = axs[1, 0]
ax.plot(x, y)
ax.set_yscale('logit')
ax.set_title('logit')
ax.grid(True)


# Function x**(1/2)
def forward(x):
    return x**(1/2)


def inverse(x):
    return x**2


ax = axs[2, 0]
ax.plot(x, y)
ax.set_yscale('function', functions=(forward, inverse))
ax.set_title('function: $x^{1/2}$')
ax.grid(True)
ax.yaxis.set_major_locator(FixedLocator(np.arange(0, 1, 0.2)**2))
ax.yaxis.set_major_locator(FixedLocator(np.arange(0, 1, 0.2)))


# Function Mercator transform
def forward(a):
    a = np.deg2rad(a)
    return np.rad2deg(np.log(np.abs(np.tan(a) + 1.0 / np.cos(a))))


def inverse(a):
    a = np.deg2rad(a)
    return np.rad2deg(np.arctan(np.sinh(a)))

ax = axs[2, 1]

t = np.arange(0, 170.0, 0.1)
s = t / 2.

ax.plot(t, s, '-', lw=2)

ax.set_yscale('function', functions=(forward, inverse))
ax.set_title('function: Mercator')
ax.grid(True)
ax.set_xlim([0, 180])
ax.yaxis.set_minor_formatter(NullFormatter())
ax.yaxis.set_major_locator(FixedLocator(np.arange(0, 90, 10)))

plt.show()

# %%
#
# .. admonition:: References
#
#    The use of the following functions, methods, classes and modules is shown
#    in this example:
#
#    - `matplotlib.axes.Axes.set_xscale`
#    - `matplotlib.axes.Axes.set_yscale`
#    - `matplotlib.axis.Axis.set_major_locator`
#    - `matplotlib.scale.LinearScale`
#    - `matplotlib.scale.LogScale`
#    - `matplotlib.scale.SymmetricalLogScale`
#    - `matplotlib.scale.LogitScale`
#    - `matplotlib.scale.FuncScale`
Python 3.11.6 (matplotlib 3.7.1) 及び Python 3.12.0 (matplotlib 3.8.1) 共に、正常実行です。
- 参照ページ
scales_Examples code: scales.py
scales-scales-py
- リリースノート
- 2023/12/09 Ver=1.04 Python 3.12.0 (matplotlib 3.8.1)で確認
- 2023/12/09 Ver=1.04 Python 3.11.6 (matplotlib 3.7.1)で確認
- 2023/04/05 Ver=1.03 Python 3.11.2 で確認
- 2020/11/02 Ver=1.01 Python 3.7.8 で確認
- 2018/12/06 Ver=1.01 初版リリース
- 関連ページ