|
|
matplotlib pyplots_Examples 38_whats_new_99_axes_grid. |
H.Kamifuji . |
- whats_new_99_axes_grid.py
この事例は、Windows10_1909 で Python 3.9.0 環境では、動作しません。( Z1 = mlab.bivariate_normal(X, Y, 1.0, 1.0, 0.0, 0.0) がデグレートしたのか? )
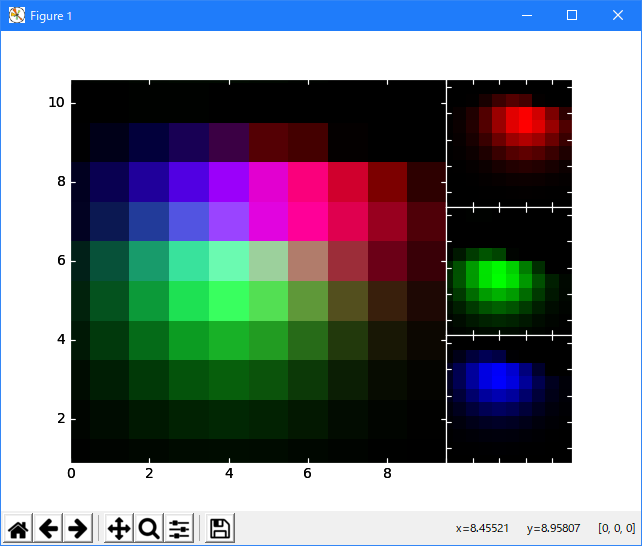
import numpy as np
import matplotlib.pyplot as plt
from mpl_toolkits.axes_grid.axes_rgb import RGBAxes

def get_demo_image():
    # prepare image
    delta = 0.5

    extent = (-3,4,-4,3)
    x = np.arange(-3.0, 4.001, delta)
    y = np.arange(-4.0, 3.001, delta)
    X, Y = np.meshgrid(x, y)
    import matplotlib.mlab as mlab
    Z1 = mlab.bivariate_normal(X, Y, 1.0, 1.0, 0.0, 0.0)
    Z2 = mlab.bivariate_normal(X, Y, 1.5, 0.5, 1, 1)
    Z = (Z1 - Z2) * 10

    return Z, extent


def get_rgb():
    Z, extent = get_demo_image()

    Z[Z<0] = 0.
    Z = Z/Z.max()

    R = Z[:13,:13]
    G = Z[2:,2:]
    B = Z[:13,2:]

    return R, G, B


fig = plt.figure(1)
ax = RGBAxes(fig, [0.1, 0.1, 0.8, 0.8])

r, g, b = get_rgb()
kwargs = dict(origin="lower", interpolation="nearest")
ax.imshow_rgb(r, g, b, **kwargs)

ax.RGB.set_xlim(0., 9.5)
ax.RGB.set_ylim(0.9, 10.6)


plt.draw()
plt.show()
- 実行結果( whats_new_99_axes_grid.png )
Python 3.11.2 見直しました。上記のコードでは、下記のエラーが発生します。
Traceback (most recent call last):
File "_:\whats_new_99_axes_grid.py", line 3, in <module>
from mpl_toolkits.axes_grid.axes_rgb import RGBAxes
ModuleNotFoundError: No module named 'mpl_toolkits.axes_grid'
matplotlib 内部のエラーのようです。matplotlib の改修(先祖帰りバグの改修)を待つしかない。
Python 3.11.6 (matplotlib 3.7.1) では、下記のようなエラーがあり、実行できない。
Traceback (most recent call last): File "M:\______\whats_new_99_axes_grid.py", line 3, in
Python 3.12.0 (matplotlib 3.8.1) では、下記のようなエラーがあり、実行できない。from mpl_toolkits.axes_grid.axes_rgb import RGBAxes ModuleNotFoundError: No module named 'mpl_toolkits.axes_grid'
Traceback (most recent call last): File "E:\______\whats_new_99_axes_grid.py", line 3, in
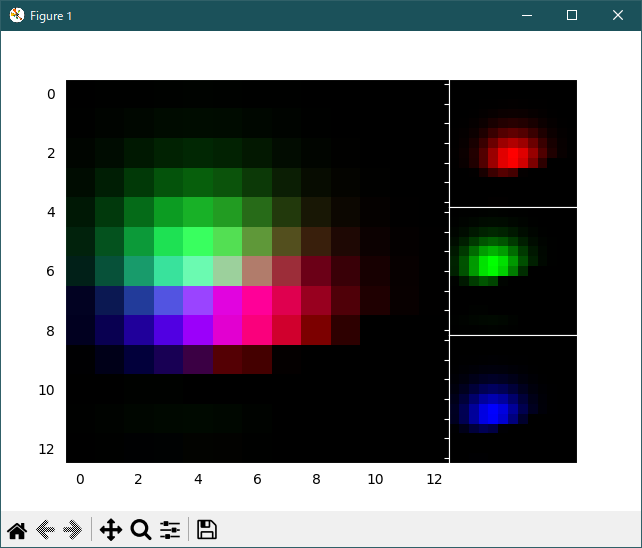
Python 3.11.6 (matplotlib 3.7.1) 及び Python 3.12.0 (matplotlib 3.8.1) で、見直し中、新しいサンプル(axes-grid1-demo-axes-rgb-py) を見つけ、下記のコードで、正常に実行できました。from mpl_toolkits.axes_grid.axes_rgb import RGBAxes ModuleNotFoundError: No module named 'mpl_toolkits.axes_grid'
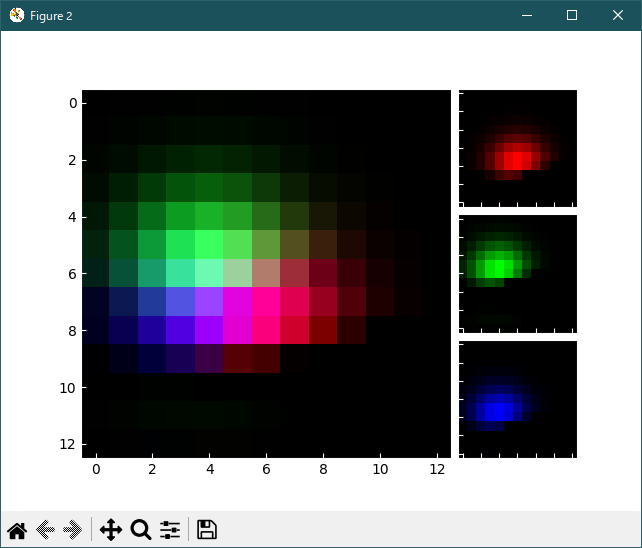
"""
==================================
Showing RGB channels using RGBAxes
==================================

`~.axes_grid1.axes_rgb.RGBAxes` creates a layout of 4 Axes for displaying RGB
channels: one large Axes for the RGB image and 3 smaller Axes for the R, G, B
channels.
"""

import matplotlib.pyplot as plt
import numpy as np

from matplotlib import cbook
from mpl_toolkits.axes_grid1.axes_rgb import RGBAxes, make_rgb_axes


def get_rgb():
    Z = cbook.get_sample_data("axes_grid/bivariate_normal.npy")
    Z[Z < 0] = 0.
    Z = Z / Z.max()

    R = Z[:13, :13]
    G = Z[2:, 2:]
    B = Z[:13, 2:]

    return R, G, B


def make_cube(r, g, b):
    ny, nx = r.shape
    R = np.zeros((ny, nx, 3))
    R[:, :, 0] = r
    G = np.zeros_like(R)
    G[:, :, 1] = g
    B = np.zeros_like(R)
    B[:, :, 2] = b

    RGB = R + G + B

    return R, G, B, RGB


def demo_rgb1():
    fig = plt.figure()
    ax = RGBAxes(fig, [0.1, 0.1, 0.8, 0.8], pad=0.0)
    r, g, b = get_rgb()
    ax.imshow_rgb(r, g, b)


def demo_rgb2():
    fig, ax = plt.subplots()
    ax_r, ax_g, ax_b = make_rgb_axes(ax, pad=0.02)

    r, g, b = get_rgb()
    im_r, im_g, im_b, im_rgb = make_cube(r, g, b)
    ax.imshow(im_rgb)
    ax_r.imshow(im_r)
    ax_g.imshow(im_g)
    ax_b.imshow(im_b)

    for ax in fig.axes:
        ax.tick_params(direction='in', color='w')
        ax.spines[:].set_color("w")


demo_rgb1()
demo_rgb2()

plt.show()
Python 3.11.6 (matplotlib 3.7.1) では、下記のようなエラーがあり、実行できない。
M:\______\demo_axes_rgb_2.py:19: MatplotlibDeprecationWarning: In a future release, get_sample_data will automatically load numpy arrays. Set np_load to True to get the array and suppress this warning. Set asfileobj to False to get the path to the data file and suppress this warning. Z = cbook.get_sample_data("axes_grid/bivariate_normal.npy") Traceback (most recent call last): File "M:\______\demo_axes_rgb_2.py", line 67, inPython 3.12.0 (matplotlib 3.8.1) では、正常実行です。demo_rgb1() File "M:\______\demo_axes_rgb_2.py", line 47, in demo_rgb1 r, g, b = get_rgb() ^^^^^^^^^ File "M:\______\demo_axes_rgb_2.py", line 20, in get_rgb Z[Z < 0] = 0. ^^^^^ TypeError: '<' not supported between instances of '_io.BufferedReader' and 'int'
- 参照ページ
pyplots_Examples code: whats_new_99_axes_grid.py
axes-grid1-demo-axes-rgb-py
- リリースノート
- 2023/12/08 Ver=1.04 Python 3.12.0 (matplotlib 3.8.1)で確認
- 2023/12/08 Ver=1.04 Python 3.11.6 (matplotlib 3.7.1)で確認
- 2023/04/05 Ver=1.03 Python 3.11.2 で確認
- 2020/11/02 Ver=1.01 Python 3.7.8 で確認
- 2018/12/06 Ver=1.01 初版リリース
- 関連ページ