|
|
matplotlib pyplots_Examples 14_auto_subplots_adjust. |
H.Kamifuji . |
- auto_subplots_adjust.py
import matplotlib.pyplot as plt
import matplotlib.transforms as mtransforms
fig = plt.figure()
ax = fig.add_subplot(111)
ax.plot(range(10))
ax.set_yticks((2,5,7))
labels = ax.set_yticklabels(('really, really, really', 'long', 'labels'))

def on_draw(event):
   bboxes = []
   for label in labels:
       bbox = label.get_window_extent()
       # the figure transform goes from relative coords->pixels and we
       # want the inverse of that
       bboxi = bbox.inverse_transformed(fig.transFigure)
       bboxes.append(bboxi)

   # this is the bbox that bounds all the bboxes, again in relative
   # figure coords
   bbox = mtransforms.Bbox.union(bboxes)
   if fig.subplotpars.left < bbox.width:
       # we need to move it over
       fig.subplots_adjust(left=1.1*bbox.width) # pad a little
       fig.canvas.draw()
   return False

fig.canvas.mpl_connect('draw_event', on_draw)

plt.show()
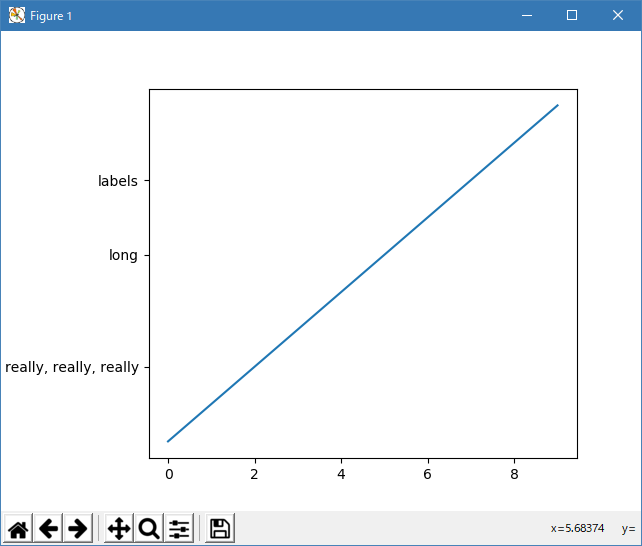
- 実行結果( auto_subplots_adjust.png )
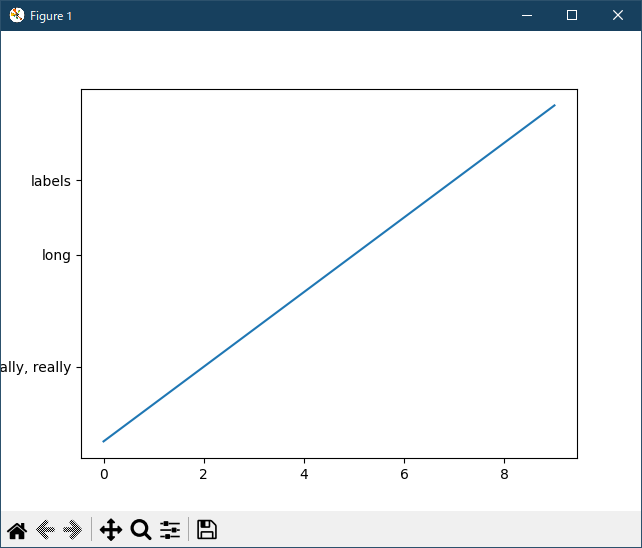
Python 3.11.6 (matplotlib 3.7.1) では、下記のような警告があるが、実行できる。ただし、subplots_adjust が機能していない。
Traceback (most recent call last):
  File "C:\Users\______\AppData\Local\Programs\Python\Python311\Lib
    \site-packages\matplotlib\cbook\__init__.py", line 304, in process
    func(*args, **kwargs)
  File "M:\______\auto_subplots_adjust.py", line 15, in on_draw
    bboxi = bbox.inverse_transformed(fig.transFigure)
            ^^^^^^^^^^^^^^^^^^^^^^^^
AttributeError: 'Bbox' object has no attribute 'inverse_transformed'
Python 3.12.0 (matplotlib 3.8.1) では、下記のような警告があるが、実行できる。ただし、subplots_adjust が機能していない。
Traceback (most recent call last):
  File "C:\Program Files\Python312\Lib\site-packages\matplotlib\cbook.py",
    line 298, in process
    func(*args, **kwargs)
  File "E:\______\auto_subplots_adjust.py", line 15, in on_draw
    bboxi = bbox.inverse_transformed(fig.transFigure)
            ^^^^^^^^^^^^^^^^^^^^^^^^
AttributeError: 'Bbox' object has no attribute 'inverse_transformed'
下図参照。
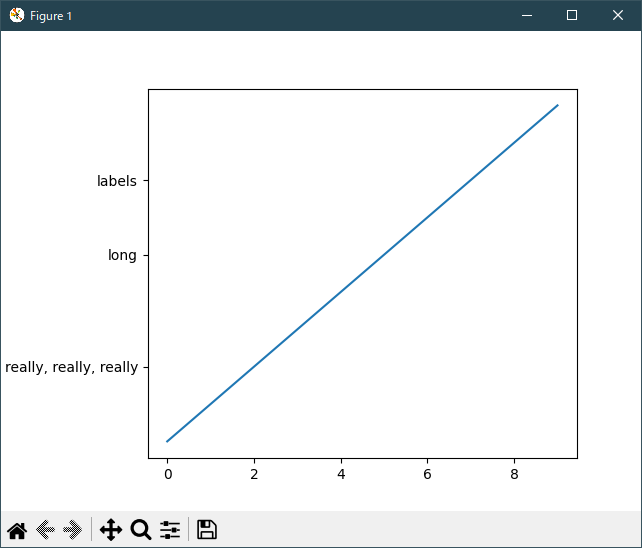
Python 3.11.6 (matplotlib 3.7.1) 及び Python 3.12.0 (matplotlib 3.8.1) で、見直し中、新しいサンプル(subplots-axes-and-figures-auto-subplots-adjust-py) を見つけ、下記のコードで、正常に実行できました。
""" =============================================== Programmatically controlling subplot adjustment =============================================== .. note:: This example is primarily intended to show some advanced concepts in Matplotlib. If you are only looking for having enough space for your labels, it is almost always simpler and good enough to either set the subplot parameters manually using `.Figure.subplots_adjust`, or use one of the automatic layout mechanisms (:ref:`constrainedlayout_guide` or :ref:`tight_layout_guide`). This example describes a user-defined way to read out Artist sizes and set the subplot parameters accordingly. Its main purpose is to illustrate some advanced concepts like reading out text positions, working with bounding boxes and transforms and using :ref:`eventsPython 3.11.6 (matplotlib 3.7.1) 及び Python 3.12.0 (matplotlib 3.8.1) 共に、正常実行です。`. But it can also serve as a starting point if you want to automate the layouting and need more flexibility than tight layout and constrained layout. Below, we collect the bounding boxes of all y-labels and move the left border of the subplot to the right so that it leaves enough room for the union of all the bounding boxes. There's one catch with calculating text bounding boxes: Querying the text bounding boxes (`.Text.get_window_extent`) needs a renderer (`.RendererBase` instance), to calculate the text size. This renderer is only available after the figure has been drawn (`.Figure.draw`). A solution to this is putting the adjustment logic in a draw callback. This function is executed after the figure has been drawn. It can now check if the subplot leaves enough room for the text. If not, the subplot parameters are updated and second draw is triggered. .. redirect-from:: /gallery/pyplots/auto_subplots_adjust """ import matplotlib.pyplot as plt import matplotlib.transforms as mtransforms fig, ax = plt.subplots() ax.plot(range(10)) ax.set_yticks([2, 5, 7], labels=['really, really, really', 'long', 'labels']) def on_draw(event): bboxes = [] for label in ax.get_yticklabels(): # Bounding box in pixels bbox_px = label.get_window_extent() # Transform to relative figure coordinates. This is the inverse of # transFigure. bbox_fig = bbox_px.transformed(fig.transFigure.inverted()) bboxes.append(bbox_fig) # the bbox that bounds all the bboxes, again in relative figure coords bbox = mtransforms.Bbox.union(bboxes) if fig.subplotpars.left < bbox.width: # Move the subplot left edge more to the right fig.subplots_adjust(left=1.1*bbox.width) # pad a little fig.canvas.draw() fig.canvas.mpl_connect('draw_event', on_draw) plt.show() # %% # # .. admonition:: References # # The use of the following functions, methods, classes and modules is shown # in this example: # # - `matplotlib.artist.Artist.get_window_extent` # - `matplotlib.transforms.Bbox` # - `matplotlib.transforms.BboxBase.transformed` # - `matplotlib.transforms.BboxBase.union` # - `matplotlib.transforms.Transform.inverted` # - `matplotlib.figure.Figure.subplots_adjust` # - `matplotlib.figure.SubplotParams` # - `matplotlib.backend_bases.FigureCanvasBase.mpl_connect`
bboxi = bbox.inverse_transformed(fig.transFigure) が
bbox_fig = bbox_px.transformed(fig.transFigure.inverted()) に、変更されている。
- 参照ページ
pyplots_Examples code: auto_subplots_adjust.py
subplots-axes-and-figures-auto-subplots-adjust-py
- リリースノート
- 2023/12/08 Ver=1.04 Python 3.12.0 (matplotlib 3.8.1)で確認
- 2023/12/08 Ver=1.04 Python 3.11.6 (matplotlib 3.7.1)で確認
- 2023/04/04 Ver=1.03 Python 3.11.2 で確認
- 2020/11/02 Ver=1.01 Python 3.7.8 で確認
- 2018/12/06 Ver=1.01 初版リリース
- 関連ページ