|
|
pylab_examples_Examples a7_webapp_demo. |
H.Kamifuji . |
- webapp_demo.py
この例は、agg バックエンドを直接使用してイメージを作成する方法を示しています。これは、pyplot インターフェイスを使用せずに図を管理したり、図を閉じたりすることなく、コードを完全に制御したい Web アプリケーション開発者にとって役に立ちます。
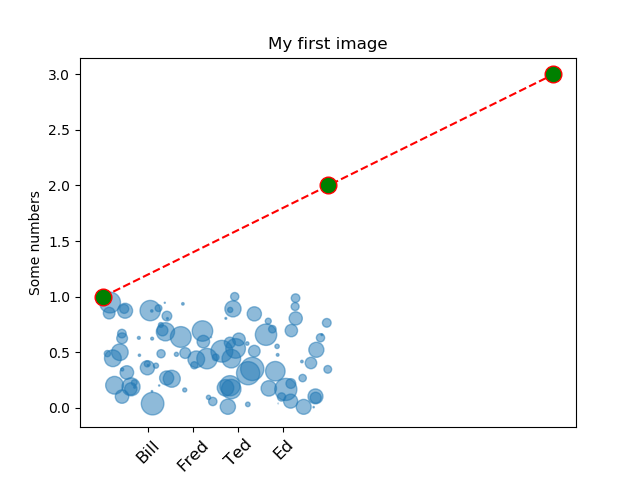
# -*- noplot -*-
"""
This example shows how to use the agg backend directly to create
images, which may be of use to web application developers who want
full control over their code without using the pyplot interface to
manage figures, figure closing etc.

.. note::

    It is not necessary to avoid using the pyplot interface in order to
    create figures without a graphical front-end - simply setting
    the backend to "Agg" would be sufficient.


It is also worth noting that, because matplotlib can save figures to file-like
object, matplotlib can also be used inside a cgi-script *without* needing to
write a figure to disk.

"""

from matplotlib.backends.backend_agg import FigureCanvasAgg
from matplotlib.figure import Figure
import numpy as np


def make_fig():
    """
    Make a figure and save it to "webagg.png".

    """
    fig = Figure()
    ax = fig.add_subplot(1, 1, 1)

    ax.plot([1, 2, 3], 'ro--', markersize=12, markerfacecolor='g')

    # make a translucent scatter collection
    x = np.random.rand(100)
    y = np.random.rand(100)
    area = np.pi * (10 * np.random.rand(100)) ** 2  # 0 to 10 point radii
    c = ax.scatter(x, y, area)
    c.set_alpha(0.5)

    # add some text decoration
    ax.set_title('My first image')
    ax.set_ylabel('Some numbers')
    ax.set_xticks((.2, .4, .6, .8))
    labels = ax.set_xticklabels(('Bill', 'Fred', 'Ted', 'Ed'))

    # To set object properties, you can either iterate over the
    # objects manually, or define you own set command, as in setapi
    # above.
    for label in labels:
        label.set_rotation(45)
        label.set_fontsize(12)

    FigureCanvasAgg(fig).print_png('webapp.png', dpi=150)

make_fig()
- 実行結果( webapp.png )
Python 3.11.2 見直しました。上記のコードでは、下記のエラーが発生します。
Traceback (most recent call last):
File "_:\webapp_demo.py", line 58, in <module>
make_fig()
File "_:\webapp_demo.py", line 56, in make_fig
FigureCanvasAgg(fig).print_png('webapp_ux.png', dpi=150)
TypeError: FigureCanvasAgg.print_png() got an unexpected keyword argument 'dpi'
matplotlib 内部のエラーのようです。matplotlib の改修(先祖帰りバグの改修)を待つしかない。
Python 3.11.6 (matplotlib 3.7.1) では、下記のようなエラーがあり、実行できる。
Traceback (most recent call last): File "M:\______\webapp_demo.py", line 58, in
Python 3.12.0 (matplotlib 3.8.1) では、下記のようなエラーがあり、実行できる。make_fig() File "M:\______\webapp_demo.py", line 56, in make_fig FigureCanvasAgg(fig).print_png('webapp_ux.png', dpi=150) TypeError: FigureCanvasAgg.print_png() got an unexpected keyword argument 'dpi'
Traceback (most recent call last): File "E:\______\webapp_demo.py", line 58, in
Python 3.11.6 (matplotlib 3.7.1) 及び Python 3.12.0 (matplotlib 3.8.1) 共に、dpi キーワードがないと言っているので、削除を試みます。API リファレンス ( backend_agg_api ) を見ると、dpi キーワードは、ありません。make_fig() File "E:\______\webapp_demo.py", line 56, in make_fig FigureCanvasAgg(fig).print_png('webapp_ux.png', dpi=150) TypeError: FigureCanvasAgg.print_png() got an unexpected keyword argument 'dpi'
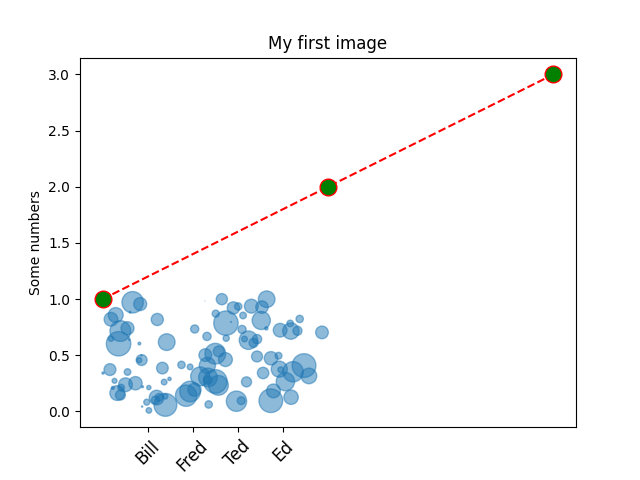
# -*- noplot -*-
"""
This example shows how to use the agg backend directly to create
images, which may be of use to web application developers who want
full control over their code without using the pyplot interface to
manage figures, figure closing etc.

.. note::

    It is not necessary to avoid using the pyplot interface in order to
    create figures without a graphical front-end - simply setting
    the backend to "Agg" would be sufficient.


It is also worth noting that, because matplotlib can save figures to file-like
object, matplotlib can also be used inside a cgi-script *without* needing to
write a figure to disk.

"""

from matplotlib.backends.backend_agg import FigureCanvasAgg
from matplotlib.figure import Figure
import numpy as np


def make_fig():
    """
    Make a figure and save it to "webagg.png".

    """
    fig = Figure()
    ax = fig.add_subplot(1, 1, 1)

    ax.plot([1, 2, 3], 'ro--', markersize=12, markerfacecolor='g')

    # make a translucent scatter collection
    x = np.random.rand(100)
    y = np.random.rand(100)
    area = np.pi * (10 * np.random.rand(100)) ** 2  # 0 to 10 point radii
    c = ax.scatter(x, y, area)
    c.set_alpha(0.5)

    # add some text decoration
    ax.set_title('My first image')
    ax.set_ylabel('Some numbers')
    ax.set_xticks((.2, .4, .6, .8))
    labels = ax.set_xticklabels(('Bill', 'Fred', 'Ted', 'Ed'))

    # To set object properties, you can either iterate over the
    # objects manually, or define you own set command, as in setapi
    # above.
    for label in labels:
        label.set_rotation(45)
        label.set_fontsize(12)

    FigureCanvasAgg(fig).print_png('webapp_ux_1.png')

make_fig()
Python 3.11.6 (matplotlib 3.7.1) 及び Python 3.12.0 (matplotlib 3.8.1) 共に、正常実行です。
- 参照ページ
pylab_examples_Examples code: webapp_demo.py
backend_agg_api
- リリースノート
- 2023/12/07 Ver=1.04 Python 3.12.0 (matplotlib 3.8.1)で確認
- 2023/12/07 Ver=1.04 Python 3.11.6 (matplotlib 3.7.1)で確認
- 2023/04/04 Ver=1.03 Python 3.11.2 で確認
- 2020/11/01 Ver=1.01 Python 3.7.8 で確認
- 2018/12/04 Ver=1.01 初版リリース
- 関連ページ