|
pylab_examples_Examples 98_tricontour_vs_griddata. |
H.Kamifuji . |
- tricontour_vs_griddata.py
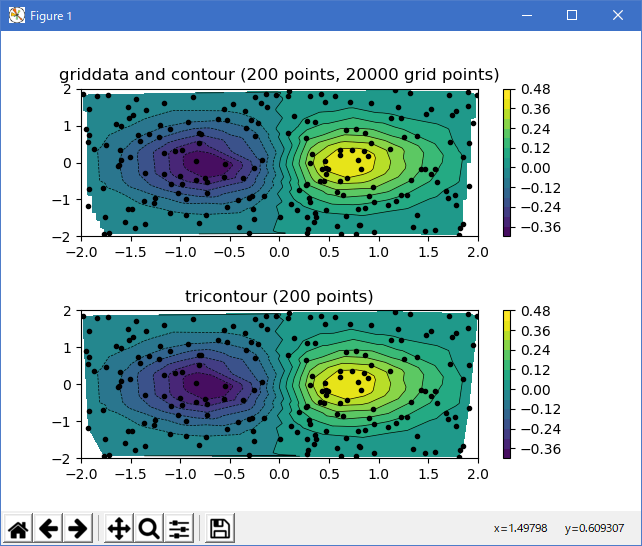
非構造化三角グリッドのグリッドデータとトリコントールの比較
この事例は、Windows10_1909 で Python 3.9.0 環境では、動作しません。( zi = mlab.griddata(x, y, z, xi, yi, interp='linear') が削除されたのか? )
"""
Comparison of griddata and tricontour for an unstructured triangular grid.
"""
from __future__ import print_function
import matplotlib.pyplot as plt
import matplotlib.tri as tri
import numpy as np
import numpy.random as rnd
import matplotlib.mlab as mlab
import time

rnd.seed(0)
npts = 200
ngridx = 100
ngridy = 200
x = rnd.uniform(-2, 2, npts)
y = rnd.uniform(-2, 2, npts)
z = x*np.exp(-x**2 - y**2)

# griddata and contour.
start = time.clock()
plt.subplot(211)
xi = np.linspace(-2.1, 2.1, ngridx)
yi = np.linspace(-2.1, 2.1, ngridy)
zi = mlab.griddata(x, y, z, xi, yi, interp='linear')
plt.contour(xi, yi, zi, 15, linewidths=0.5, colors='k')
plt.contourf(xi, yi, zi, 15,
             norm=plt.Normalize(vmax=abs(zi).max(), vmin=-abs(zi).max()))
plt.colorbar()  # draw colorbar
plt.plot(x, y, 'ko', ms=3)
plt.xlim(-2, 2)
plt.ylim(-2, 2)
plt.title('griddata and contour (%d points, %d grid points)' %
          (npts, ngridx*ngridy))
print('griddata and contour seconds: %f' % (time.clock() - start))

# tricontour.
start = time.clock()
plt.subplot(212)
triang = tri.Triangulation(x, y)
plt.tricontour(x, y, z, 15, linewidths=0.5, colors='k')
plt.tricontourf(x, y, z, 15,
                norm=plt.Normalize(vmax=abs(zi).max(), vmin=-abs(zi).max()))
plt.colorbar()
plt.plot(x, y, 'ko', ms=3)
plt.xlim(-2, 2)
plt.ylim(-2, 2)
plt.title('tricontour (%d points)' % npts)
print('tricontour seconds: %f' % (time.clock() - start))

plt.subplots_adjust(hspace=0.5)

plt.show()
- 実行結果( tricontour_vs_griddata.png )

Python 3.11.2 見直しました。上記のコードでは、下記のエラーが発生します。
Traceback (most recent call last):
File "_:\tricontour_vs_griddata.py", line 21, in <module>
start = time.clock()
^^^^^^^^^^
AttributeError: module 'time' has no attribute 'clock'
matplotlib 内部のエラーのようです。matplotlib の改修(先祖帰りバグの改修)を待つしかない。
Python 3.11.6 (matplotlib 3.7.1) では、下記のようなエラーがあり、実行できない。
Traceback (most recent call last): File "M:\______\tricontour_vs_griddata.py", line 21, in
Python 3.12.0 (matplotlib 3.8.1) では、下記のようなエラーがあり、実行できない。start = time.clock() ^^^^^^^^^^ AttributeError: module 'time' has no attribute 'clock'
Traceback (most recent call last): File "E:\______\tricontour_vs_griddata.py", line 21, in
Python 3.11.6 (matplotlib 3.7.1) 及び Python 3.12.0 (matplotlib 3.8.1) で、見直し中、新しいサンプル(images-contours-and-fields-irregulardatagrid-py) を見つけ、下記のコードで、正常に実行できました。start = time.clock() ^^^^^^^^^^ AttributeError: module 'time' has no attribute 'clock'
"""
=======================================
Contour plot of irregularly spaced data
=======================================

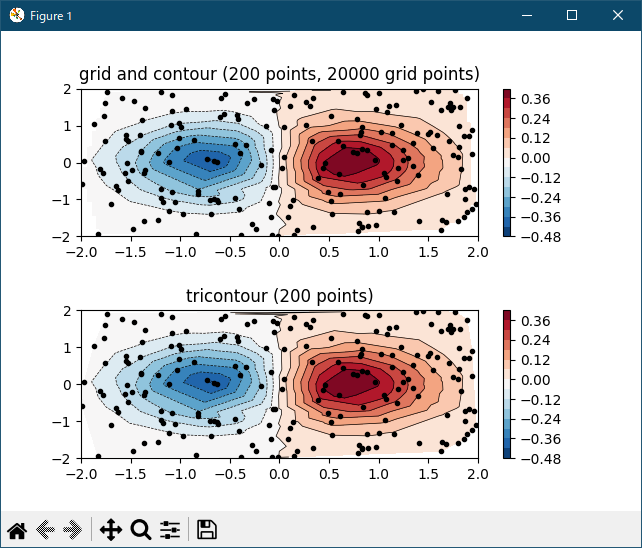
Comparison of a contour plot of irregularly spaced data interpolated
on a regular grid versus a tricontour plot for an unstructured triangular grid.

Since `~.axes.Axes.contour` and `~.axes.Axes.contourf` expect the data to live
on a regular grid, plotting a contour plot of irregularly spaced data requires
different methods. The two options are:

* Interpolate the data to a regular grid first. This can be done with on-board
  means, e.g. via `~.tri.LinearTriInterpolator` or using external functionality
  e.g. via `scipy.interpolate.griddata`. Then plot the interpolated data with
  the usual `~.axes.Axes.contour`.
* Directly use `~.axes.Axes.tricontour` or `~.axes.Axes.tricontourf` which will
  perform a triangulation internally.

This example shows both methods in action.
"""

import matplotlib.pyplot as plt
import numpy as np

import matplotlib.tri as tri

np.random.seed(19680801)
npts = 200
ngridx = 100
ngridy = 200
x = np.random.uniform(-2, 2, npts)
y = np.random.uniform(-2, 2, npts)
z = x * np.exp(-x**2 - y**2)

fig, (ax1, ax2) = plt.subplots(nrows=2)

# -----------------------
# Interpolation on a grid
# -----------------------
# A contour plot of irregularly spaced data coordinates
# via interpolation on a grid.

# Create grid values first.
xi = np.linspace(-2.1, 2.1, ngridx)
yi = np.linspace(-2.1, 2.1, ngridy)

# Linearly interpolate the data (x, y) on a grid defined by (xi, yi).
triang = tri.Triangulation(x, y)
interpolator = tri.LinearTriInterpolator(triang, z)
Xi, Yi = np.meshgrid(xi, yi)
zi = interpolator(Xi, Yi)

# Note that scipy.interpolate provides means to interpolate data on a grid
# as well. The following would be an alternative to the four lines above:
# from scipy.interpolate import griddata
# zi = griddata((x, y), z, (xi[None, :], yi[:, None]), method='linear')

ax1.contour(xi, yi, zi, levels=14, linewidths=0.5, colors='k')
cntr1 = ax1.contourf(xi, yi, zi, levels=14, cmap="RdBu_r")

fig.colorbar(cntr1, ax=ax1)
ax1.plot(x, y, 'ko', ms=3)
ax1.set(xlim=(-2, 2), ylim=(-2, 2))
ax1.set_title('grid and contour (%d points, %d grid points)' %
              (npts, ngridx * ngridy))

# ----------
# Tricontour
# ----------
# Directly supply the unordered, irregularly spaced coordinates
# to tricontour.

ax2.tricontour(x, y, z, levels=14, linewidths=0.5, colors='k')
cntr2 = ax2.tricontourf(x, y, z, levels=14, cmap="RdBu_r")

fig.colorbar(cntr2, ax=ax2)
ax2.plot(x, y, 'ko', ms=3)
ax2.set(xlim=(-2, 2), ylim=(-2, 2))
ax2.set_title('tricontour (%d points)' % npts)

plt.subplots_adjust(hspace=0.5)
plt.show()

# %%
#
# .. admonition:: References
#
#    The use of the following functions, methods, classes and modules is shown
#    in this example:
#
#    - `matplotlib.axes.Axes.contour` / `matplotlib.pyplot.contour`
#    - `matplotlib.axes.Axes.contourf` / `matplotlib.pyplot.contourf`
#    - `matplotlib.axes.Axes.tricontour` / `matplotlib.pyplot.tricontour`
#    - `matplotlib.axes.Axes.tricontourf` / `matplotlib.pyplot.tricontourf`
Python 3.11.6 (matplotlib 3.7.1) 及び Python 3.12.0 (matplotlib 3.8.1) 共に、正常実行です。

- 参照ページ
pylab_examples_Examples code: tricontour_vs_griddata.py
images-contours-and-fields-irregulardatagrid-py
- リリースノート
- 2023/12/06 Ver=1.04 Python 3.12.0 (matplotlib 3.8.1)で確認
- 2023/12/06 Ver=1.04 Python 3.11.6 (matplotlib 3.7.1)で確認
- 2023/04/04 Ver=1.03 Python 3.11.2 で確認
- 2020/11/01 Ver=1.01 Python 3.7.8 で確認
- 2018/12/04 Ver=1.01 初版リリース
- 関連ページ