|
|
pylab_examples_Examples 84_symlog_demo. |
H.Kamifuji . |
- symlog_demo.py
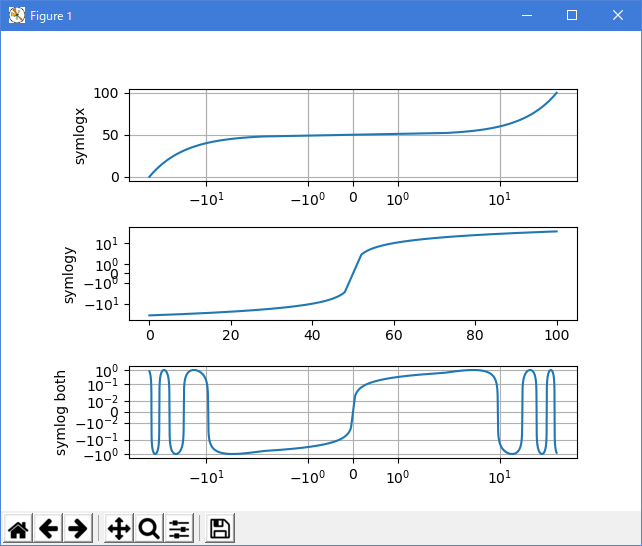
import matplotlib.pyplot as plt
import numpy as np

dt = 0.01
x = np.arange(-50.0, 50.0, dt)
y = np.arange(0, 100.0, dt)

plt.subplot(311)
plt.plot(x, y)
plt.xscale('symlog')
plt.ylabel('symlogx')
plt.grid(True)
plt.gca().xaxis.grid(True, which='minor')  # minor grid on too

plt.subplot(312)
plt.plot(y, x)
plt.yscale('symlog')
plt.ylabel('symlogy')

plt.subplot(313)
plt.plot(x, np.sin(x / 3.0))
plt.xscale('symlog')
plt.yscale('symlog', linthreshy=0.015)
plt.grid(True)
plt.ylabel('symlog both')

plt.subplots_adjust(hspace=0.5, left=0.2)

plt.show()
- 実行結果( symlog_demo.png )
Python 3.11.2 見直しました。上記のコードでは、下記のエラーが発生します。
Traceback (most recent call last):
File "_:\symlog_demo.py", line 23, in <module>
plt.yscale('symlog', linthreshy=0.015)
File "C:\Users\_____\AppData\Local\Programs\Python\Python311\Lib\site-packages\matplotlib\pyplot.py", line 3113, in yscale
return gca().set_yscale(value, **kwargs)
^^^^^^^^^^^^^^^^^^^^^^^^^^^^^^^^^
File "C:\Users\_____\AppData\Local\Programs\Python\Python311\Lib\site-packages\matplotlib\axes\_base.py", line 74, in wrapper
return get_method(self)(*args, **kwargs)
^^^^^^^^^^^^^^^^^^^^^^^^^^^^^^^^^
File "C:\Users\_____\AppData\Local\Programs\Python\Python311\Lib\site-packages\matplotlib\axis.py", line 810, in _set_axes_scale
ax._axis_map[name]._set_scale(value, **kwargs)
File "C:\Users\_____\AppData\Local\Programs\Python\Python311\Lib\site-packages\matplotlib\axis.py", line 767, in _set_scale
self._scale = mscale.scale_factory(value, self, **kwargs)
^^^^^^^^^^^^^^^^^^^^^^^^^^^^^^^^^^^^^^^^^^^
File "C:\Users\_____\AppData\Local\Programs\Python\Python311\Lib\site-packages\matplotlib\scale.py", line 714, in scale_factory
return scale_cls(axis, **kwargs)
^^^^^^^^^^^^^^^^^^^^^^^^^
TypeError: SymmetricalLogScale.__init__() got an unexpected keyword argument 'linthreshy'
matplotlib 内部のエラーのようです。matplotlib の改修(先祖帰りバグの改修)を待つしかない。
Python 3.11.6 (matplotlib 3.7.1) では、下記のようなエラーがあり、実行できない。
Traceback (most recent call last): File "M:\______\symlog_demo.py", line 23, in
Python 3.12.0 (matplotlib 3.8.1) では、下記のようなエラーがあり、実行できない。plt.yscale('symlog', linthreshy=0.015) File "C:\Users\______\AppData\Local\Programs\Python\Python311\Lib \site-packages\matplotlib\pyplot.py", line 3113, in yscale return gca().set_yscale(value, **kwargs) ^^^^^^^^^^^^^^^^^^^^^^^^^^^^^^^^^ File "C:\Users\______\AppData\Local\Programs\Python\Python311\Lib \site-packages\matplotlib\axes\_base.py", line 74, in wrapper return get_method(self)(*args, **kwargs) ^^^^^^^^^^^^^^^^^^^^^^^^^^^^^^^^^ File "C:\Users\______\AppData\Local\Programs\Python\Python311\Lib \site-packages\matplotlib\axis.py", line 810, in _set_axes_scale ax._axis_map[name]._set_scale(value, **kwargs) File "C:\Users\______\AppData\Local\Programs\Python\Python311\Lib \site-packages\matplotlib\axis.py", line 767, in _set_scale self._scale = mscale.scale_factory(value, self, **kwargs) ^^^^^^^^^^^^^^^^^^^^^^^^^^^^^^^^^^^^^^^^^^^ File "C:\Users\______\AppData\Local\Programs\Python\Python311\Lib \site-packages\matplotlib\scale.py", line 714, in scale_factory return scale_cls(axis, **kwargs) ^^^^^^^^^^^^^^^^^^^^^^^^^ TypeError: SymmetricalLogScale.__init__() got an unexpected keyword argument 'linthreshy'
Traceback (most recent call last): File "E:\______\symlog_demo.py", line 23, in
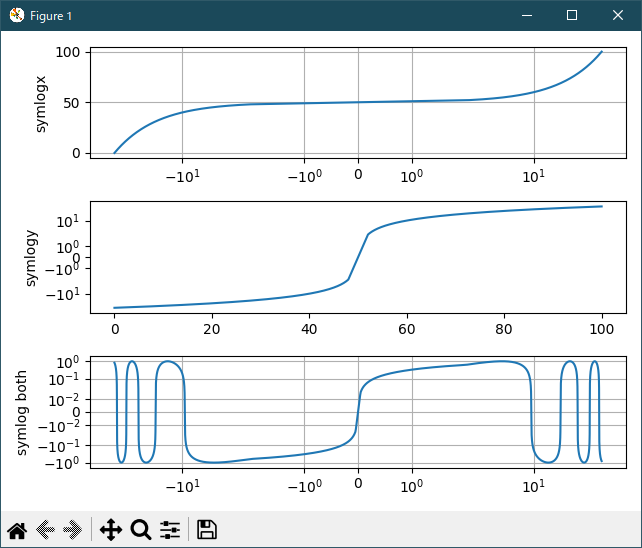
Python 3.11.6 (matplotlib 3.7.1) 及び Python 3.12.0 (matplotlib 3.8.1) で、見直し中、新しいサンプル( scales-symlog-demo-py ) を見つけ、下記のコードで、正常に実行できました。plt.yscale('symlog', linthreshy=0.015) File "C:\Program Files\Python312\Lib\site-packages\matplotlib\pyplot.py", line 4167, in yscale gca().set_yscale(value, **kwargs) File "C:\Program Files\Python312\Lib\site-packages\matplotlib\axes\_base.py", line 73, in wrapper return get_method(self)(*args, **kwargs) ^^^^^^^^^^^^^^^^^^^^^^^^^^^^^^^^^ File "C:\Program Files\Python312\Lib\site-packages\matplotlib\axis.py", line 837, in _set_axes_scale ax._axis_map[name]._set_scale(value, **kwargs) File "C:\Program Files\Python312\Lib\site-packages\matplotlib\axis.py", line 796, in _set_scale self._scale = mscale.scale_factory(value, self, **kwargs) ^^^^^^^^^^^^^^^^^^^^^^^^^^^^^^^^^^^^^^^^^^^ File "C:\Program Files\Python312\Lib\site-packages\matplotlib\scale.py", line 717, in scale_factory return scale_cls(axis, **kwargs) ^^^^^^^^^^^^^^^^^^^^^^^^^ TypeError: SymmetricalLogScale.__init__() got an unexpected keyword argument 'linthreshy'
"""
===========
Symlog Demo
===========

Example use of symlog (symmetric log) axis scaling.
"""
import matplotlib.pyplot as plt
import numpy as np

dt = 0.01
x = np.arange(-50.0, 50.0, dt)
y = np.arange(0, 100.0, dt)

fig, (ax0, ax1, ax2) = plt.subplots(nrows=3)

ax0.plot(x, y)
ax0.set_xscale('symlog')
ax0.set_ylabel('symlogx')
ax0.grid()
ax0.xaxis.grid(which='minor')  # minor grid on too

ax1.plot(y, x)
ax1.set_yscale('symlog')
ax1.set_ylabel('symlogy')

ax2.plot(x, np.sin(x / 3.0))
ax2.set_xscale('symlog')
ax2.set_yscale('symlog', linthresh=0.015)
ax2.grid()
ax2.set_ylabel('symlog both')

fig.tight_layout()
plt.show()

# %%
# It should be noted that the coordinate transform used by ``symlog``
# has a discontinuous gradient at the transition between its linear
# and logarithmic regions. The ``asinh`` axis scale is an alternative
# technique that may avoid visual artifacts caused by these discontinuities.

# %%
#
# .. admonition:: References
#
#    - `matplotlib.scale.SymmetricalLogScale`
#    - `matplotlib.ticker.SymmetricalLogLocator`
#    - `matplotlib.scale.AsinhScale`
Python 3.11.6 (matplotlib 3.7.1) 及び Python 3.12.0 (matplotlib 3.8.1) 共に、正常実行です。
- 参照ページ
pylab_examples_Examples code: symlog_demo.py
scales-symlog-demo-py
- リリースノート
- 2023/12/06 Ver=1.04 Python 3.12.0 (matplotlib 3.8.1)で確認
- 2023/12/06 Ver=1.04 Python 3.11.6 (matplotlib 3.7.1)で確認
- 2023/04/04 Ver=1.03 Python 3.11.2 で確認
- 2020/11/01 Ver=1.01 Python 3.7.8 で確認
- 2018/12/04 Ver=1.01 初版リリース
- 関連ページ