|
|
pylab_examples_Examples 75_stackplot_demo. |
H.Kamifuji . |
- stackplot_demo.py
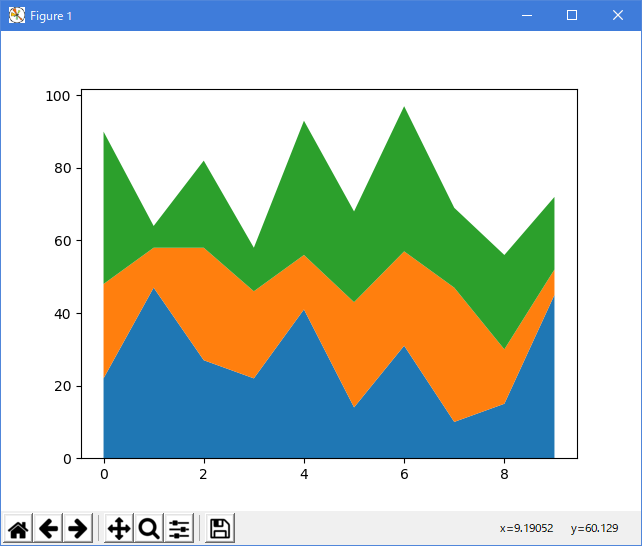
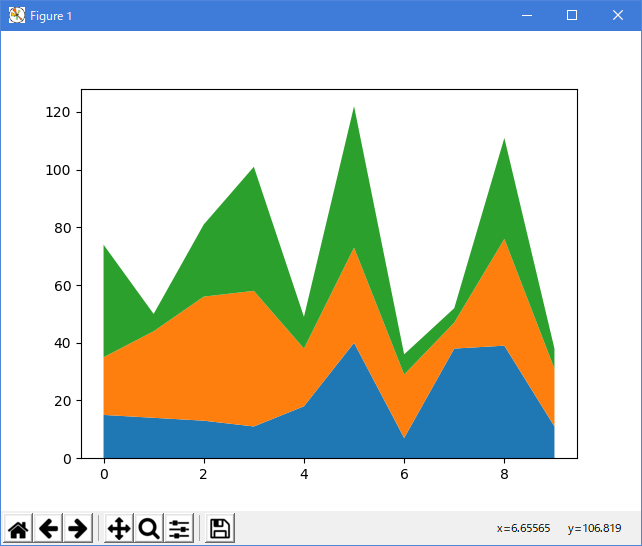
import numpy as np
import matplotlib.pyplot as plt


def fnx():
    return np.random.randint(5, 50, 10)

y = np.row_stack((fnx(), fnx(), fnx()))
x = np.arange(10)

y1, y2, y3 = fnx(), fnx(), fnx()

fig, ax = plt.subplots()
ax.stackplot(x, y)
plt.show()

fig, ax = plt.subplots()
ax.stackplot(x, y1, y2, y3)
plt.show()
- 実行結果( stackplot_demo.png )
- 参照ページ
pylab_examples_Examples code: stackplot_demo.py
- リリースノート
- 2023/04/03 Ver=1.03 Python 3.11.2 で確認
- 2020/11/01 Ver=1.01 Python 3.7.8 で確認
- 2018/12/04 Ver=1.01 初版リリース
- 関連ページ