|
|
pylab_examples_Examples 73_spine_placement_demo. |
H.Kamifuji . |
- spine_placement_demo.py
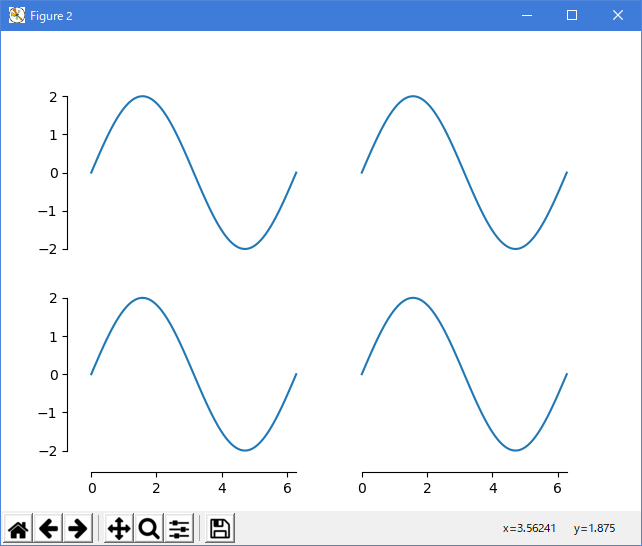
import numpy as np
import matplotlib.pyplot as plt


fig = plt.figure()
x = np.linspace(-np.pi, np.pi, 100)
y = 2*np.sin(x)

ax = fig.add_subplot(2, 2, 1)
ax.set_title('centered spines')
ax.plot(x, y)
ax.spines['left'].set_position('center')
ax.spines['right'].set_color('none')
ax.spines['bottom'].set_position('center')
ax.spines['top'].set_color('none')
ax.spines['left'].set_smart_bounds(True)
ax.spines['bottom'].set_smart_bounds(True)
ax.xaxis.set_ticks_position('bottom')
ax.yaxis.set_ticks_position('left')

ax = fig.add_subplot(2, 2, 2)
ax.set_title('zeroed spines')
ax.plot(x, y)
ax.spines['left'].set_position('zero')
ax.spines['right'].set_color('none')
ax.spines['bottom'].set_position('zero')
ax.spines['top'].set_color('none')
ax.spines['left'].set_smart_bounds(True)
ax.spines['bottom'].set_smart_bounds(True)
ax.xaxis.set_ticks_position('bottom')
ax.yaxis.set_ticks_position('left')

ax = fig.add_subplot(2, 2, 3)
ax.set_title('spines at axes (0.6, 0.1)')
ax.plot(x, y)
ax.spines['left'].set_position(('axes', 0.6))
ax.spines['right'].set_color('none')
ax.spines['bottom'].set_position(('axes', 0.1))
ax.spines['top'].set_color('none')
ax.spines['left'].set_smart_bounds(True)
ax.spines['bottom'].set_smart_bounds(True)
ax.xaxis.set_ticks_position('bottom')
ax.yaxis.set_ticks_position('left')

ax = fig.add_subplot(2, 2, 4)
ax.set_title('spines at data (1, 2)')
ax.plot(x, y)
ax.spines['left'].set_position(('data', 1))
ax.spines['right'].set_color('none')
ax.spines['bottom'].set_position(('data', 2))
ax.spines['top'].set_color('none')
ax.spines['left'].set_smart_bounds(True)
ax.spines['bottom'].set_smart_bounds(True)
ax.xaxis.set_ticks_position('bottom')
ax.yaxis.set_ticks_position('left')
# ----------------------------------------------------


def adjust_spines(ax, spines):
    for loc, spine in ax.spines.items():
        if loc in spines:
            spine.set_position(('outward', 10))  # outward by 10 points
            spine.set_smart_bounds(True)
        else:
            spine.set_color('none')  # don't draw spine

    # turn off ticks where there is no spine
    if 'left' in spines:
        ax.yaxis.set_ticks_position('left')
    else:
        # no yaxis ticks
        ax.yaxis.set_ticks([])

    if 'bottom' in spines:
        ax.xaxis.set_ticks_position('bottom')
    else:
        # no xaxis ticks
        ax.xaxis.set_ticks([])

fig = plt.figure()

x = np.linspace(0, 2*np.pi, 100)
y = 2*np.sin(x)

ax = fig.add_subplot(2, 2, 1)
ax.plot(x, y, clip_on=False)
adjust_spines(ax, ['left'])

ax = fig.add_subplot(2, 2, 2)
ax.plot(x, y, clip_on=False)
adjust_spines(ax, [])

ax = fig.add_subplot(2, 2, 3)
ax.plot(x, y, clip_on=False)
adjust_spines(ax, ['left', 'bottom'])

ax = fig.add_subplot(2, 2, 4)
ax.plot(x, y, clip_on=False)
adjust_spines(ax, ['bottom'])

plt.show()
- 実行結果( spine_placement_demo.png )

Python 3.11.2 見直しました。上記のコードでは、下記のエラーが発生します。
Traceback (most recent call last):
File "_:\spine_placement_demo.py", line 16, in <module>
ax.spines['left'].set_smart_bounds(True)
^^^^^^^^^^^^^^^^^^^^^^^^^^^^^^^^^^
AttributeError: 'Spine' object has no attribute 'set_smart_bounds'
matplotlib 内部のエラーのようです。matplotlib の改修(先祖帰りバグの改修)を待つしかない。
Python 3.11.6 (matplotlib 3.7.1) では、下記のようなエラーがあり、実行できない。
Traceback (most recent call last): File "M:\______\spine_placement_demo.py", line 16, in
Python 3.12.0 (matplotlib 3.8.1) では、下記のようなエラーがあり、実行できない。ax.spines['left'].set_smart_bounds(True) ^^^^^^^^^^^^^^^^^^^^^^^^^^^^^^^^^^ AttributeError: 'Spine' object has no attribute 'set_smart_bounds'
Traceback (most recent call last): File "E:\______\spine_placement_demo.py", line 16, in
Python 3.11.6 (matplotlib 3.7.1) 及び Python 3.12.0 (matplotlib 3.8.1) で、見直し中、新しいサンプル( spines-spine-placement-demo-py ) を見つけ、下記のコードで、正常に実行できました。ax.spines['left'].set_smart_bounds(True) ^^^^^^^^^^^^^^^^^^^^^^^^^^^^^^^^^^ AttributeError: 'Spine' object has no attribute 'set_smart_bounds'
"""
===============
Spine placement
===============

The position of the axis spines can be influenced using `~.Spine.set_position`.

Note: If you want to obtain arrow heads at the ends of the axes, also check
out the :doc:`/gallery/spines/centered_spines_with_arrows` example.
"""
import matplotlib.pyplot as plt
import numpy as np

# %%

x = np.linspace(0, 2*np.pi, 100)
y = 2 * np.sin(x)

fig, ax_dict = plt.subplot_mosaic(
    [['center', 'zero'],
     ['axes', 'data']]
)
fig.suptitle('Spine positions')


ax = ax_dict['center']
ax.set_title("'center'")
ax.plot(x, y)
ax.spines[['left', 'bottom']].set_position('center')
ax.spines[['top', 'right']].set_visible(False)

ax = ax_dict['zero']
ax.set_title("'zero'")
ax.plot(x, y)
ax.spines[['left', 'bottom']].set_position('zero')
ax.spines[['top', 'right']].set_visible(False)

ax = ax_dict['axes']
ax.set_title("'axes' (0.2, 0.2)")
ax.plot(x, y)
ax.spines.left.set_position(('axes', 0.2))
ax.spines.bottom.set_position(('axes', 0.2))
ax.spines[['top', 'right']].set_visible(False)

ax = ax_dict['data']
ax.set_title("'data' (1, 2)")
ax.plot(x, y)
ax.spines.left.set_position(('data', 1))
ax.spines.bottom.set_position(('data', 2))
ax.spines[['top', 'right']].set_visible(False)

plt.show()
Python 3.11.6 (matplotlib 3.7.1) 及び Python 3.12.0 (matplotlib 3.8.1) 共に、正常実行です。

- 参照ページ
pylab_examples_Examples code: spine_placement_demo.py
spines-spine-placement-demo-py
- リリースノート
- 2023/12/05 Ver=1.04 Python 3.12.0 (matplotlib 3.8.1)で確認
- 2023/12/05 Ver=1.04 Python 3.11.6 (matplotlib 3.7.1)で確認
- 2023/04/04 Ver=1.03 Python 3.11.2 で確認
- 2020/11/01 Ver=1.01 Python 3.7.8 で確認
- 2018/12/04 Ver=1.01 初版リリース
- 関連ページ