|
pylab_examples_Examples 64_scatter_star_poly. |
H.Kamifuji . |
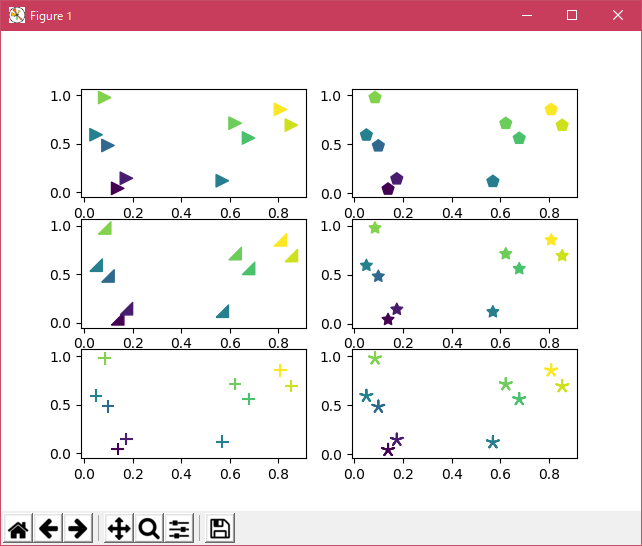
- scatter_star_poly.py
この事例は、Windows10_1909 で Python 3.9.0 環境では、動作しません。( plt.scatter(x, y, s=80, c=z, marker=(verts, 0)) で、内部エラーが発生したのか? )
import numpy as np
import matplotlib.pyplot as plt


x = np.random.rand(10)
y = np.random.rand(10)
z = np.sqrt(x**2 + y**2)

plt.subplot(321)
plt.scatter(x, y, s=80, c=z, marker=">")

plt.subplot(322)
plt.scatter(x, y, s=80, c=z, marker=(5, 0))

verts = list(zip([-1., 1., 1., -1.], [-1., -1., 1., -1.]))
plt.subplot(323)
plt.scatter(x, y, s=80, c=z, marker=(verts, 0))
# equivalent:
#plt.scatter(x,y,s=80, c=z, marker=None, verts=verts)

plt.subplot(324)
plt.scatter(x, y, s=80, c=z, marker=(5, 1))

plt.subplot(325)
plt.scatter(x, y, s=80, c=z, marker='+')

plt.subplot(326)
plt.scatter(x, y, s=80, c=z, marker=(5, 2))

plt.show()
- 実行結果( scatter_star_poly.png )

Python 3.11.2 見直しました。上記のコードでは、下記のエラーが発生します。
Traceback (most recent call last):
File "_:\scatter_star_poly.py", line 17, in <module>
plt.scatter(x, y, s=80, c=z, marker=(verts, 0))
File "C:\Users\_____\AppData\Local\Programs\Python\Python311\Lib\site-packages\matplotlib\pyplot.py", line 2862, in scatter
__ret = gca().scatter(
^^^^^^^^^^^^^^
File "C:\Users\_____\AppData\Local\Programs\Python\Python311\Lib\site-packages\matplotlib\__init__.py", line 1459, in inner
return func(ax, *map(sanitize_sequence, args), **kwargs)
^^^^^^^^^^^^^^^^^^^^^^^^^^^^^^^^^^^^^^^^^^^^^^^^^
File "C:\Users\_____\AppData\Local\Programs\Python\Python311\Lib\site-packages\matplotlib\axes\_axes.py", line 4629, in scatter
marker_obj = mmarkers.MarkerStyle(marker)
^^^^^^^^^^^^^^^^^^^^^^^^^^^^
File "C:\Users\_____\AppData\Local\Programs\Python\Python311\Lib\site-packages\matplotlib\markers.py", line 272, in __init__
self._set_marker(marker)
File "C:\Users\_____\AppData\Local\Programs\Python\Python311\Lib\site-packages\matplotlib\markers.py", line 367, in _set_marker
self._recache()
File "C:\Users\_____\AppData\Local\Programs\Python\Python311\Lib\site-packages\matplotlib\markers.py", line 291, in _recache
self._marker_function()
File "C:\Users\_____\AppData\Local\Programs\Python\Python311\Lib\site-packages\matplotlib\markers.py", line 504, in _set_tuple_marker
self._path = Path.unit_regular_polygon(numsides)
^^^^^^^^^^^^^^^^^^^^^^^^^^^^^^^^^^^
File "C:\Users\_____\AppData\Local\Programs\Python\Python311\Lib\site-packages\matplotlib\path.py", line 749, in unit_regular_polygon
if numVertices <= 16:
^^^^^^^^^^^^^^^^^
TypeError: '<:=' not supported between instances of 'list' and 'int'
matplotlib 内部のエラーのようです。matplotlib の改修(先祖帰りバグの改修)を待つしかない。
Python 3.11.6 (matplotlib 3.7.1) では、下記のようなエラーがあり、実行できない。
Traceback (most recent call last): File "M:\______\scatter_star_poly.py", line 17, in
Python 3.12.0 (matplotlib 3.8.1) では、下記のようなエラーがあり、実行できない。plt.scatter(x, y, s=80, c=z, marker=(verts, 0)) File "C:\Users\______\AppData\Local\Programs\Python\Python311\Lib \site-packages\matplotlib\pyplot.py", line 2862, in scatter __ret = gca().scatter( ^^^^^^^^^^^^^^ File "C:\Users\______\AppData\Local\Programs\Python\Python311\Lib \site-packages\matplotlib\__init__.py", line 1459, in inner return func(ax, *map(sanitize_sequence, args), **kwargs) ^^^^^^^^^^^^^^^^^^^^^^^^^^^^^^^^^^^^^^^^^^^^^^^^^ File "C:\Users\______\AppData\Local\Programs\Python\Python311\Lib \site-packages\matplotlib\axes\_axes.py", line 4629, in scatter marker_obj = mmarkers.MarkerStyle(marker) ^^^^^^^^^^^^^^^^^^^^^^^^^^^^ File "C:\Users\______\AppData\Local\Programs\Python\Python311\Lib \site-packages\matplotlib\markers.py", line 272, in __init__ self._set_marker(marker) File "C:\Users\______\AppData\Local\Programs\Python\Python311\Lib \site-packages\matplotlib\markers.py", line 367, in _set_marker self._recache() File "C:\Users\______\AppData\Local\Programs\Python\Python311\Lib \site-packages\matplotlib\markers.py", line 291, in _recache self._marker_function() File "C:\Users\______\AppData\Local\Programs\Python\Python311\Lib \site-packages\matplotlib\markers.py", line 504, in _set_tuple_marker self._path = Path.unit_regular_polygon(numsides) ^^^^^^^^^^^^^^^^^^^^^^^^^^^^^^^^^^^ File "C:\Users\______\AppData\Local\Programs\Python\Python311\Lib \site-packages\matplotlib\path.py", line 749, in unit_regular_polygon if numVertices <= 16: ^^^^^^^^^^^^^^^^^ TypeError: '<=' not supported between instances of 'list' and 'int'
Traceback (most recent call last): File "E:\______\scatter_star_poly.py", line 17, in
Python 3.11.6 (matplotlib 3.7.1) 及び Python 3.12.0 (matplotlib 3.8.1) で、見直し中、新しいサンプル(lines-bars-and-markers-scatter-star-poly-py) を見つけ、下記のコードで、正常に実行できました。plt.scatter(x, y, s=80, c=z, marker=(verts, 0)) File "C:\Program Files\Python312\Lib\site-packages\matplotlib\pyplot.py", line 3687, in scatter __ret = gca().scatter( ^^^^^^^^^^^^^^ File "C:\Program Files\Python312\Lib\site-packages\matplotlib\__init__.py", line 1478, in inner return func(ax, *map(sanitize_sequence, args), **kwargs) ^^^^^^^^^^^^^^^^^^^^^^^^^^^^^^^^^^^^^^^^^^^^^^^^^ File "C:\Program Files\Python312\Lib\site-packages\matplotlib\axes\_axes.py", line 4697, in scatter marker_obj = mmarkers.MarkerStyle(marker) ^^^^^^^^^^^^^^^^^^^^^^^^^^^^ File "C:\Program Files\Python312\Lib\site-packages\matplotlib\markers.py", line 255, in __init__ self._set_marker(marker) File "C:\Program Files\Python312\Lib\site-packages\matplotlib\markers.py", line 343, in _set_marker self._recache() File "C:\Program Files\Python312\Lib\site-packages\matplotlib\markers.py", line 271, in _recache self._marker_function() File "C:\Program Files\Python312\Lib\site-packages\matplotlib\markers.py", line 480, in _set_tuple_marker self._path = Path.unit_regular_polygon(numsides) ^^^^^^^^^^^^^^^^^^^^^^^^^^^^^^^^^^^ File "C:\Program Files\Python312\Lib\site-packages\matplotlib\path.py", line 753, in unit_regular_polygon if numVertices <= 16: ^^^^^^^^^^^^^^^^^ TypeError: '<=' not supported between instances of 'list' and 'int'
"""
===============
Marker examples
===============

Example with different ways to specify markers.

See also the `matplotlib.markers` documentation for a list of all markers and
:doc:`/gallery/lines_bars_and_markers/marker_reference` for more information
on configuring markers.

.. redirect-from:: /gallery/lines_bars_and_markers/scatter_custom_symbol
.. redirect-from:: /gallery/lines_bars_and_markers/scatter_symbol
.. redirect-from:: /gallery/lines_bars_and_markers/scatter_piecharts
"""
import matplotlib.pyplot as plt
import numpy as np

# Fixing random state for reproducibility
np.random.seed(19680801)

x = np.random.rand(10)
y = np.random.rand(10)
z = np.sqrt(x**2 + y**2)

fig, axs = plt.subplots(2, 3, sharex=True, sharey=True, layout="constrained")

# Matplotlib marker symbol
axs[0, 0].scatter(x, y, s=80, c=z, marker=">")
axs[0, 0].set_title("marker='>'")

# marker from TeX: passing a TeX symbol name enclosed in $-signs
axs[0, 1].scatter(x, y, s=80, c=z, marker=r"$\clubsuit$")
axs[0, 1].set_title(r"marker=r'\$\clubsuit\$'")

# marker from path: passing a custom path of N vertices as a (N, 2) array-like
verts = [[-1, -1], [1, -1], [1, 1], [-1, -1]]
axs[0, 2].scatter(x, y, s=80, c=z, marker=verts)
axs[0, 2].set_title("marker=verts")

# regular pentagon marker
axs[1, 0].scatter(x, y, s=80, c=z, marker=(5, 0))
axs[1, 0].set_title("marker=(5, 0)")

# regular 5-pointed star marker
axs[1, 1].scatter(x, y, s=80, c=z, marker=(5, 1))
axs[1, 1].set_title("marker=(5, 1)")

# regular 5-pointed asterisk marker
axs[1, 2].scatter(x, y, s=80, c=z, marker=(5, 2))
axs[1, 2].set_title("marker=(5, 2)")

plt.show()
Python 3.11.6 (matplotlib 3.7.1) 及び Python 3.12.0 (matplotlib 3.8.1) 共に、正常実行です。

- 参照ページ
pylab_examples_Examples code: scatter_star_poly.py
lines-bars-and-markers-scatter-star-poly-py
- リリースノート
- 2023/12/05 Ver=1.04 Python 3.12.0 (matplotlib 3.8.1)で確認
- 2023/12/05 Ver=1.04 Python 3.11.6 (matplotlib 3.7.1)で確認
- 2023/04/04 Ver=1.03 Python 3.11.2 で確認
- 2020/11/01 Ver=1.01 Python 3.7.8 で確認
- 2018/12/04 Ver=1.01 初版リリース
- 関連ページ