|
|
pylab_examples_Examples 59_scatter_custom_symbol. |
H.Kamifuji . |
- scatter_custom_symbol.py
import matplotlib.pyplot as plt
from numpy import arange, pi, cos, sin
from numpy.random import rand

# unit area ellipse
rx, ry = 3., 1.
area = rx * ry * pi
theta = arange(0, 2*pi + 0.01, 0.1)
verts = list(zip(rx/area*cos(theta), ry/area*sin(theta)))

x, y, s, c = rand(4, 30)
s *= 10**2.

fig, ax = plt.subplots()
ax.scatter(x, y, s, c, marker=None, verts=verts)

plt.show()
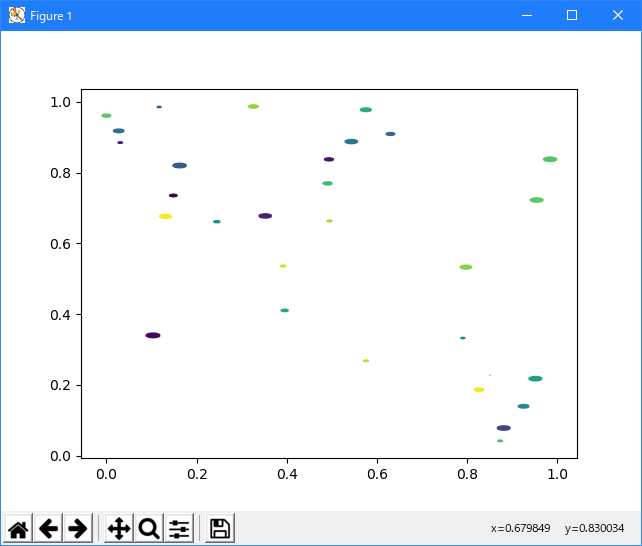
- 実行結果( scatter_custom_symbol.png )
Python 3.11.2 見直しました。上記のコードでは、下記のエラーが発生します。
Traceback (most recent call last):
File "_:\scatter_custom_symbol.py", line 15, in <module>
ax.scatter(x, y, s, c, marker=None, verts=verts)
File "C:\Users\_____\AppData\Local\Programs\Python\Python311\Lib\site-packages\matplotlib\__init__.py", line 1459, in inner
return func(ax, *map(sanitize_sequence, args), **kwargs)
^^^^^^^^^^^^^^^^^^^^^^^^^^^^^^^^^^^^^^^^^^^^^^^^^
File "C:\Users\_____\AppData\Local\Programs\Python\Python311\Lib\site-packages\matplotlib\axes\_axes.py", line 4698, in scatter
collection._internal_update(kwargs)
File "C:\Users\_____\AppData\Local\Programs\Python\Python311\Lib\site-packages\matplotlib\artist.py", line 1223, in _internal_update
return self._update_props(
^^^^^^^^^^^^^^^^^^^
File "C:\Users\_____\AppData\Local\Programs\Python\Python311\Lib\site-packages\matplotlib\artist.py", line 1197, in _update_props
raise AttributeError(
AttributeError: PathCollection.set() got an unexpected keyword argument 'verts'
matplotlib 内部のエラーのようです。matplotlib の改修(先祖帰りバグの改修)を待つしかない。
Python 3.11.6 (matplotlib 3.7.1) では、下記のようなエラーがあり、実行できない。
Traceback (most recent call last): File "M:\______\scatter_custom_symbol.py", line 15, in
Python 3.12.0 (matplotlib 3.8.1) では、下記のようなエラーがあり、実行できない。ax.scatter(x, y, s, c, marker=None, verts=verts) File "C:\Users\______\AppData\Local\Programs\Python\Python311\Lib \site-packages\matplotlib\__init__.py", line 1459, in inner return func(ax, *map(sanitize_sequence, args), **kwargs) ^^^^^^^^^^^^^^^^^^^^^^^^^^^^^^^^^^^^^^^^^^^^^^^^^ File "C:\Users\______\AppData\Local\Programs\Python\Python311\Lib \site-packages\matplotlib\axes\_axes.py", line 4698, in scatter collection._internal_update(kwargs) File "C:\Users\______\AppData\Local\Programs\Python\Python311\Lib \site-packages\matplotlib\artist.py", line 1223, in _internal_update return self._update_props( ^^^^^^^^^^^^^^^^^^^ File "C:\Users\______\AppData\Local\Programs\Python\Python311\Lib \site-packages\matplotlib\artist.py", line 1197, in _update_props raise AttributeError( AttributeError: PathCollection.set() got an unexpected keyword argument 'verts'
Traceback (most recent call last): File "E:\______\scatter_custom_symbol.py", line 15, in
Python 3.11.6 (matplotlib 3.7.1) 及び Python 3.12.0 (matplotlib 3.8.1) 共に、キーワード verts が無いと言われているので、verts を削除してみました。ax.scatter(x, y, s, c, marker=None, verts=verts) File "C:\Program Files\Python312\Lib\site-packages\matplotlib\__init__.py", line 1478, in inner return func(ax, *map(sanitize_sequence, args), **kwargs) ^^^^^^^^^^^^^^^^^^^^^^^^^^^^^^^^^^^^^^^^^^^^^^^^^ File "C:\Program Files\Python312\Lib\site-packages\matplotlib\axes\_axes.py", line 4766, in scatter collection._internal_update(kwargs) File "C:\Program Files\Python312\Lib\site-packages\matplotlib\artist.py", line 1219, in _internal_update return self._update_props( ^^^^^^^^^^^^^^^^^^^ File "C:\Program Files\Python312\Lib\site-packages\matplotlib\artist.py", line 1193, in _update_props raise AttributeError( AttributeError: PathCollection.set() got an unexpected keyword argument 'verts'
import matplotlib.pyplot as plt
from numpy import arange, pi, cos, sin
from numpy.random import rand

# unit area ellipse
rx, ry = 3., 1.
area = rx * ry * pi
theta = arange(0, 2*pi + 0.01, 0.1)
verts = list(zip(rx/area*cos(theta), ry/area*sin(theta)))

x, y, s, c = rand(4, 30)
s *= 10**2.

fig, ax = plt.subplots()
ax.scatter(x, y, s, c, marker=None)

plt.show()
Python 3.11.6 (matplotlib 3.7.1) 及び Python 3.12.0 (matplotlib 3.8.1) 共に、正常実行です。
上記は、marker=None と指定されているため、ディフォルトの marker='o' と解釈されたようです。
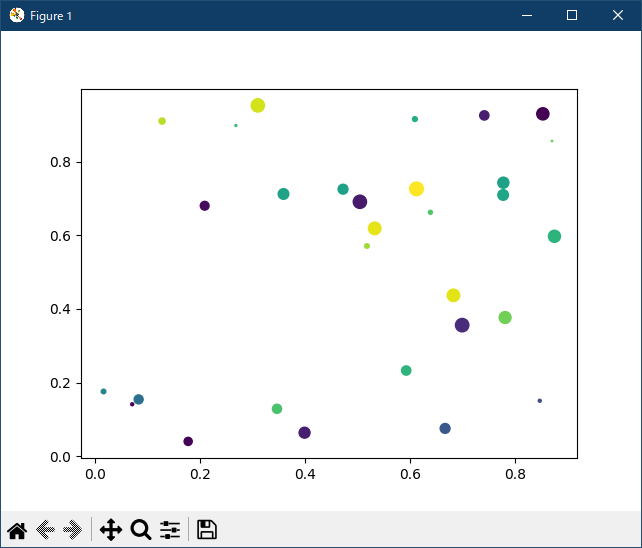
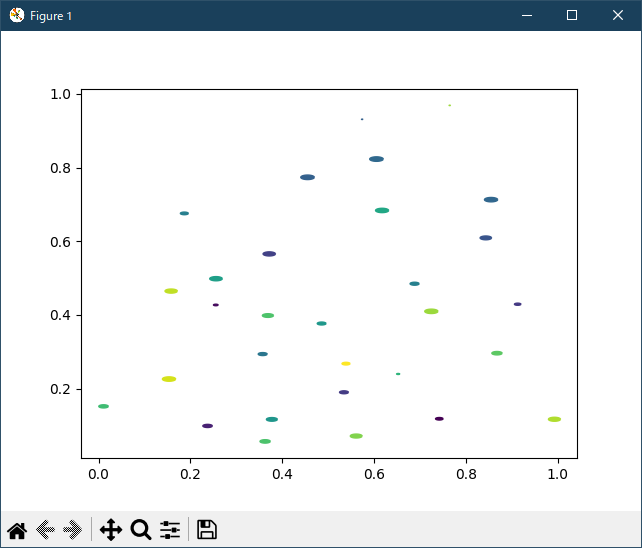
8 行目の verts = list(zip(rx/area*cos(theta), ry/area*sin(theta))) は、Path データのようです。そこで、marker=verts と指定してみました(matplotlib.pyplot.scatter および module-matplotlib.markers を参照)。
import matplotlib.pyplot as plt
from numpy import arange, pi, cos, sin
from numpy.random import rand

# unit area ellipse
rx, ry = 3., 1.
area = rx * ry * pi
theta = arange(0, 2*pi + 0.01, 0.1)
verts = list(zip(rx/area*cos(theta), ry/area*sin(theta)))

x, y, s, c = rand(4, 30)
s *= 10**2.

fig, ax = plt.subplots()
ax.scatter(x, y, s, c, marker=verts)

plt.show()
Python 3.11.6 (matplotlib 3.7.1) 及び Python 3.12.0 (matplotlib 3.8.1) 共に、正常実行です。楕円のマークになりました。大成功!!
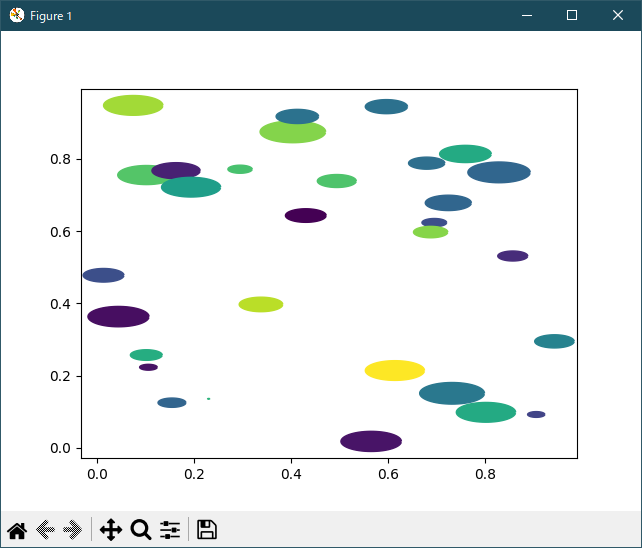
少し、マークを大きくしてみました。
import matplotlib.pyplot as plt
from numpy import arange, pi, cos, sin
from numpy.random import rand

# unit area ellipse
rx, ry = 3., 1.
area = rx * ry * pi
theta = arange(0, 2*pi + 0.01, 0.1)
verts = list(zip(rx/area*cos(theta), ry/area*sin(theta)))

x, y, s, c = rand(4, 30)
s *= 50**2.

fig, ax = plt.subplots()
ax.scatter(x, y, s, c, marker=verts)

plt.show()
Python 3.11.6 (matplotlib 3.7.1) 及び Python 3.12.0 (matplotlib 3.8.1) 共に、正常実行です。
- 参照ページ
pylab_examples_Examples code: scatter_custom_symbol.py
matplotlib.pyplot.scatter
module-matplotlib.markers
- リリースノート
- 2023/12/04 Ver=1.04 Python 3.12.0 (matplotlib 3.8.1)で確認
- 2023/12/04 Ver=1.04 Python 3.11.6 (matplotlib 3.7.1)で確認
- 2023/04/04 Ver=1.03 Python 3.11.2 で確認
- 2020/11/01 Ver=1.01 Python 3.7.8 で確認
- 2018/12/04 Ver=1.01 初版リリース
- 関連ページ