|
|
pylab_examples_Examples 48_polar_demo. |
H.Kamifuji . |
- polar_demo.py
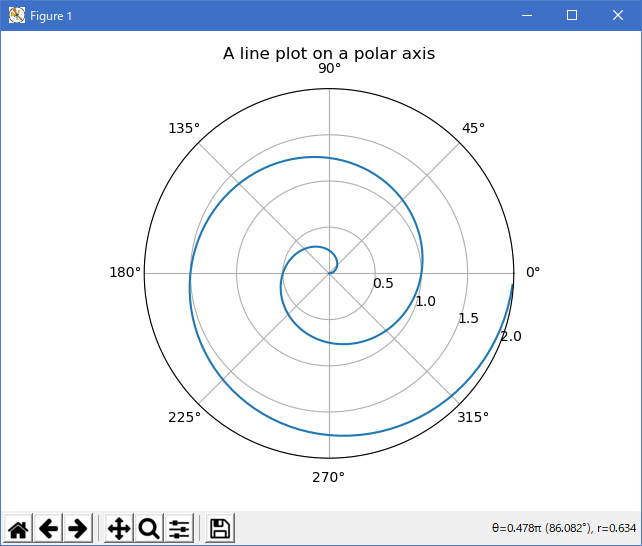
極軸上の線図のデモ。
"""
Demo of a line plot on a polar axis.
"""
import numpy as np
import matplotlib.pyplot as plt


r = np.arange(0, 2, 0.01)
theta = 2 * np.pi * r

ax = plt.subplot(111, projection='polar')
ax.plot(theta, r)
ax.set_rmax(2)
ax.set_rticks([0.5, 1, 1.5, 2])  # less radial ticks
ax.set_rlabel_position(-22.5)  # get radial labels away from plotted line
ax.grid(True)

ax.set_title("A line plot on a polar axis", va='bottom')
plt.show()
- 実行結果( polar_demo.png )
- 参照ページ
pylab_examples_Examples code: polar_demo.py
- リリースノート
- 2023/04/03 Ver=1.03 Python 3.11.2 で確認
- 2020/11/01 Ver=1.01 Python 3.7.8 で確認
- 2018/12/03 Ver=1.01 初版リリース
- 関連ページ