|
|
pylab_examples_Examples 47_plotfile_demo. |
H.Kamifuji . |
- plotfile_demo.py
この事例は、Windows10_1909 で Python 3.9.0 環境では、動作しません。( fname = cbook.get_sample_data('msft.csv', asfileobj=False) が削除されたのか? )
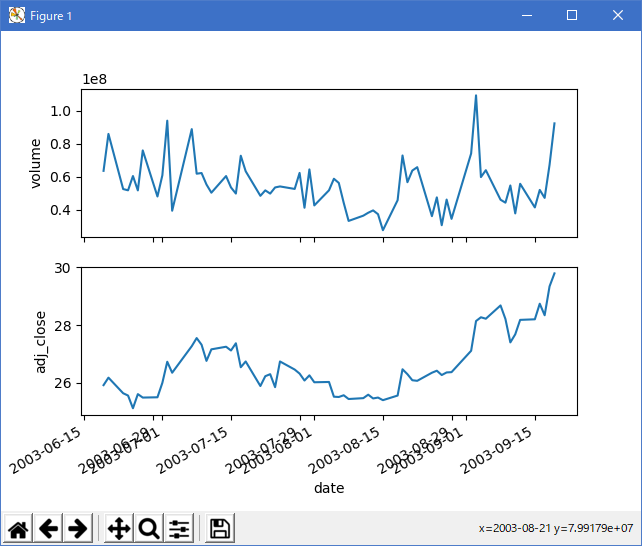
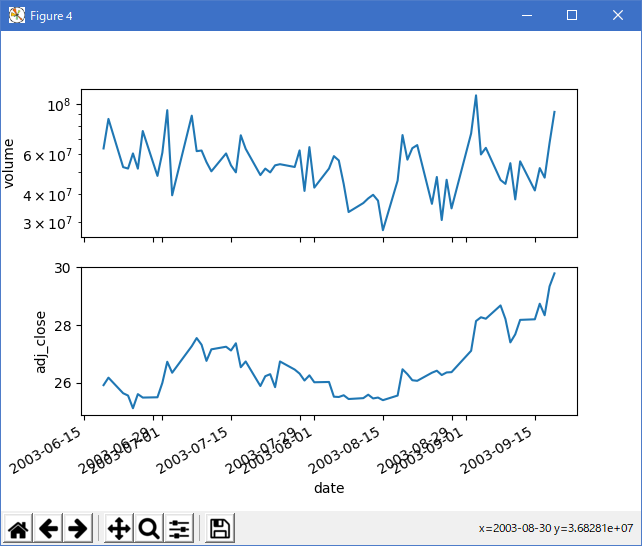
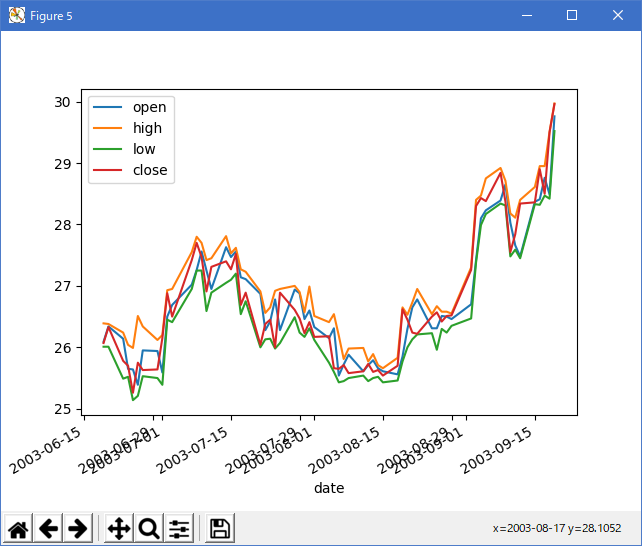
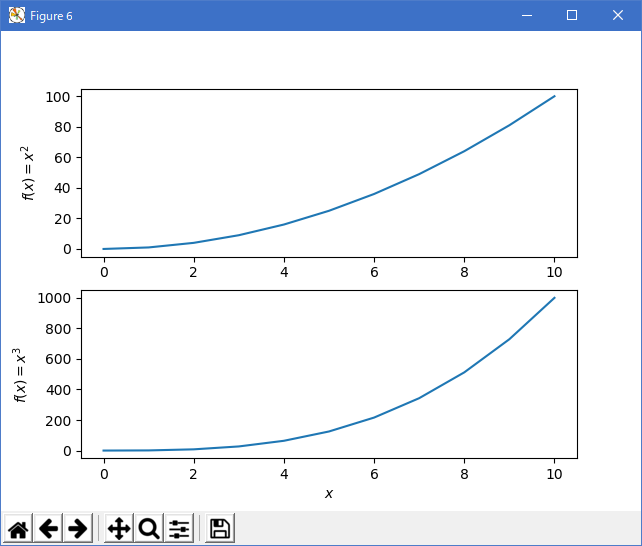
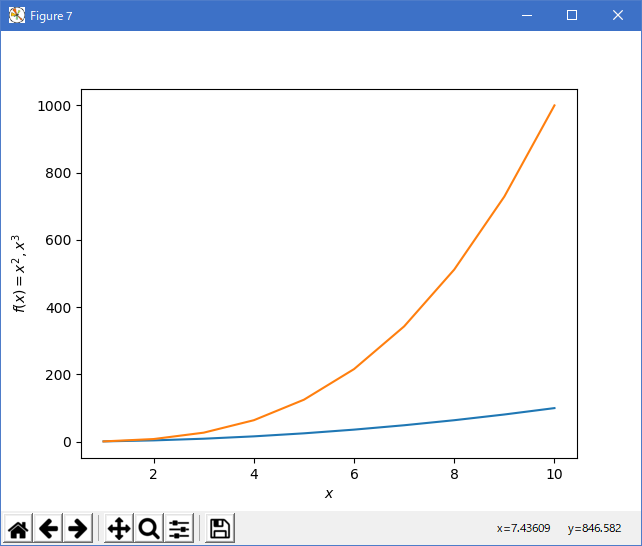
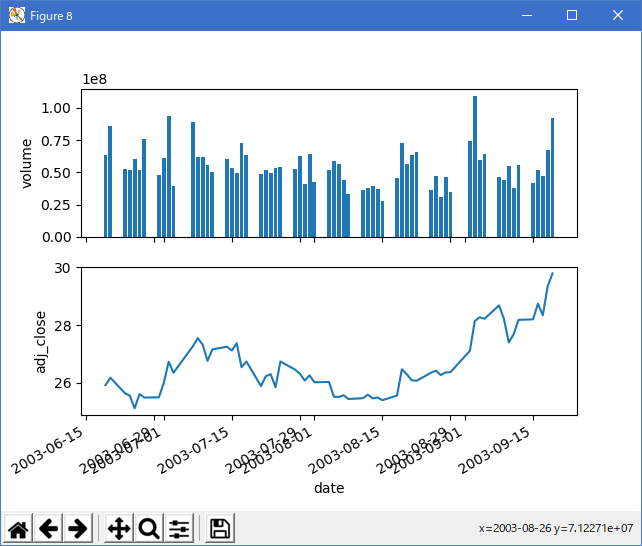
import matplotlib.pyplot as plt
import numpy as np

import matplotlib.cbook as cbook

fname = cbook.get_sample_data('msft.csv', asfileobj=False)
fname2 = cbook.get_sample_data('data_x_x2_x3.csv', asfileobj=False)

# test 1; use ints
plt.plotfile(fname, (0, 5, 6))

# test 2; use names
plt.plotfile(fname, ('date', 'volume', 'adj_close'))

# test 3; use semilogy for volume
plt.plotfile(fname, ('date', 'volume', 'adj_close'),
             plotfuncs={'volume': 'semilogy'})

# test 4; use semilogy for volume
plt.plotfile(fname, (0, 5, 6), plotfuncs={5: 'semilogy'})

# test 5; single subplot
plt.plotfile(fname, ('date', 'open', 'high', 'low', 'close'), subplots=False)

# test 6; labeling, if no names in csv-file
plt.plotfile(fname2, cols=(0, 1, 2), delimiter=' ',
             names=['$x$', '$f(x)=x^2$', '$f(x)=x^3$'])

# test 7; more than one file per figure--illustrated here with a single file
plt.plotfile(fname2, cols=(0, 1), delimiter=' ')
plt.plotfile(fname2, cols=(0, 2), newfig=False,
             delimiter=' ')  # use current figure
plt.xlabel(r'$x$')
plt.ylabel(r'$f(x) = x^2, x^3$')

# test 8; use bar for volume
plt.plotfile(fname, (0, 5, 6), plotfuncs={5: 'bar'})

plt.show()
- 実行結果( plotfile_demo.png )


Python 3.11.2 見直しました。上記のコードでは、下記のエラーが発生します。
Traceback (most recent call last):
File "_:\plotfile_demo.py", line 10, in <module>
plt.plotfile(fname, (0, 5, 6))
^^^^^^^^^^^^
AttributeError: module 'matplotlib.pyplot' has no attribute 'plotfile'
matplotlib 内部のエラーのようです。matplotlib の改修(先祖帰りバグの改修)を待つしかない。
Python 3.11.6 (matplotlib 3.7.1) では、下記のようなエラーがあり、実行できない。
Traceback (most recent call last): File "M:\______\plotfile_demo.py", line 10, in
Python 3.12.0 (matplotlib 3.8.1) では、下記のようなエラーがあり、実行できない。plt.plotfile(fname, (0, 5, 6)) ^^^^^^^^^^^^ AttributeError: module 'matplotlib.pyplot' has no attribute 'plotfile'
Traceback (most recent call last): File "E:\______\plotfile_demo.py", line 10, in
matplotlib 3.8.1 で、API リファレンス(pyplot_summary) によると plotfile は、見つからない。前のサンプル(18_loadrec) を、参考に汎用関数を作成するか、個々に対応することを推奨します。plt.plotfile(fname, (0, 5, 6)) ^^^^^^^^^^^^ AttributeError: module 'matplotlib.pyplot' has no attribute 'plotfile'
後程、個々に対応事例を作成して、勉強!
- 参照ページ
pylab_examples_Examples code: plotfile_demo.py
pyplot_summary
18_loadrec
- リリースノート
- 2023/12/03 Ver=1.04 Python 3.12.0 (matplotlib 3.8.1)で確認
- 2023/12/03 Ver=1.04 Python 3.11.6 (matplotlib 3.7.1)で確認
- 2023/04/03 Ver=1.03 Python 3.11.2 で確認
- 2020/11/01 Ver=1.01 Python 3.7.8 で確認
- 2018/12/03 Ver=1.01 初版リリース
- 関連ページ