|
|
pylab_examples_Examples 28_masked_demo. |
H.Kamifuji . |
- masked_demo.py
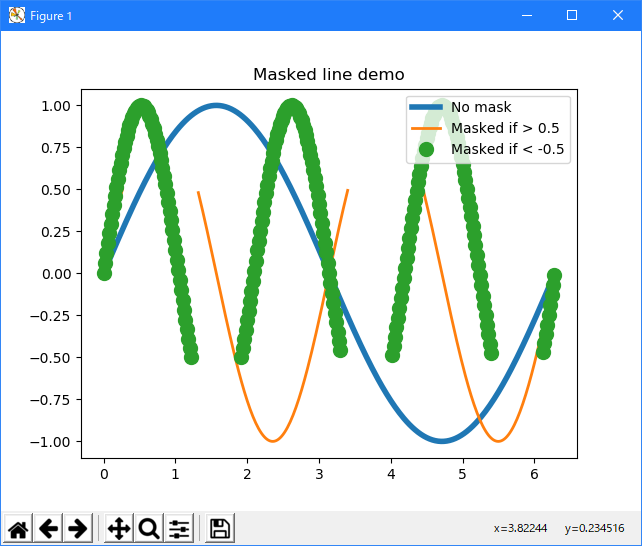
点をマスクした線をプロットします。
これは典型的にはギャップのあるデータで使用され、データギャップでラインを破壊する。
'''
Plot lines with points masked out.

This would typically be used with gappy data, to
break the line at the data gaps.
'''

import matplotlib.pyplot as plt
import numpy as np

x = np.arange(0, 2*np.pi, 0.02)
y = np.sin(x)
y1 = np.sin(2*x)
y2 = np.sin(3*x)
ym1 = np.ma.masked_where(y1 > 0.5, y1)
ym2 = np.ma.masked_where(y2 < -0.5, y2)

lines = plt.plot(x, y, x, ym1, x, ym2, 'o')
plt.setp(lines[0], linewidth=4)
plt.setp(lines[1], linewidth=2)
plt.setp(lines[2], markersize=10)

plt.legend(('No mask', 'Masked if > 0.5', 'Masked if < -0.5'),
           loc='upper right')
plt.title('Masked line demo')
plt.show()
- 実行結果( masked_demo.png )
- 参照ページ
pylab_examples_Examples code: masked_demo.py
- リリースノート
- 2023/04/03 Ver=1.03 Python 3.11.2 で確認
- 2020/11/01 Ver=1.01 Python 3.7.8 で確認
- 2018/12/03 Ver=1.01 初版リリース
- 関連ページ