|
|
pylab_examples_Examples 20_log_demo. |
H.Kamifuji . |
- log_demo.py
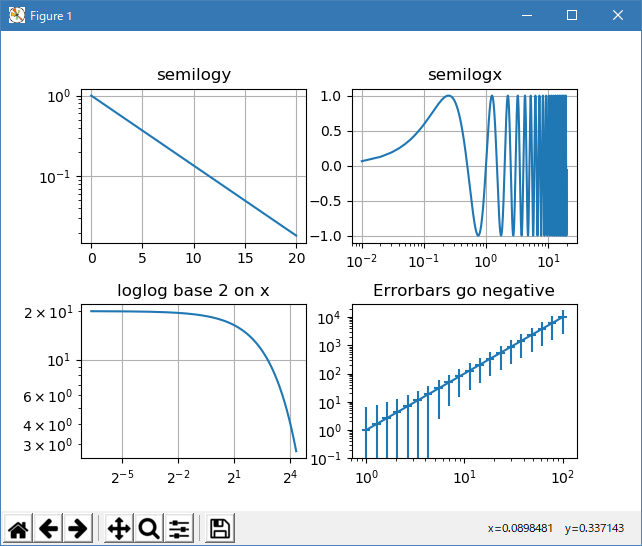
import numpy as np
import matplotlib.pyplot as plt

plt.subplots_adjust(hspace=0.4)
t = np.arange(0.01, 20.0, 0.01)

# log y axis
plt.subplot(221)
plt.semilogy(t, np.exp(-t/5.0))
plt.title('semilogy')
plt.grid(True)

# log x axis
plt.subplot(222)
plt.semilogx(t, np.sin(2*np.pi*t))
plt.title('semilogx')
plt.grid(True)

# log x and y axis
plt.subplot(223)
plt.loglog(t, 20*np.exp(-t/10.0), basex=2)
plt.grid(True)
plt.title('loglog base 2 on x')

# with errorbars: clip non-positive values
ax = plt.subplot(224)
ax.set_xscale("log", nonposx='clip')
ax.set_yscale("log", nonposy='clip')

x = 10.0**np.linspace(0.0, 2.0, 20)
y = x**2.0
plt.errorbar(x, y, xerr=0.1*x, yerr=5.0 + 0.75*y)
ax.set_ylim(ymin=0.1)
ax.set_title('Errorbars go negative')

plt.show()
- 実行結果( log_demo.png )
Python 3.11.2 見直しました。上記のコードでは、下記のエラーが発生します。
Traceback (most recent call last):
File "_:\log_demo.py", line 21, in <module>
plt.loglog(t, 20*np.exp(-t/10.0), basex=2)
File "C:\Users\_____\AppData\Local\Programs\Python\Python311\Lib\site-packages\matplotlib\pyplot.py", line 2722, in loglog
return gca().loglog(*args, **kwargs)
^^^^^^^^^^^^^^^^^^^^^^^^^^^^^
File "C:\Users\_____\AppData\Local\Programs\Python\Python311\Lib\site-packages\matplotlib\axes\_axes.py", line 1824, in loglog
self.set_xscale('log', **dx)
File "C:\Users\_____\AppData\Local\Programs\Python\Python311\Lib\site-packages\matplotlib\axes\_base.py", line 74, in wrapper
return get_method(self)(*args, **kwargs)
^^^^^^^^^^^^^^^^^^^^^^^^^^^^^^^^^
File "C:\Users\_____\AppData\Local\Programs\Python\Python311\Lib\site-packages\matplotlib\axis.py", line 810, in _set_axes_scale
ax._axis_map[name]._set_scale(value, **kwargs)
File "C:\Users\_____\AppData\Local\Programs\Python\Python311\Lib\site-packages\matplotlib\axis.py", line 767, in _set_scale
self._scale = mscale.scale_factory(value, self, **kwargs)
^^^^^^^^^^^^^^^^^^^^^^^^^^^^^^^^^^^^^^^^^^^
File "C:\Users\_____\AppData\Local\Programs\Python\Python311\Lib\site-packages\matplotlib\scale.py", line 714, in scale_factory
return scale_cls(axis, **kwargs)
^^^^^^^^^^^^^^^^^^^^^^^^^
TypeError: LogScale.__init__() got an unexpected keyword argument 'basex'
matplotlib 内部のエラーのようです。matplotlib の改修(先祖帰りバグの改修)を待つしかない。
Python 3.11.6 (matplotlib 3.7.1) では、下記のようなエラーがあり、実行できない。
Traceback (most recent call last): File "M:\______\log_demo.py", line 21, in
Python 3.12.0 (matplotlib 3.8.1) では、下記のようなエラーがあり、実行できない。plt.loglog(t, 20*np.exp(-t/10.0), basex=2) File "C:\Users\______\AppData\Local\Programs\Python\Python311\Lib \site-packages\matplotlib\pyplot.py", line 2722, in loglog return gca().loglog(*args, **kwargs) ^^^^^^^^^^^^^^^^^^^^^^^^^^^^^ File "C:\Users\______\AppData\Local\Programs\Python\Python311\Lib \site-packages\matplotlib\axes\_axes.py", line 1824, in loglog self.set_xscale('log', **dx) File "C:\Users\______\AppData\Local\Programs\Python\Python311\Lib \site-packages\matplotlib\axes\_base.py", line 74, in wrapper return get_method(self)(*args, **kwargs) ^^^^^^^^^^^^^^^^^^^^^^^^^^^^^^^^^ File "C:\Users\______\AppData\Local\Programs\Python\Python311\Lib \site-packages\matplotlib\axis.py", line 810, in _set_axes_scale ax._axis_map[name]._set_scale(value, **kwargs) File "C:\Users\______\AppData\Local\Programs\Python\Python311\Lib \site-packages\matplotlib\axis.py", line 767, in _set_scale self._scale = mscale.scale_factory(value, self, **kwargs) ^^^^^^^^^^^^^^^^^^^^^^^^^^^^^^^^^^^^^^^^^^^ File "C:\Users\______\AppData\Local\Programs\Python\Python311\Lib \site-packages\matplotlib\scale.py", line 714, in scale_factory return scale_cls(axis, **kwargs) ^^^^^^^^^^^^^^^^^^^^^^^^^ TypeError: LogScale.__init__() got an unexpected keyword argument 'basex'
Traceback (most recent call last): File "E:\______\log_demo.py", line 21, in
Python 3.11.6 (matplotlib 3.7.1) 及び Python 3.12.0 (matplotlib 3.8.1) で、見直し中、新しいサンプル( scales-log-demo-py ) を見つけ、下記のコードで、正常に実行できました。plt.loglog(t, 20*np.exp(-t/10.0), basex=2) File "C:\Program Files\Python312\Lib\site-packages\matplotlib\pyplot.py", line 3386, in loglog return gca().loglog(*args, **kwargs) ^^^^^^^^^^^^^^^^^^^^^^^^^^^^^ File "C:\Program Files\Python312\Lib\site-packages\matplotlib\axes\_axes.py", line 1857, in loglog self.set_xscale('log', **dx) File "C:\Program Files\Python312\Lib\site-packages\matplotlib\axes\_base.py", line 73, in wrapper return get_method(self)(*args, **kwargs) ^^^^^^^^^^^^^^^^^^^^^^^^^^^^^^^^^ File "C:\Program Files\Python312\Lib\site-packages\matplotlib\axis.py", line 837, in _set_axes_scale ax._axis_map[name]._set_scale(value, **kwargs) File "C:\Program Files\Python312\Lib\site-packages\matplotlib\axis.py", line 796, in _set_scale self._scale = mscale.scale_factory(value, self, **kwargs) ^^^^^^^^^^^^^^^^^^^^^^^^^^^^^^^^^^^^^^^^^^^ File "C:\Program Files\Python312\Lib\site-packages\matplotlib\scale.py", line 717, in scale_factory return scale_cls(axis, **kwargs) ^^^^^^^^^^^^^^^^^^^^^^^^^ TypeError: LogScale.__init__() got an unexpected keyword argument 'basex'
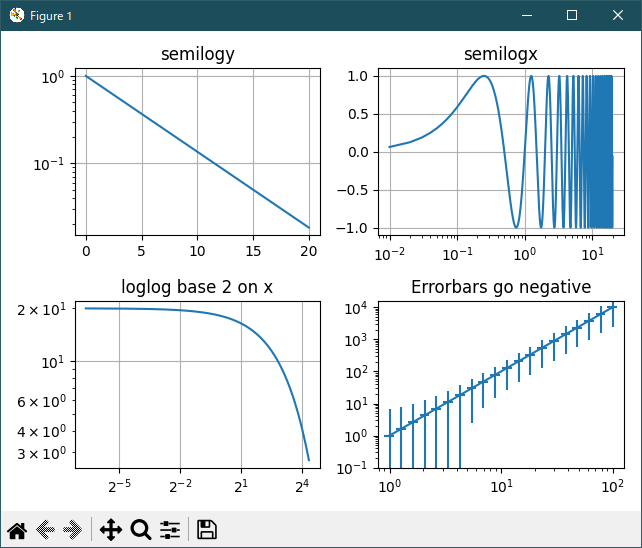
"""
========
Log Demo
========

Examples of plots with logarithmic axes.
"""

import matplotlib.pyplot as plt
import numpy as np

# Data for plotting
t = np.arange(0.01, 20.0, 0.01)

# Create figure
fig, ((ax1, ax2), (ax3, ax4)) = plt.subplots(2, 2)

# log y axis
ax1.semilogy(t, np.exp(-t / 5.0))
ax1.set(title='semilogy')
ax1.grid()

# log x axis
ax2.semilogx(t, np.sin(2 * np.pi * t))
ax2.set(title='semilogx')
ax2.grid()

# log x and y axis
ax3.loglog(t, 20 * np.exp(-t / 10.0))
ax3.set_xscale('log', base=2)
ax3.set(title='loglog base 2 on x')
ax3.grid()

# With errorbars: clip non-positive values
# Use new data for plotting
x = 10.0**np.linspace(0.0, 2.0, 20)
y = x**2.0

ax4.set_xscale("log", nonpositive='clip')
ax4.set_yscale("log", nonpositive='clip')
ax4.set(title='Errorbars go negative')
ax4.errorbar(x, y, xerr=0.1 * x, yerr=5.0 + 0.75 * y)
# ylim must be set after errorbar to allow errorbar to autoscale limits
ax4.set_ylim(bottom=0.1)

fig.tight_layout()
plt.show()
Python 3.11.6 (matplotlib 3.7.1) 及び Python 3.12.0 (matplotlib 3.8.1) 共に、正常実行です。
- 参照ページ
pylab_examples_Examples code: log_demo.py
scales-log-demo-py
- リリースノート
- 2023/12/01 Ver=1.04 Python 3.12.0 (matplotlib 3.8.1)で確認
- 2023/12/01 Ver=1.04 Python 3.11.6 (matplotlib 3.7.1)で確認
- 2023/04/03 Ver=1.03 Python 3.11.2 で確認
- 2020/10/31 Ver=1.01 Python 3.7.8 で確認
- 2018/12/03 Ver=1.01 初版リリース
- 関連ページ