|
|
pylab_examples_Examples 07_interp_demo. |
H.Kamifuji . |
- interp_demo.py
この事例は、Windows10_1909 で Python 3.9.0 環境では、動作しません。( from matplotlib.mlab import stineman_interp が削除されたのか? )
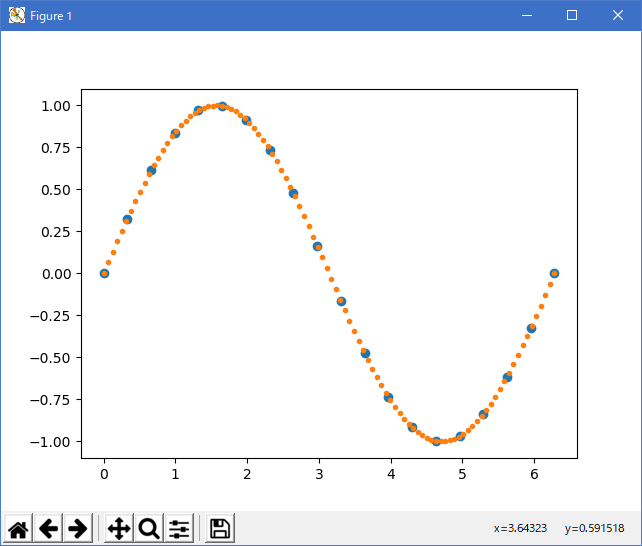
import matplotlib.pyplot as plt
from numpy import pi, sin, linspace
from matplotlib.mlab import stineman_interp

x = linspace(0, 2*pi, 20)
y = sin(x)
yp = None
xi = linspace(x[0], x[-1], 100)
yi = stineman_interp(xi, x, y, yp)

fig, ax = plt.subplots()
ax.plot(x, y, 'o', xi, yi, '.')
plt.show()
- 実行結果( interp_demo.png )
Python 3.11.2 見直しました。上記のコードでは、下記のエラーが発生します。
Traceback (most recent call last):
File "_:\interp_demo.py", line 3, in <module>
from matplotlib.mlab import stineman_interp
ImportError: cannot import name 'stineman_interp' from 'matplotlib.mlab' (C:\Users\kamif\AppData\Local\Programs\Python\Python311\Lib\site-packages\matplotlib\mlab.py)
matplotlib 内部のエラーのようです。matplotlib の改修(先祖帰りバグの改修)を待つしかない。
Python 3.11.6 (matplotlib 3.7.1) では、下記のようなエラーがあり、実行できない。
Traceback (most recent call last): File "M:\______\interp_demo.py", line 3, in
Python 3.12.0 (matplotlib 3.8.1) では、下記のようなエラーがあり、実行できない。from matplotlib.mlab import stineman_interp ImportError: cannot import name 'stineman_interp' from 'matplotlib.mlab' (C:\Users\______\AppData\Local\Programs\Python\Python311\Lib \site-packages\matplotlib\mlab.py)
Traceback (most recent call last): File "E:\______\interp_demo.py", line 3, in
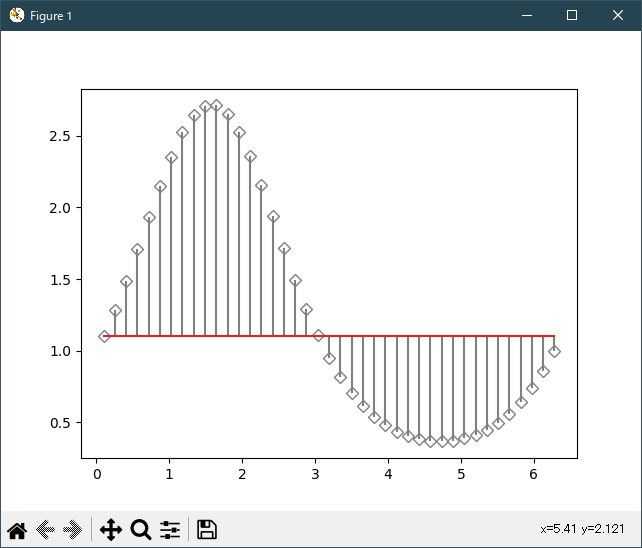
Python 3.11.6 (matplotlib 3.7.1) 及び Python 3.12.0 (matplotlib 3.8.1) で、見直し中、新しいサンプル(似た画像・機能は?)(lines-bars-and-markers-stem-plot-py) を見つけ、下記のコードで、正常に実行できました。from matplotlib.mlab import stineman_interp ImportError: cannot import name 'stineman_interp' from 'matplotlib.mlab' (C:\Program Files\Python312\Lib\site-packages\matplotlib\mlab.py)
stem で、似ていたサンプルです。
"""
=========
Stem Plot
=========

`~.pyplot.stem` plots vertical lines from a baseline to the y-coordinate and
places a marker at the tip.
"""
import matplotlib.pyplot as plt
import numpy as np

x = np.linspace(0.1, 2 * np.pi, 41)
y = np.exp(np.sin(x))

plt.stem(x, y)
plt.show()

# %%
#
# The position of the baseline can be adapted using *bottom*.
# The parameters *linefmt*, *markerfmt*, and *basefmt* control basic format
# properties of the plot. However, in contrast to `~.pyplot.plot` not all
# properties are configurable via keyword arguments. For more advanced
# control adapt the line objects returned by `.pyplot`.

markerline, stemlines, baseline = plt.stem(
    x, y, linefmt='grey', markerfmt='D', bottom=1.1)
markerline.set_markerfacecolor('none')
plt.show()

# %%
#
# .. admonition:: References
#
#    The use of the following functions, methods, classes and modules is shown
#    in this example:
#
#    - `matplotlib.axes.Axes.stem` / `matplotlib.pyplot.stem`
Python 3.11.6 (matplotlib 3.7.1) 及び Python 3.12.0 (matplotlib 3.8.1) 共に、正常実行です。

- 参照ページ
pylab_examples_Examples code: interp_demo.py
lines-bars-and-markers-stem-plot-py
- リリースノート
- 2023/11/26 Ver=1.04 Python 3.12.0 (matplotlib 3.8.1)で確認
- 2023/11/26 Ver=1.04 Python 3.11.6 (matplotlib 3.7.1)で確認
- 2023/04/03 Ver=1.03 Python 3.11.2 で確認
- 2020/10/31 Ver=1.01 Python 3.7.8 で確認
- 2018/12/03 Ver=1.01 初版リリース
- 関連ページ