|
|
pylab_examples_Examples 03_image_masked. |
H.Kamifuji . |
- image_masked.py
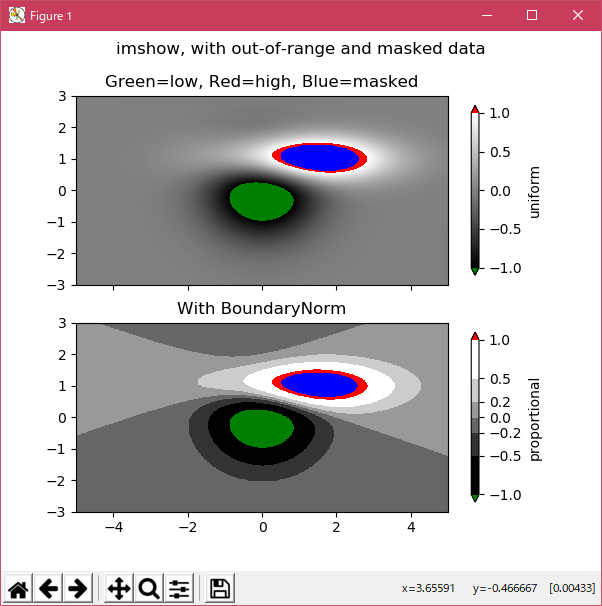
マスクされた配列入力と範囲外の色を持つ imshow 。
2 番目のサブプロットは、BoundaryNorm を使用して塗りつぶした輪郭効果を得る方法を示しています。
この事例は、Windows10_1909 で Python 3.9.0 環境では、動作しません。( Z1 = mlab.bivariate_normal(X, Y, 1.0, 1.0, 0.0, 0.0) がデグレートしたのか? )
"""
imshow with masked array input and out-of-range colors.

The second subplot illustrates the use of BoundaryNorm to
get a filled contour effect.
"""
from copy import copy

import numpy as np
import matplotlib.pyplot as plt
import matplotlib.colors as colors
import matplotlib.mlab as mlab

# compute some interesting data
x0, x1 = -5, 5
y0, y1 = -3, 3
x = np.linspace(x0, x1, 500)
y = np.linspace(y0, y1, 500)
X, Y = np.meshgrid(x, y)
Z1 = mlab.bivariate_normal(X, Y, 1.0, 1.0, 0.0, 0.0)
Z2 = mlab.bivariate_normal(X, Y, 1.5, 0.5, 1, 1)
Z = 10*(Z2 - Z1)  # difference of Gaussians

# Set up a colormap:
# use copy so that we do not mutate the global colormap instance
palette = copy(plt.cm.gray)
palette.set_over('r', 1.0)
palette.set_under('g', 1.0)
palette.set_bad('b', 1.0)
# Alternatively, we could use
# palette.set_bad(alpha = 0.0)
# to make the bad region transparent.  This is the default.
# If you comment out all the palette.set* lines, you will see
# all the defaults; under and over will be colored with the
# first and last colors in the palette, respectively.
Zm = np.ma.masked_where(Z > 1.2, Z)

# By setting vmin and vmax in the norm, we establish the
# range to which the regular palette color scale is applied.
# Anything above that range is colored based on palette.set_over, etc.

# set up the axes
fig, (ax1, ax2) = plt.subplots(nrows=2, figsize=(6, 5.4))

# plot using 'continuous' color map
im = ax1.imshow(Zm, interpolation='bilinear',
                cmap=palette,
                norm=colors.Normalize(vmin=-1.0, vmax=1.0),
                aspect='auto',
                origin='lower',
                extent=[x0, x1, y0, y1])
ax1.set_title('Green=low, Red=high, Blue=masked')
cbar = fig.colorbar(im, extend='both', shrink=0.9, ax=ax1)
cbar.set_label('uniform')
for ticklabel in ax1.xaxis.get_ticklabels():
    ticklabel.set_visible(False)

# Plot using a small number of colors, with unevenly spaced boundaries.
im = ax2.imshow(Zm, interpolation='nearest',
                cmap=palette,
                norm=colors.BoundaryNorm([-1, -0.5, -0.2, 0, 0.2, 0.5, 1],
                                         ncolors=palette.N),
                aspect='auto',
                origin='lower',
                extent=[x0, x1, y0, y1])
ax2.set_title('With BoundaryNorm')
cbar = fig.colorbar(im, extend='both', spacing='proportional',
                    shrink=0.9, ax=ax2)
cbar.set_label('proportional')

fig.suptitle('imshow, with out-of-range and masked data')
plt.show()
- 実行結果( image_masked.png )
Python 3.11.2 見直しました。上記のコードでは、下記のエラーが発生します。
Traceback (most recent call last):
File "_:\image_masked.py", line 20, in <module>
Z1 = mlab.bivariate_normal(X, Y, 1.0, 1.0, 0.0, 0.0)
^^^^^^^^^^^^^^^^^^^^^
AttributeError: module 'matplotlib.mlab' has no attribute 'bivariate_normal'
matplotlib 内部のエラーのようです。matplotlib の改修(先祖帰りバグの改修)を待つしかない。
Python 3.11.6 (matplotlib 3.7.1) では、下記のようなエラーがあり、実行できない。
Traceback (most recent call last): File "M:\______\image_masked.py", line 20, in
Python 3.12.0 (matplotlib 3.8.1) では、下記のようなエラーがあり、実行できない。Z1 = mlab.bivariate_normal(X, Y, 1.0, 1.0, 0.0, 0.0) ^^^^^^^^^^^^^^^^^^^^^ AttributeError: module 'matplotlib.mlab' has no attribute 'bivariate_normal'
Traceback (most recent call last): File "E:\______\image_masked.py", line 20, in
Python 3.11.6 (matplotlib 3.7.1) 及び Python 3.12.0 (matplotlib 3.8.1) で、見直し中、新しいサンプル(images-contours-and-fields-image-masked-py) を見つけ、下記のコードで、正常に実行できました。Z1 = mlab.bivariate_normal(X, Y, 1.0, 1.0, 0.0, 0.0) ^^^^^^^^^^^^^^^^^^^^^ AttributeError: module 'matplotlib.mlab' has no attribute 'bivariate_normal'
"""
============
Image Masked
============

imshow with masked array input and out-of-range colors.

The second subplot illustrates the use of BoundaryNorm to
get a filled contour effect.
"""

import matplotlib.pyplot as plt
import numpy as np

import matplotlib.colors as colors

# compute some interesting data
x0, x1 = -5, 5
y0, y1 = -3, 3
x = np.linspace(x0, x1, 500)
y = np.linspace(y0, y1, 500)
X, Y = np.meshgrid(x, y)
Z1 = np.exp(-X**2 - Y**2)
Z2 = np.exp(-(X - 1)**2 - (Y - 1)**2)
Z = (Z1 - Z2) * 2

# Set up a colormap:
palette = plt.cm.gray.with_extremes(over='r', under='g', bad='b')
# Alternatively, we could use
# palette.set_bad(alpha = 0.0)
# to make the bad region transparent.  This is the default.
# If you comment out all the palette.set* lines, you will see
# all the defaults; under and over will be colored with the
# first and last colors in the palette, respectively.
Zm = np.ma.masked_where(Z > 1.2, Z)

# By setting vmin and vmax in the norm, we establish the
# range to which the regular palette color scale is applied.
# Anything above that range is colored based on palette.set_over, etc.

# set up the Axes objects
fig, (ax1, ax2) = plt.subplots(nrows=2, figsize=(6, 5.4))

# plot using 'continuous' colormap
im = ax1.imshow(Zm, interpolation='bilinear',
                cmap=palette,
                norm=colors.Normalize(vmin=-1.0, vmax=1.0),
                aspect='auto',
                origin='lower',
                extent=[x0, x1, y0, y1])
ax1.set_title('Green=low, Red=high, Blue=masked')
cbar = fig.colorbar(im, extend='both', shrink=0.9, ax=ax1)
cbar.set_label('uniform')
ax1.tick_params(axis='x', labelbottom=False)

# Plot using a small number of colors, with unevenly spaced boundaries.
im = ax2.imshow(Zm, interpolation='nearest',
                cmap=palette,
                norm=colors.BoundaryNorm([-1, -0.5, -0.2, 0, 0.2, 0.5, 1],
                                         ncolors=palette.N),
                aspect='auto',
                origin='lower',
                extent=[x0, x1, y0, y1])
ax2.set_title('With BoundaryNorm')
cbar = fig.colorbar(im, extend='both', spacing='proportional',
                    shrink=0.9, ax=ax2)
cbar.set_label('proportional')

fig.suptitle('imshow, with out-of-range and masked data')
plt.show()

# %%
#
# .. admonition:: References
#
#    The use of the following functions, methods, classes and modules is shown
#    in this example:
#
#    - `matplotlib.axes.Axes.imshow` / `matplotlib.pyplot.imshow`
#    - `matplotlib.figure.Figure.colorbar` / `matplotlib.pyplot.colorbar`
#    - `matplotlib.colors.BoundaryNorm`
#    - `matplotlib.colorbar.Colorbar.set_label`
Python 3.11.6 (matplotlib 3.7.1) 及び Python 3.12.0 (matplotlib 3.8.1) 共に、正常実行です。

- 参照ページ
pylab_examples_Examples code: image_masked.py
images-contours-and-fields-image-masked-py
- リリースノート
- 2023/11/26 Ver=1.04 Python 3.12.0 (matplotlib 3.8.1)で確認
- 2023/11/26 Ver=1.04 Python 3.11.6 (matplotlib 3.7.1)で確認
- 2023/04/02 Ver=1.03 Python 3.11.2 で確認
- 2020/10/31 Ver=1.01 Python 3.7.8 で確認
- 2018/12/03 Ver=1.01 初版リリース
- 関連ページ