|

|
pylab_examples_Examples 02_image_interp. |
H.Kamifuji . |
- image_interp.py
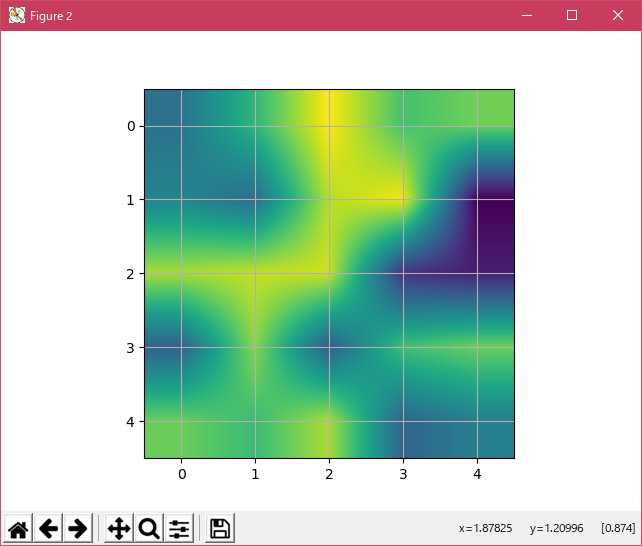
3 つの異なる補間方法で補間された同じ(小さい)配列。
A[i、j] におけるピクセルの中心は、i + 0.5、i + 0.5 でプロットされる。 interpolation = 'nearest' を使用している場合、(i、j)と(i + 1、j + 1)で囲まれた領域は同じ色になります。 補間を使用している場合、ピクセル中心は最も近いものと同じ色になりますが、他のピクセルは隣接するピクセル間で補間されます。
それ以前のバージョンの matplotlib(<0.63)では、表示制限が表示されないように設定することで、エッジ効果を非表示にしようとしました。 最近の antigrain のバグ修正と、この修正を利用する matplotlib._image モジュールの新しい実装は、もはやこれを必要としません。 エッジ効果を防>ぐために、補間を行うときに、matplotlib._image モジュールは、入力配列をエッジのまわりの同じピクセルでパディングします。 たとえば、次のように色が a?y の 5×5 の配列がある場合
  a b c d e
  f g h i j
  k l m n o
  p q r s t
  u v w x y
_image モジュールは埋め込み配列を作成し、
   a a b c d e e
   a a b c d e e
   f f g h i j j
   k k l m n o o
   p p q r s t t
   o u v w x y y
   o u v w x y y
interpolation/resizing を行い、中央領域を抽出する。 これにより、あなたのアレイのエッジエフェクトの全範囲をプロットすることができます。例えば、異なる補間方法で異なるサイズの複数の画像をレイヤー化することができます - examples / layer_images.py を参照してください。 この新しい一時的なパッド付き配列を作成する必要があるため、パフォーマンスヒットも意味します。 洗練された補間はパフォーマンスヒットを意味するため、最大限のパフォーマンスが必要な場合や非常に大きな画像を使用する場合は、interpolation = 'nearest' が推奨されます。
"""
The same (small) array, interpolated with three different
interpolation methods.

The center of the pixel at A[i,j] is plotted at i+0.5, i+0.5.  If you
are using interpolation='nearest', the region bounded by (i,j) and
(i+1,j+1) will have the same color.  If you are using interpolation,
the pixel center will have the same color as it does with nearest, but
other pixels will be interpolated between the neighboring pixels.

Earlier versions of matplotlib (<0.63) tried to hide the edge effects
from you by setting the view limits so that they would not be visible.
A recent bugfix in antigrain, and a new implementation in the
matplotlib._image module which takes advantage of this fix, no longer
makes this necessary.  To prevent edge effects, when doing
interpolation, the matplotlib._image module now pads the input array
with identical pixels around the edge.  e.g., if you have a 5x5 array
with colors a-y as below


  a b c d e
  f g h i j
  k l m n o
  p q r s t
  u v w x y

the _image module creates the padded array,

  a a b c d e e
  a a b c d e e
  f f g h i j j
  k k l m n o o
  p p q r s t t
  o u v w x y y
  o u v w x y y

does the interpolation/resizing, and then extracts the central region.
This allows you to plot the full range of your array w/o edge effects,
and for example to layer multiple images of different sizes over one
another with different interpolation methods - see
examples/layer_images.py.  It also implies a performance hit, as this
new temporary, padded array must be created.  Sophisticated
interpolation also implies a performance hit, so if you need maximal
performance or have very large images, interpolation='nearest' is
suggested.

"""
import matplotlib.pyplot as plt
import numpy as np

A = np.random.rand(5, 5)
plt.figure(1)
plt.imshow(A, interpolation='nearest')
plt.grid(True)

plt.figure(2)
plt.imshow(A, interpolation='bilinear')
plt.grid(True)

plt.figure(3)
plt.imshow(A, interpolation='bicubic')
plt.grid(True)

plt.show()
- 実行結果( image_interp.png )


- 参照ページ
pylab_examples_Examples code: image_interp.py
- リリースノート
- 2026/08/21 Ver=1.04 Windows Python 3.14.6 と Linux Pyson3 3.8.6 で確認
- 2023/04/02 Ver=1.03 Python 3.11.2 で確認
- 2020/10/31 Ver=1.01 Python 3.7.8 で確認
- 2018/12/03 Ver=1.01 初版リリース
- 関連ページ