|
|
pylab_examples_Examples 99_image_clip_path. |
H.Kamifuji . |
- image_clip_path.py
この事例は、Windows10_1909 で Python 3.9.0 環境では、動作しません。( Z1 = mlab.bivariate_normal(X, Y, 1.0, 1.0, 0.0, 0.0) がデグレートしたのか? )
import numpy as np
import matplotlib.cm as cm
import matplotlib.mlab as mlab
import matplotlib.pyplot as plt
from matplotlib.path import Path
from matplotlib.patches import PathPatch

delta = 0.025
x = y = np.arange(-3.0, 3.0, delta)
X, Y = np.meshgrid(x, y)
Z1 = mlab.bivariate_normal(X, Y, 1.0, 1.0, 0.0, 0.0)
Z2 = mlab.bivariate_normal(X, Y, 1.5, 0.5, 1, 1)
Z = Z2 - Z1  # difference of Gaussians

path = Path([[0, 1], [1, 0], [0, -1], [-1, 0], [0, 1]])
patch = PathPatch(path, facecolor='none')
plt.gca().add_patch(patch)

im = plt.imshow(Z, interpolation='bilinear', cmap=cm.gray,
                origin='lower', extent=[-3, 3, -3, 3],
                clip_path=patch, clip_on=True)
im.set_clip_path(patch)

plt.show()
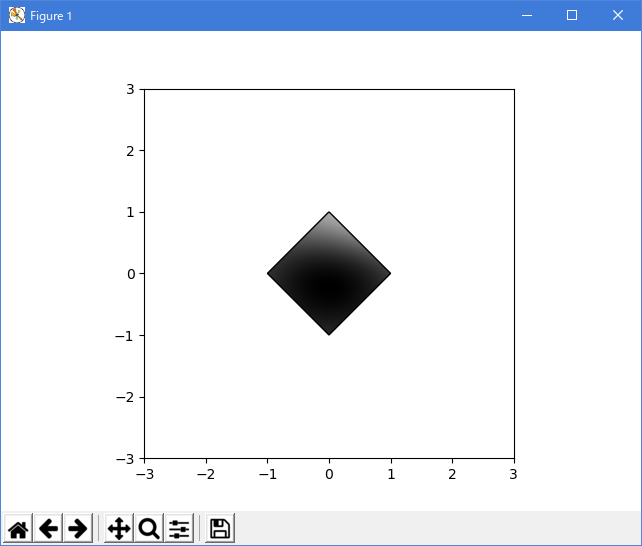
- 実行結果( image_clip_path.png )
Python 3.11.2 見直しました。上記のコードでは、下記のエラーが発生します。
Traceback (most recent call last):
File "_:\image_clip_path.py", line 11, in <module>
Z1 = mlab.bivariate_normal(X, Y, 1.0, 1.0, 0.0, 0.0)
^^^^^^^^^^^^^^^^^^^^^
AttributeError: module 'matplotlib.mlab' has no attribute 'bivariate_normal'
matplotlib 内部のエラーのようです。matplotlib の改修(先祖帰りバグの改修)を待つしかない。
Python 3.11.6 (matplotlib 3.7.1) では、下記のようなエラーがあり、実行できない。
Traceback (most recent call last): File "M:\______\image_clip_path.py", line 11, in
Python 3.12.0 (matplotlib 3.8.1) では、下記のようなエラーがあり、実行できない。Z1 = mlab.bivariate_normal(X, Y, 1.0, 1.0, 0.0, 0.0) ^^^^^^^^^^^^^^^^^^^^^ AttributeError: module 'matplotlib.mlab' has no attribute 'bivariate_normal'
Traceback (most recent call last): File "E:\______\image_clip_path.py", line 11, in
Python 3.11.6 (matplotlib 3.7.1) 及び Python 3.12.0 (matplotlib 3.8.1) で、見直し中、新しいサンプル(images-contours-and-fields-image-clip-path-py) を見つけ、下記のコード( Circle を PathPatch に改修)で、正常に実行できました。Z1 = mlab.bivariate_normal(X, Y, 1.0, 1.0, 0.0, 0.0) ^^^^^^^^^^^^^^^^^^^^^ AttributeError: module 'matplotlib.mlab' has no attribute 'bivariate_normal'
PathPatch については、アプリ・リファレンス( matplotlib.patches.PathPatch) を参照方。
"""
============================
Clipping images with patches
============================

Demo of image that's been clipped by a circular patch.
"""
import matplotlib.pyplot as plt
from matplotlib.path import Path
import matplotlib.cbook as cbook
import matplotlib.patches as patches

with cbook.get_sample_data('grace_hopper.jpg') as image_file:
    image = plt.imread(image_file)

fig, ax = plt.subplots()
im = ax.imshow(image)
# patch = patches.Circle((260, 200), radius=200, transform=ax.transData)
path = Path([[60, 200], [260, 400], [460, 200], [260, 0], [60, 200]])
patch = patches.PathPatch(path, transform=ax.transData)

im.set_clip_path(patch)

ax.axis('off')
plt.show()

# %%
#
# .. admonition:: References
#
#    The use of the following functions, methods, classes and modules is shown
#    in this example:
#
#    - `matplotlib.axes.Axes.imshow` / `matplotlib.pyplot.imshow`
#    - `matplotlib.artist.Artist.set_clip_path`
Python 3.11.6 (matplotlib 3.7.1) 及び Python 3.12.0 (matplotlib 3.8.1) 共に、正常実行です。

- 参照ページ
pylab_examples_Examples code: image_clip_path.py
images-contours-and-fields-image-clip-path-py
matplotlib.patches.PathPatch
- リリースノート
- 2023/11/26 Ver=1.04 Python 3.12.0 (matplotlib 3.8.1)で確認
- 2023/11/26 Ver=1.04 Python 3.11.6 (matplotlib 3.7.1)で確認
- 2023/04/02 Ver=1.03 Python 3.11.2 で確認
- 2020/10/31 Ver=1.01 Python 3.7.8 で確認
- 2018/12/01 Ver=1.01 初版リリース
- 関連ページ