|
|
pylab_examples_Examples 97_histogram_percent_demo. |
H.Kamifuji . |
- histogram_percent_demo.py
この事例は、Windows10_1909 で Python 3.9.0 環境では、動作しません。( 'Rectangle' object has no property 'normed' がデグレートしたのか? )
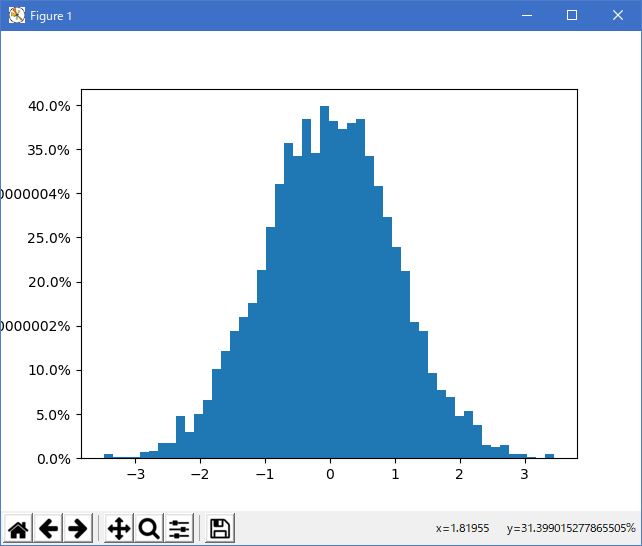
import matplotlib
from numpy.random import randn
import matplotlib.pyplot as plt
from matplotlib.ticker import FuncFormatter


def to_percent(y, position):
    # Ignore the passed in position. This has the effect of scaling the default
    # tick locations.
    s = str(100 * y)

    # The percent symbol needs escaping in latex
    if matplotlib.rcParams['text.usetex'] is True:
        return s + r'$\%$'
    else:
        return s + '%'

x = randn(5000)

# Make a normed histogram. It'll be multiplied by 100 later.
plt.hist(x, bins=50, normed=True)

# Create the formatter using the function to_percent. This multiplies all the
# default labels by 100, making them all percentages
formatter = FuncFormatter(to_percent)

# Set the formatter
plt.gca().yaxis.set_major_formatter(formatter)

plt.show()
- 実行結果( histogram_percent_demo.png )
Python 3.11.2 見直しました。上記のコードでは、下記のエラーが発生します。
Traceback (most recent call last):
File "_:\histogram_percent_demo.py", line 21, in <module>
plt.hist(x, bins=50, normed=True)
File "C:\Users\_____\AppData\Local\Programs\Python\Python311\Lib\site-packages\matplotlib\pyplot.py", line 2645, in hist
return gca().hist(
^^^^^^^^^^^
File "C:\Users\_____\AppData\Local\Programs\Python\Python311\Lib\site-packages\matplotlib\__init__.py", line 1459, in inner
return func(ax, *map(sanitize_sequence, args), **kwargs)
^^^^^^^^^^^^^^^^^^^^^^^^^^^^^^^^^^^^^^^^^^^^^^^^^
File "C:\Users\_____\AppData\Local\Programs\Python\Python311\Lib\site-packages\matplotlib\axes\_axes.py", line 6943, in hist
p._internal_update(kwargs)
File "C:\Users\_____\AppData\Local\Programs\Python\Python311\Lib\site-packages\matplotlib\artist.py", line 1223, in _internal_update
return self._update_props(
^^^^^^^^^^^^^^^^^^^
File "C:\Users\_____\AppData\Local\Programs\Python\Python311\Lib\site-packages\matplotlib\artist.py", line 1197, in _update_props
raise AttributeError(
AttributeError: Rectangle.set() got an unexpected keyword argument 'normed'
matplotlib 内部のエラーのようです。matplotlib の改修(先祖帰りバグの改修)を待つしかない。
Python 3.11.6 (matplotlib 3.7.1) では、下記のようなエラーがあり、実行できない。
Traceback (most recent call last): File "M:\______\histogram_percent_demo.py", line 21, in
Python 3.12.0 (matplotlib 3.8.1) では、下記のようなエラーがあり、実行できない。plt.hist(x, bins=50, normed=True) File "C:\Users\kamif\AppData\Local\Programs\Python\Python311\Lib \site-packages\matplotlib\pyplot.py", line 2645, in hist return gca().hist( ^^^^^^^^^^^ File "C:\Users\kamif\AppData\Local\Programs\Python\Python311\Lib \site-packages\matplotlib\__init__.py", line 1459, in inner return func(ax, *map(sanitize_sequence, args), **kwargs) ^^^^^^^^^^^^^^^^^^^^^^^^^^^^^^^^^^^^^^^^^^^^^^^^^ File "C:\Users\kamif\AppData\Local\Programs\Python\Python311\Lib \site-packages\matplotlib\axes\_axes.py", line 6943, in hist p._internal_update(kwargs) File "C:\Users\kamif\AppData\Local\Programs\Python\Python311\Lib \site-packages\matplotlib\artist.py", line 1223, in _internal_update return self._update_props( ^^^^^^^^^^^^^^^^^^^ File "C:\Users\kamif\AppData\Local\Programs\Python\Python311\Lib \site-packages\matplotlib\artist.py", line 1197, in _update_props raise AttributeError( AttributeError: Rectangle.set() got an unexpected keyword argument 'normed'
Traceback (most recent call last): File "E:\______\histogram_percent_demo.py", line 21, in
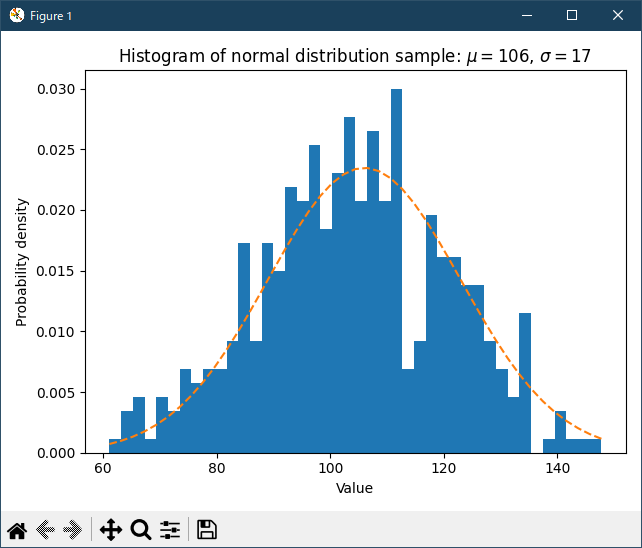
Python 3.11.6 (matplotlib 3.7.1) 及び Python 3.12.0 (matplotlib 3.8.1) で、見直し中、新しいサンプル( statistics-histogram-features-py ) を見つけ、下記のコードで、正常に実行できました。plt.hist(x, bins=50, normed=True) File "C:\Program Files\Python312\Lib\site-packages\matplotlib\pyplot.py", line 3224, in hist return gca().hist( ^^^^^^^^^^^ File "C:\Program Files\Python312\Lib\site-packages\matplotlib\__init__.py", line 1478, in inner return func(ax, *map(sanitize_sequence, args), **kwargs) ^^^^^^^^^^^^^^^^^^^^^^^^^^^^^^^^^^^^^^^^^^^^^^^^^ File "C:\Program Files\Python312\Lib\site-packages\matplotlib\axes\_axes.py", line 7012, in hist p._internal_update(kwargs) File "C:\Program Files\Python312\Lib\site-packages\matplotlib\artist.py", line 1219, in _internal_update return self._update_props( ^^^^^^^^^^^^^^^^^^^ File "C:\Program Files\Python312\Lib\site-packages\matplotlib\artist.py", line 1193, in _update_props raise AttributeError( AttributeError: Rectangle.set() got an unexpected keyword argument 'normed'
"""
==============================================
Some features of the histogram (hist) function
==============================================

In addition to the basic histogram, this demo shows a few optional features:

* Setting the number of data bins.
* The *density* parameter, which normalizes bin heights so that the integral of
  the histogram is 1. The resulting histogram is an approximation of the
  probability density function.

Selecting different bin counts and sizes can significantly affect the shape
of a histogram. The Astropy docs have a great section_ on how to select these
parameters.

.. _section: http://docs.astropy.org/en/stable/visualization/histogram.html
"""

import matplotlib.pyplot as plt
import numpy as np

rng = np.random.default_rng(19680801)

# example data
mu = 106  # mean of distribution
sigma = 17  # standard deviation of distribution
x = rng.normal(loc=mu, scale=sigma, size=420)

num_bins = 42

fig, ax = plt.subplots()

# the histogram of the data
n, bins, patches = ax.hist(x, num_bins, density=True)

# add a 'best fit' line
y = ((1 / (np.sqrt(2 * np.pi) * sigma)) *
     np.exp(-0.5 * (1 / sigma * (bins - mu))**2))
ax.plot(bins, y, '--')
ax.set_xlabel('Value')
ax.set_ylabel('Probability density')
ax.set_title('Histogram of normal distribution sample: '
             fr'$\mu={mu:.0f}$, $\sigma={sigma:.0f}$')

# Tweak spacing to prevent clipping of ylabel
fig.tight_layout()
plt.show()

# %%
#
# .. admonition:: References
#
#    The use of the following functions, methods, classes and modules is shown
#    in this example:
#
#    - `matplotlib.axes.Axes.hist` / `matplotlib.pyplot.hist`
#    - `matplotlib.axes.Axes.set_title`
#    - `matplotlib.axes.Axes.set_xlabel`
#    - `matplotlib.axes.Axes.set_ylabel`
Python 3.11.6 (matplotlib 3.7.1) 及び Python 3.12.0 (matplotlib 3.8.1) 共に、正常実行です。
- 参照ページ
pylab_examples_Examples code: histogram_percent_demo.py
statistics-histogram-features-py
- リリースノート
- 2023/11/26 Ver=1.04 Python 3.12.0 (matplotlib 3.8.1)で確認
- 2023/11/26 Ver=1.04 Python 3.11.6 (matplotlib 3.7.1)で確認
- 2023/04/02 Ver=1.03 Python 3.11.2 で確認
- 2020/10/31 Ver=1.01 Python 3.7.8 で確認
- 2018/12/01 Ver=1.01 初版リリース
- 関連ページ