|
|
pylab_examples_Examples 94_hist2d_demo. |
H.Kamifuji . |
- hist2d_demo.py
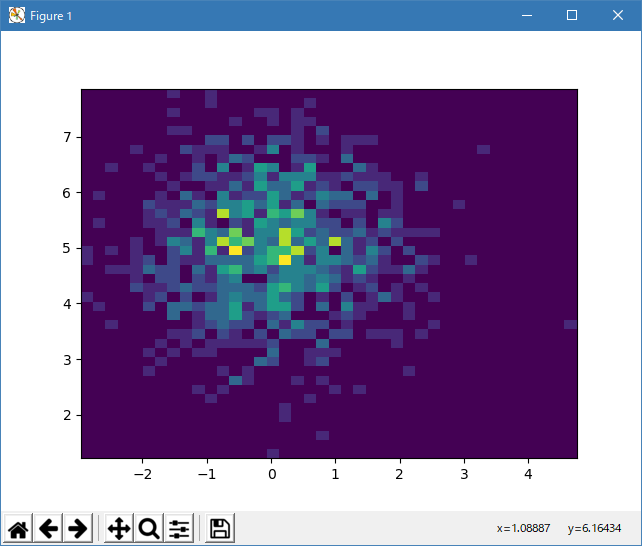
import matplotlib.pyplot as plt
import numpy as np
x = np.random.randn(1000)
y = np.random.randn(1000) + 5

# normal distribution center at x=0 and y=5
plt.hist2d(x, y, bins=40)
plt.show()
- 実行結果( hist2d_demo.png )
- 参照ページ
pylab_examples_Examples code: hist2d_demo.py
- リリースノート
- 2023/04/02 Ver=1.03 Python 3.11.2 で確認
- 2020/10/31 Ver=1.01 Python 3.7.8 で確認
- 2018/12/01 Ver=1.01 初版リリース
- 関連ページ