|
|
pylab_examples_Examples 85_ganged_plots. |
H.Kamifuji . |
- ganged_plots.py
共通の軸(視覚的に)を共有するプロットを作成するには、0 に近いサブプロット間の hspace を設定できます(ゼロ自体は使用しないでください)。 通常は、軸の1つを除くすべての目盛りラベルをオフにします。
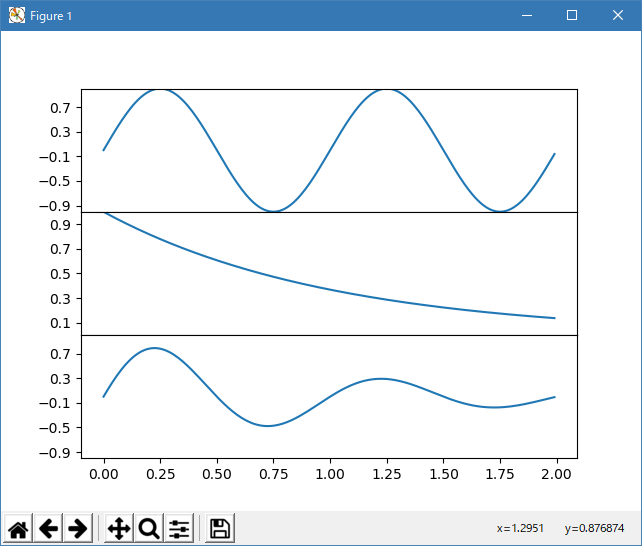
"""
To create plots that share a common axes (visually) you can set the
hspace between the subplots close to zero (do not use zero itself).
Normally you'll want to turn off the tick labels on all but one of the
axes.

In this example the plots share a common xaxis but you can follow the
same logic to supply a common y axis.
"""
import matplotlib.pyplot as plt
import numpy as np

t = np.arange(0.0, 2.0, 0.01)

s1 = np.sin(2*np.pi*t)
s2 = np.exp(-t)
s3 = s1*s2

# axes rect in relative 0,1 coords left, bottom, width, height.  Turn
# off xtick labels on all but the lower plot


f = plt.figure()
plt.subplots_adjust(hspace=0.001)


ax1 = plt.subplot(311)
ax1.plot(t, s1)
plt.yticks(np.arange(-0.9, 1.0, 0.4))
plt.ylim(-1, 1)

ax2 = plt.subplot(312, sharex=ax1)
ax2.plot(t, s2)
plt.yticks(np.arange(0.1, 1.0, 0.2))
plt.ylim(0, 1)

ax3 = plt.subplot(313, sharex=ax1)
ax3.plot(t, s3)
plt.yticks(np.arange(-0.9, 1.0, 0.4))
plt.ylim(-1, 1)

xticklabels = ax1.get_xticklabels() + ax2.get_xticklabels()
plt.setp(xticklabels, visible=False)

plt.show()
- 実行結果( ganged_plots.png )
- 参照ページ
pylab_examples_Examples code: ganged_plots.py
- リリースノート
- 2023/04/02 Ver=1.03 Python 3.11.2 で確認
- 2020/10/31 Ver=1.01 Python 3.7.8 で確認
- 2018/12/01 Ver=1.01 初版リリース
- 関連ページ