|
|
pylab_examples_Examples 76_figlegend_demo. |
H.Kamifuji . |
- figlegend_demo.py
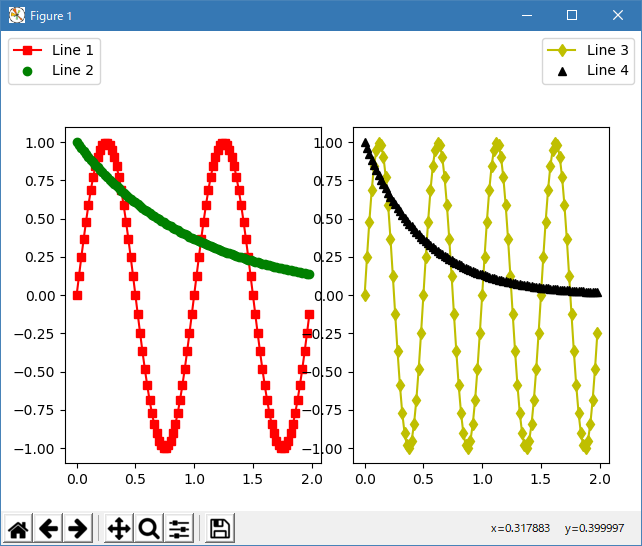
import numpy as np
import matplotlib.pyplot as plt

fig = plt.figure()
ax1 = fig.add_axes([0.1, 0.1, 0.4, 0.7])
ax2 = fig.add_axes([0.55, 0.1, 0.4, 0.7])

x = np.arange(0.0, 2.0, 0.02)
y1 = np.sin(2*np.pi*x)
y2 = np.exp(-x)
l1, l2 = ax1.plot(x, y1, 'rs-', x, y2, 'go')

y3 = np.sin(4*np.pi*x)
y4 = np.exp(-2*x)
l3, l4 = ax2.plot(x, y3, 'yd-', x, y4, 'k^')

fig.legend((l1, l2), ('Line 1', 'Line 2'), 'upper left')
fig.legend((l3, l4), ('Line 3', 'Line 4'), 'upper right')
plt.show()
- 実行結果( figlegend_demo.png )
Python 3.11.6 (matplotlib 3.7.1) では、下記のような警告があるが、実行できる。
M:\______\figlegend_demo.py:17: MatplotlibDeprecationWarning:
  Passing the loc parameter of __init__() positionally is deprecated since Matplotlib 3.6;
  the parameter will become keyword-only two minor releases later.
  fig.legend((l1, l2), ('Line 1', 'Line 2'), 'upper left')
M:\______\figlegend_demo.py:18: MatplotlibDeprecationWarning:
  Passing the loc parameter of __init__() positionally is deprecated since Matplotlib 3.6;
  the parameter will become keyword-only two minor releases later.
  fig.legend((l3, l4), ('Line 3', 'Line 4'), 'upper right')
Python 3.12.0 (matplotlib 3.8.1) では、下記のようなエラーがあり、実行できない。
Traceback (most recent call last): File "E:\______\figlegend_demo.py", line 17, in
Python 3.11.6 (matplotlib 3.7.1) 及び Python 3.12.0 (matplotlib 3.8.1) で、見直し中、新しいサンプル(text-labels-and-annotations-figlegend-demo-py) を見つけ、下記のコードで、正常に実行できました。fig.legend((l1, l2), ('Line 1', 'Line 2'), 'upper left') File "C:\Program Files\Python312\Lib\site-packages\matplotlib\figure.py", line 1146, in legend handles, labels, kwargs = mlegend._parse_legend_args(self.axes, *args, **kwargs) ^^^^^^^^^^^^^^^^^^^^^^^^^^^^^^^^^^^^^^^^^^^^^^^^^^^^^^ File "C:\Program Files\Python312\Lib\site-packages\matplotlib\legend.py", line 1382, in _parse_legend_args raise _api.nargs_error('legend', '0-2', len(args)) TypeError: legend() takes 0-2 positional arguments but 3 were given
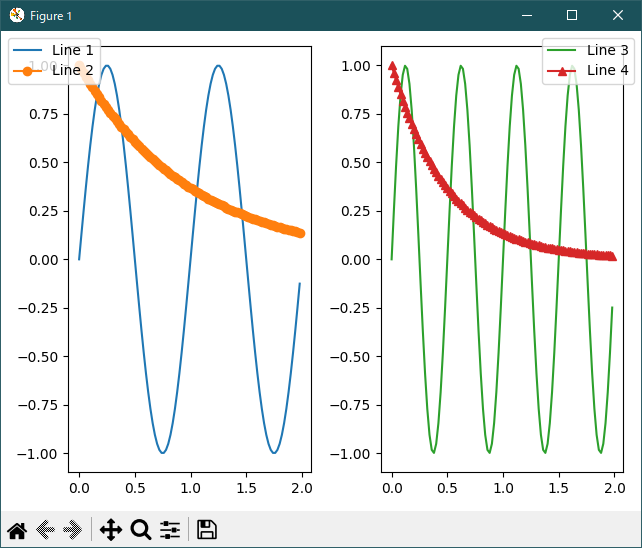
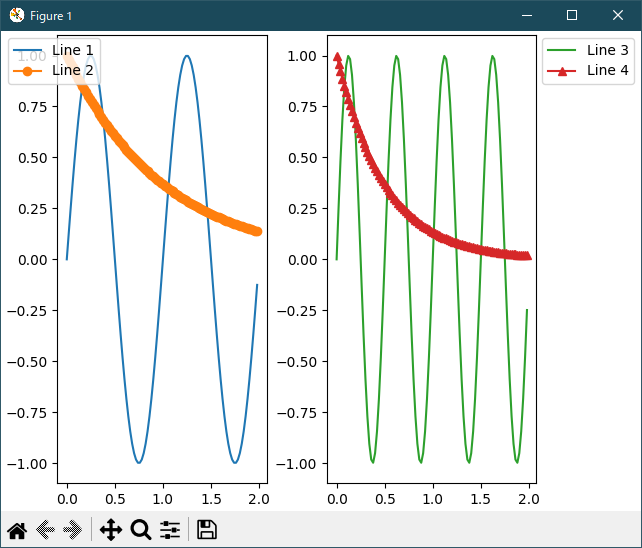
"""
==================
Figure legend demo
==================

Instead of plotting a legend on each axis, a legend for all the artists on all
the sub-axes of a figure can be plotted instead.
"""

import matplotlib.pyplot as plt
import numpy as np

fig, axs = plt.subplots(1, 2)

x = np.arange(0.0, 2.0, 0.02)
y1 = np.sin(2 * np.pi * x)
y2 = np.exp(-x)
l1, = axs[0].plot(x, y1)
l2, = axs[0].plot(x, y2, marker='o')

y3 = np.sin(4 * np.pi * x)
y4 = np.exp(-2 * x)
l3, = axs[1].plot(x, y3, color='tab:green')
l4, = axs[1].plot(x, y4, color='tab:red', marker='^')

fig.legend((l1, l2), ('Line 1', 'Line 2'), loc='upper left')
fig.legend((l3, l4), ('Line 3', 'Line 4'), loc='upper right')

plt.tight_layout()
plt.show()

# %%
# Sometimes we do not want the legend to overlap the axes.  If you use
# *constrained layout* you can specify "outside right upper", and
# *constrained layout* will make room for the legend.

fig, axs = plt.subplots(1, 2, layout='constrained')

x = np.arange(0.0, 2.0, 0.02)
y1 = np.sin(2 * np.pi * x)
y2 = np.exp(-x)
l1, = axs[0].plot(x, y1)
l2, = axs[0].plot(x, y2, marker='o')

y3 = np.sin(4 * np.pi * x)
y4 = np.exp(-2 * x)
l3, = axs[1].plot(x, y3, color='tab:green')
l4, = axs[1].plot(x, y4, color='tab:red', marker='^')

fig.legend((l1, l2), ('Line 1', 'Line 2'), loc='upper left')
fig.legend((l3, l4), ('Line 3', 'Line 4'), loc='outside right upper')

plt.show()
Python 3.11.6 (matplotlib 3.7.1) 及び Python 3.12.0 (matplotlib 3.8.1) 共に、正常実行です。
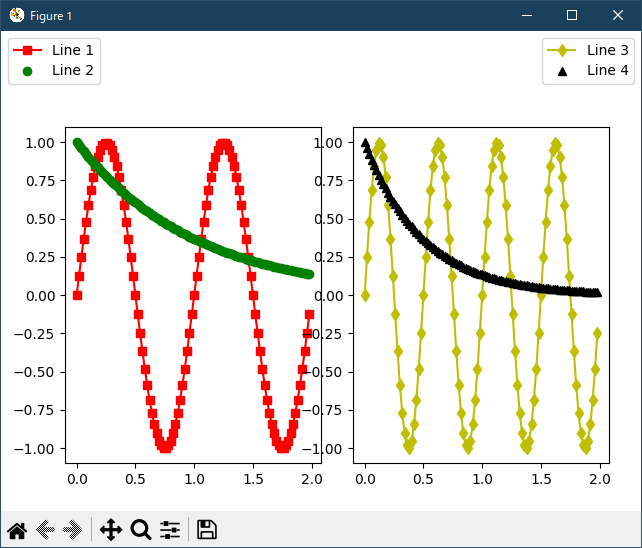
Python 3.11.6 (matplotlib 3.7.1) での警告から、キーワード指定に改修してみました。アプリ・リファレンス( legend_api) によると、このサンプルでは、loc='xxxx' に書き換えればいいようです。
import numpy as np
import matplotlib.pyplot as plt

fig = plt.figure()
ax1 = fig.add_axes([0.1, 0.1, 0.4, 0.7])
ax2 = fig.add_axes([0.55, 0.1, 0.4, 0.7])

x = np.arange(0.0, 2.0, 0.02)
y1 = np.sin(2*np.pi*x)
y2 = np.exp(-x)
l1, l2 = ax1.plot(x, y1, 'rs-', x, y2, 'go')

y3 = np.sin(4*np.pi*x)
y4 = np.exp(-2*x)
l3, l4 = ax2.plot(x, y3, 'yd-', x, y4, 'k^')

fig.legend((l1, l2), ('Line 1', 'Line 2'), loc='upper left')
fig.legend((l3, l4), ('Line 3', 'Line 4'), loc='upper right')

plt.show()
Python 3.11.6 (matplotlib 3.7.1) 及び Python 3.12.0 (matplotlib 3.8.1) 共に、正常実行です。
- 参照ページ
pylab_examples_Examples code: figlegend_demo.py
text-labels-and-annotations-figlegend-demo-py
legend_api
- リリースノート
- 2023/11/26 Ver=1.04 Python 3.12.0 (matplotlib 3.8.1)で確認
- 2023/11/26 Ver=1.04 Python 3.11.6 (matplotlib 3.7.1)で確認
- 2023/04/02 Ver=1.03 Python 3.11.2 で確認
- 2020/10/31 Ver=1.01 Python 3.7.8 で確認
- 2018/12/01 Ver=1.01 初版リリース
- 関連ページ