|
|
pylab_examples_Examples 66_equal_aspect_ratio. |
H.Kamifuji . |
- equal_aspect_ratio.py
例:単純な線グラフ。 同じアスペクト比を持つプロットを作成する方法を示します。
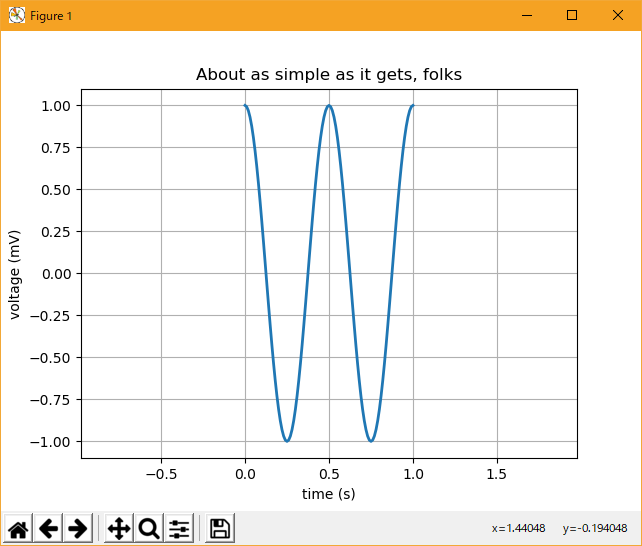
"""
Example: simple line plot.
Show how to make a plot that has equal aspect ratio
"""
import matplotlib.pyplot as plt
import numpy as np

t = np.arange(0.0, 1.0 + 0.01, 0.01)
s = np.cos(2*2*np.pi*t)
plt.plot(t, s, '-', lw=2)

plt.xlabel('time (s)')
plt.ylabel('voltage (mV)')
plt.title('About as simple as it gets, folks')
plt.grid(True)

plt.axes().set_aspect('equal', 'datalim')


plt.show()
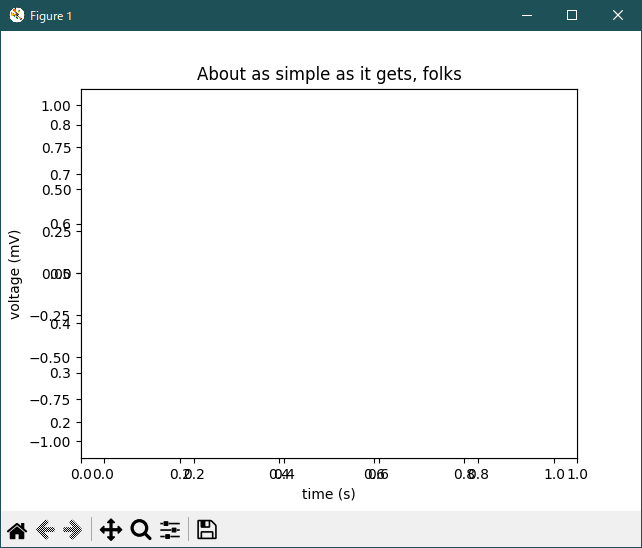
- 実行結果( equal_aspect_ratio.png )
Python 3.11.6 (matplotlib 3.7.1) 及び Python 3.12.0 (matplotlib 3.8.1) 共に、エラーなく、実行するが、下記のような表示で、意図した結果ではない。
Python 3.11.6 (matplotlib 3.7.1) 及び Python 3.12.0 (matplotlib 3.8.1) で、見直し中、新しいサンプル(subplots-axes-and-figures-axis-equal-demo-py) を見つけ、下記のコードで、正常に実行できました。
"""
=======================
Equal axis aspect ratio
=======================

How to set and adjust plots with equal axis aspect ratios.
"""

import matplotlib.pyplot as plt
import numpy as np

# Plot circle of radius 3.

an = np.linspace(0, 2 * np.pi, 100)
fig, axs = plt.subplots(2, 2)

axs[0, 0].plot(3 * np.cos(an), 3 * np.sin(an))
axs[0, 0].set_title('not equal, looks like ellipse', fontsize=10)

axs[0, 1].plot(3 * np.cos(an), 3 * np.sin(an))
axs[0, 1].axis('equal')
axs[0, 1].set_title('equal, looks like circle', fontsize=10)

axs[1, 0].plot(3 * np.cos(an), 3 * np.sin(an))
axs[1, 0].axis('equal')
axs[1, 0].set(xlim=(-3, 3), ylim=(-3, 3))
axs[1, 0].set_title('still a circle, even after changing limits', fontsize=10)

axs[1, 1].plot(3 * np.cos(an), 3 * np.sin(an))
axs[1, 1].set_aspect('equal', 'box')
axs[1, 1].set_title('still a circle, auto-adjusted data limits', fontsize=10)

fig.tight_layout()

plt.show()
Python 3.11.6 (matplotlib 3.7.1) 及び Python 3.12.0 (matplotlib 3.8.1) 共に、正常実行です。

- 参照ページ
pylab_examples_Examples code: equal_aspect_ratio.py
subplots-axes-and-figures-axis-equal-demo-py
- リリースノート
- 2023/11/26 Ver=1.04 Python 3.12.0 (matplotlib 3.8.1)で確認
- 2023/11/26 Ver=1.04 Python 3.11.6 (matplotlib 3.7.1)で確認
- 2023/04/02 Ver=1.03 Python 3.11.2 で確認
- 2020/10/31 Ver=1.01 Python 3.7.8 で確認
- 2018/12/01 Ver=1.01 初版リリース
- 関連ページ