|
|
pylab_examples_Examples 57_demo_bboximage. |
H.Kamifuji . |
- demo_bboximage.py
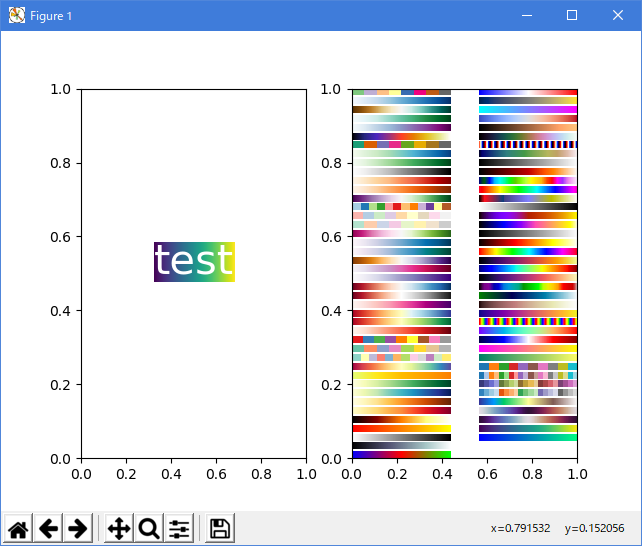
import matplotlib.pyplot as plt
import numpy as np
from matplotlib.image import BboxImage
from matplotlib.transforms import Bbox, TransformedBbox

if __name__ == "__main__":

    fig = plt.figure(1)
    ax = plt.subplot(121)

    txt = ax.text(0.5, 0.5, "test", size=30, ha="center", color="w")
    kwargs = dict()

    bbox_image = BboxImage(txt.get_window_extent,
                           norm=None,
                           origin=None,
                           clip_on=False,
                           **kwargs
                           )
    a = np.arange(256).reshape(1, 256)/256.
    bbox_image.set_data(a)
    ax.add_artist(bbox_image)

    ax = plt.subplot(122)
    a = np.linspace(0, 1, 256).reshape(1, -1)
    a = np.vstack((a, a))

    maps = sorted(
        m for m in plt.cm.cmap_d
        if not m.endswith("_r") and  # Skip reversed colormaps.
        not m.startswith(('spectral', 'Vega'))  # Skip deprecated colormaps.
    )

    #fig.subplots_adjust(top=0.99, bottom=0.01, left=0.2, right=0.99)

    ncol = 2
    nrow = len(maps)//ncol + 1

    xpad_fraction = 0.3
    dx = 1./(ncol + xpad_fraction*(ncol - 1))

    ypad_fraction = 0.3
    dy = 1./(nrow + ypad_fraction*(nrow - 1))

    for i, m in enumerate(maps):
        ix, iy = divmod(i, nrow)
        #plt.figimage(a, 10, i*10, cmap=plt.get_cmap(m), origin='lower')
        bbox0 = Bbox.from_bounds(ix*dx*(1 + xpad_fraction),
                                 1. - iy*dy*(1 + ypad_fraction) - dy,
                                 dx, dy)
        bbox = TransformedBbox(bbox0, ax.transAxes)

        bbox_image = BboxImage(bbox,
                               cmap=plt.get_cmap(m),
                               norm=None,
                               origin=None,
                               **kwargs
                               )

        bbox_image.set_data(a)
        ax.add_artist(bbox_image)

    plt.draw()
    plt.show()
- 実行結果( demo_bboximage.png )
Python 3.11.2 見直しました。上記のコードでは、下記のエラーが発生します。
Traceback (most recent call last):
File "_:\demo_bboximage.py", line 29, in <module>
m for m in plt.cm.cmap_d
^^^^^^^^^^^^^
AttributeError: module 'matplotlib.cm' has no attribute 'cmap_d'
matplotlib 内部のエラーのようです。matplotlib の改修(先祖帰りバグの改修)を待つしかない。
Python 3.11.6 (matplotlib 3.7.1) では、下記のようなエラーがあり、実行できない。
Traceback (most recent call last): File "M:\______\demo_bboximage.py", line 29, in
Python 3.12.0 (matplotlib 3.8.1) では、下記のようなエラーがあり、実行できない。m for m in plt.cm.cmap_d ^^^^^^^^^^^^^ AttributeError: module 'matplotlib.cm' has no attribute 'cmap_d'
Traceback (most recent call last): File "E:\______\demo_bboximage.py", line 29, in
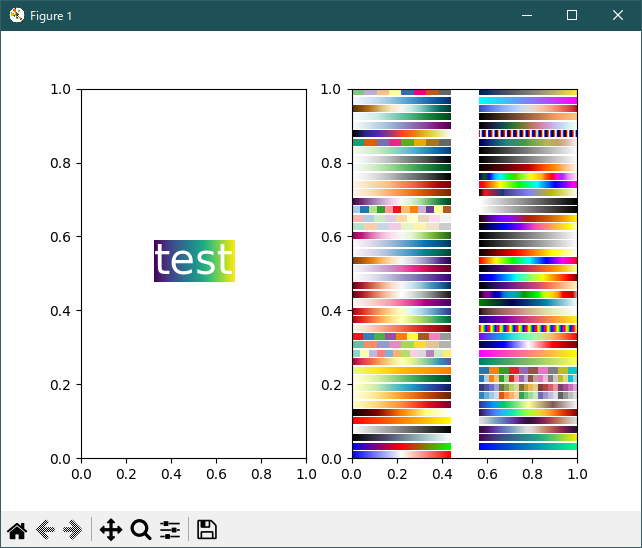
Python 3.11.6 (matplotlib 3.7.1) 及び Python 3.12.0 (matplotlib 3.8.1) で、見直し中、新しいサンプル(images-contours-and-fields-demo-bboximage-py) を見つけ、下記のコードで、正常に実行できました。m for m in plt.cm.cmap_d ^^^^^^^^^^^^^ AttributeError: module 'matplotlib.cm' has no attribute 'cmap_d'
"""
==============
BboxImage Demo
==============

A `~matplotlib.image.BboxImage` can be used to position an image according to
a bounding box. This demo shows how to show an image inside a `.text.Text`'s
bounding box as well as how to manually create a bounding box for the image.
"""

import matplotlib.pyplot as plt
import numpy as np

from matplotlib.image import BboxImage
from matplotlib.transforms import Bbox, TransformedBbox

fig, (ax1, ax2) = plt.subplots(ncols=2)

# ----------------------------
# Create a BboxImage with Text
# ----------------------------
txt = ax1.text(0.5, 0.5, "test", size=30, ha="center", color="w")
ax1.add_artist(
    BboxImage(txt.get_window_extent, data=np.arange(256).reshape((1, -1))))

# ------------------------------------
# Create a BboxImage for each colormap
# ------------------------------------
# List of all colormaps; skip reversed colormaps.
cmap_names = sorted(m for m in plt.colormaps if not m.endswith("_r"))

ncol = 2
nrow = len(cmap_names) // ncol + 1

xpad_fraction = 0.3
dx = 1 / (ncol + xpad_fraction * (ncol - 1))

ypad_fraction = 0.3
dy = 1 / (nrow + ypad_fraction * (nrow - 1))

for i, cmap_name in enumerate(cmap_names):
    ix, iy = divmod(i, nrow)
    bbox0 = Bbox.from_bounds(ix*dx*(1+xpad_fraction),
                             1 - iy*dy*(1+ypad_fraction) - dy,
                             dx, dy)
    bbox = TransformedBbox(bbox0, ax2.transAxes)
    ax2.add_artist(
        BboxImage(bbox, cmap=cmap_name, data=np.arange(256).reshape((1, -1))))

plt.show()

# %%
#
# .. admonition:: References
#
#    The use of the following functions, methods, classes and modules is shown
#    in this example:
#
#    - `matplotlib.image.BboxImage`
#    - `matplotlib.transforms.Bbox`
#    - `matplotlib.transforms.TransformedBbox`
#    - `matplotlib.text.Text`
Python 3.11.6 (matplotlib 3.7.1) 及び Python 3.12.0 (matplotlib 3.8.1) 共に、正常実行です。
- 参照ページ
pylab_examples_Examples code: demo_bboximage.py
images-contours-and-fields-demo-bboximage-py
- リリースノート
- 2023/11/24 Ver=1.04 Python 3.12.0 (matplotlib 3.8.1)で確認
- 2023/11/24 Ver=1.04 Python 3.11.6 (matplotlib 3.7.1)で確認
- 2023/04/02 Ver=1.03 Python 3.11.2 で確認
- 2020/10/31 Ver=1.01 Python 3.7.8 で確認
- 2018/12/01 Ver=1.01 初版リリース
- 関連ページ