|
|
pylab_examples_Examples 56_demo_annotation_box. |
H.Kamifuji . |
- demo_annotation_box.py
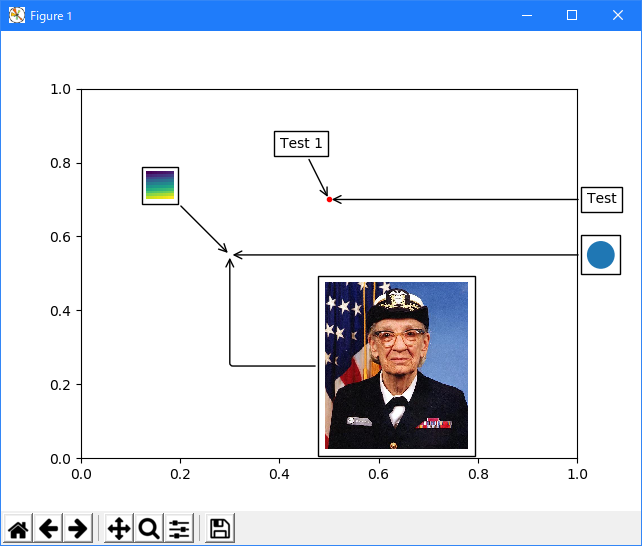
import matplotlib.pyplot as plt
import numpy as np

from matplotlib.patches import Circle
from matplotlib.offsetbox import (TextArea, DrawingArea, OffsetImage,
                                  AnnotationBbox)
from matplotlib.cbook import get_sample_data


if 1:
    fig, ax = plt.subplots()

    # Define a 1st position to annotate (display it with a marker)
    xy = (0.5, 0.7)
    ax.plot(xy[0], xy[1], ".r")

    # Annotate the 1st position with a text box ('Test 1')
    offsetbox = TextArea("Test 1", minimumdescent=False)

    ab = AnnotationBbox(offsetbox, xy,
                        xybox=(-20, 40),
                        xycoords='data',
                        boxcoords="offset points",
                        arrowprops=dict(arrowstyle="->"))
    ax.add_artist(ab)

    # Annotate the 1st position with another text box ('Test')
    offsetbox = TextArea("Test", minimumdescent=False)

    ab = AnnotationBbox(offsetbox, xy,
                        xybox=(1.02, xy[1]),
                        xycoords='data',
                        boxcoords=("axes fraction", "data"),
                        box_alignment=(0., 0.5),
                        arrowprops=dict(arrowstyle="->"))
    ax.add_artist(ab)

    # Define a 2nd position to annotate (don't display with a marker this time)
    xy = [0.3, 0.55]

    # Annotate the 2nd position with a circle patch
    da = DrawingArea(20, 20, 0, 0)
    p = Circle((10, 10), 10)
    da.add_artist(p)

    ab = AnnotationBbox(da, xy,
                        xybox=(1.02, xy[1]),
                        xycoords='data',
                        boxcoords=("axes fraction", "data"),
                        box_alignment=(0., 0.5),
                        arrowprops=dict(arrowstyle="->"))

    ax.add_artist(ab)

    # Annotate the 2nd position with an image (a generated array of pixels)
    arr = np.arange(100).reshape((10, 10))
    im = OffsetImage(arr, zoom=2)
    im.image.axes = ax

    ab = AnnotationBbox(im, xy,
                        xybox=(-50., 50.),
                        xycoords='data',
                        boxcoords="offset points",
                        pad=0.3,
                        arrowprops=dict(arrowstyle="->"))

    ax.add_artist(ab)

    # Annotate the 2nd position with another image (a Grace Hopper portrait)
    fn = get_sample_data("grace_hopper.png", asfileobj=False)
    arr_img = plt.imread(fn, format='png')

    imagebox = OffsetImage(arr_img, zoom=0.2)
    imagebox.image.axes = ax

    ab = AnnotationBbox(imagebox, xy,
                        xybox=(120., -80.),
                        xycoords='data',
                        boxcoords="offset points",
                        pad=0.5,
                        arrowprops=dict(
                            arrowstyle="->",
                            connectionstyle="angle,angleA=0,angleB=90,rad=3")
                        )

    ax.add_artist(ab)

    # Fix the display limits to see everything
    ax.set_xlim(0, 1)
    ax.set_ylim(0, 1)

    plt.show()
- 実行結果( demo_annotation_box.png )
Python 3.11.2 見直しました。上記のコードでは、下記のエラーが発生します。
Traceback (most recent call last):
File "_:\demo_annotation_box.py", line 18, in <module>
offsetbox = TextArea("Test 1", minimumdescent=False)
^^^^^^^^^^^^^^^^^^^^^^^^^^^^^^^^^^^^^^^^
File "C:\Users\_____\AppData\Local\Programs\Python\Python311\Lib\site-packages\matplotlib\_api\deprecation.py", line 454, in wrapper
return func(*args, **kwargs)
^^^^^^^^^^^^^^^^^^^^^
TypeError: TextArea.__init__() got an unexpected keyword argument 'minimumdescent'
matplotlib 内部のエラーのようです。matplotlib の改修(先祖帰りバグの改修)を待つしかない。
Python 3.11.6 (matplotlib 3.7.1) では、下記のようなエラーがあり、実行できない。
Traceback (most recent call last): File "M:\______\demo_annotation_box.py", line 18, in
Python 3.12.0 (matplotlib 3.8.1) では、下記のようなエラーがあり、実行できない。offsetbox = TextArea("Test 1", minimumdescent=False) ^^^^^^^^^^^^^^^^^^^^^^^^^^^^^^^^^^^^^^^^ File "C:\Users\______\AppData\Local\Programs\Python\Python311\Lib \site-packages\matplotlib\_api\deprecation.py", line 454, in wrapper return func(*args, **kwargs) ^^^^^^^^^^^^^^^^^^^^^ TypeError: TextArea.__init__() got an unexpected keyword argument 'minimumdescent'
Traceback (most recent call last): File "E:\______\demo_annotation_box.py", line 18, in
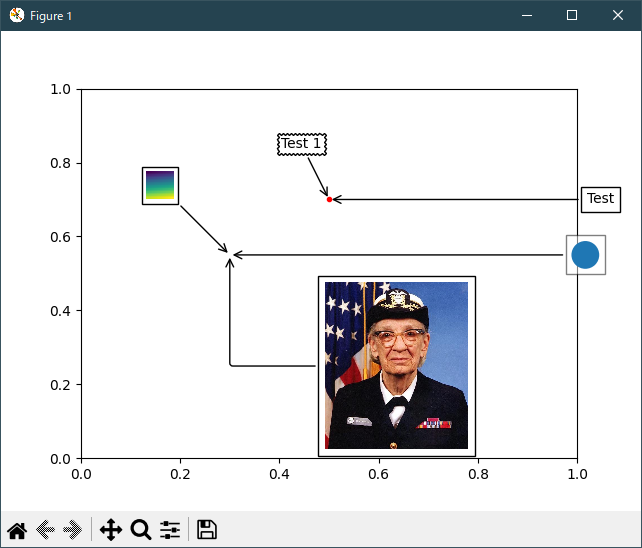
Python 3.11.6 (matplotlib 3.7.1) 及び Python 3.12.0 (matplotlib 3.8.1) で、見直し中、新しいサンプル(text-labels-and-annotations-demo-annotation-box-py) を見つけ、下記のコードで、正常に実行できました。offsetbox = TextArea("Test 1", minimumdescent=False) ^^^^^^^^^^^^^^^^^^^^^^^^^^^^^^^^^^^^^^^^ TypeError: TextArea.__init__() got an unexpected keyword argument 'minimumdescent'
"""
===================
AnnotationBbox demo
===================

`.AnnotationBbox` creates an annotation using an `.OffsetBox`, and
provides more fine-grained control than `.Axes.annotate`.  This example
demonstrates the use of AnnotationBbox together with three different
OffsetBoxes: `.TextArea`, `.DrawingArea`, and `.OffsetImage`.
"""

import matplotlib.pyplot as plt
import numpy as np

from matplotlib.cbook import get_sample_data
from matplotlib.offsetbox import (AnnotationBbox, DrawingArea, OffsetImage,
                                  TextArea)
from matplotlib.patches import Circle

fig, ax = plt.subplots()

# Define a 1st position to annotate (display it with a marker)
xy = (0.5, 0.7)
ax.plot(xy[0], xy[1], ".r")

# Annotate the 1st position with a text box ('Test 1')
offsetbox = TextArea("Test 1")

ab = AnnotationBbox(offsetbox, xy,
                    xybox=(-20, 40),
                    xycoords='data',
                    boxcoords="offset points",
                    arrowprops=dict(arrowstyle="->"),
                    bboxprops=dict(boxstyle="sawtooth"))
ax.add_artist(ab)

# Annotate the 1st position with another text box ('Test')
offsetbox = TextArea("Test")

ab = AnnotationBbox(offsetbox, xy,
                    xybox=(1.02, xy[1]),
                    xycoords='data',
                    boxcoords=("axes fraction", "data"),
                    box_alignment=(0., 0.5),
                    arrowprops=dict(arrowstyle="->"))
ax.add_artist(ab)

# Define a 2nd position to annotate (don't display with a marker this time)
xy = [0.3, 0.55]

# Annotate the 2nd position with a circle patch
da = DrawingArea(20, 20, 0, 0)
p = Circle((10, 10), 10)
da.add_artist(p)

ab = AnnotationBbox(da, xy,
                    xybox=(1., xy[1]),
                    xycoords='data',
                    boxcoords=("axes fraction", "data"),
                    box_alignment=(0.2, 0.5),
                    arrowprops=dict(arrowstyle="->"),
                    bboxprops=dict(alpha=0.5))

ax.add_artist(ab)

# Annotate the 2nd position with an image (a generated array of pixels)
arr = np.arange(100).reshape((10, 10))
im = OffsetImage(arr, zoom=2)
im.image.axes = ax

ab = AnnotationBbox(im, xy,
                    xybox=(-50., 50.),
                    xycoords='data',
                    boxcoords="offset points",
                    pad=0.3,
                    arrowprops=dict(arrowstyle="->"))

ax.add_artist(ab)

# Annotate the 2nd position with another image (a Grace Hopper portrait)
with get_sample_data("grace_hopper.jpg") as file:
    arr_img = plt.imread(file)

imagebox = OffsetImage(arr_img, zoom=0.2)
imagebox.image.axes = ax

ab = AnnotationBbox(imagebox, xy,
                    xybox=(120., -80.),
                    xycoords='data',
                    boxcoords="offset points",
                    pad=0.5,
                    arrowprops=dict(
                        arrowstyle="->",
                        connectionstyle="angle,angleA=0,angleB=90,rad=3")
                    )

ax.add_artist(ab)

# Fix the display limits to see everything
ax.set_xlim(0, 1)
ax.set_ylim(0, 1)

plt.show()

# %%
#
# .. admonition:: References
#
#    The use of the following functions, methods, classes and modules is shown
#    in this example:
#
#    - `matplotlib.patches.Circle`
#    - `matplotlib.offsetbox.TextArea`
#    - `matplotlib.offsetbox.DrawingArea`
#    - `matplotlib.offsetbox.OffsetImage`
#    - `matplotlib.offsetbox.AnnotationBbox`
#    - `matplotlib.cbook.get_sample_data`
#    - `matplotlib.pyplot.subplots`
#    - `matplotlib.pyplot.imread`
Python 3.11.6 (matplotlib 3.7.1) 及び Python 3.12.0 (matplotlib 3.8.1) 共に、正常実行です。
- 参照ページ
pylab_examples_Examples code: demo_annotation_box.py
text-labels-and-annotations-demo-annotation-box-py
- リリースノート
- 2023/11/24 Ver=1.04 Python 3.12.0 (matplotlib 3.8.1)で確認
- 2023/11/24 Ver=1.04 Python 3.11.6 (matplotlib 3.7.1)で確認
- 2023/04/02 Ver=1.03 Python 3.11.2 で確認
- 2020/10/31 Ver=1.01 Python 3.7.8 で確認
- 2018/12/01 Ver=1.01 初版リリース
- 関連ページ